Revisiting the Duality of Smell: Route-dependent Effects on Olfactory
←
→
Page content transcription
If your browser does not render page correctly, please read the page content below
Revisiting the Duality of Smell: Route-dependent Effects on Olfactory
Perception and Language
Authors: Pellegrino, R.a1 Thomas Hörberg b1, Jonas Olofsson b, & Luckett, Curtis R.a
a
Department of Food Science, University of Tennessee, 2510 River Drive, Knoxville, Tennessee
b
Gösta Ekman Laboratory, Department of Psychology Stockholm University, Frescati hagväg 9,
Stockholm, Sweden
Author Contact Information: Robert Pellegrino (pellegrino.robert@gmail.com); Thomas Hörberg
(thomas_h@ling.su.se); Jonas Olofsson (jonas.olofsson@psychology.su.se); Curtis R. Luckett*
(cluckett@utk.edu)
*Corresponding Author
1
Authors contributed equally to the work
Abstract
Olfactory research in humans has largely focused on odors perceived via sniffing, orthonasal olfaction,
while ignoring odors perceived from the mouth, retronasal olfaction. Prior work on retronasally presented
odors use animal models and focus mainly on odor sensitivity, but little is known about retronasal
olfactory perception and cognition in humans. In this study, we compared orthonasal and retronasal odor
presentation routes to investigate differences in odor descriptions and evaluations. Thirty-six individuals
participated in a within-subjects study using twelve odors (varying in pleasantness and edibility) in
perceptual and semantic tasks. As expected, we found route-dependent differences in perceptual odor
quality (pleasantness, edibility, and familiarity ratings), and a better ability to identify odors during
orthonasal presentation. Additionally, more concrete (and source-based) language was used when
describing odors presented orthonasally. Exploratory analyses revealed that while orthonasal odors were
described with words that had visual associations, retronasal odors were described with words that had
interoceptive associations. Interestingly, these route-dependent differences in descriptor usage were not
explained by sensitivity and intensity differences, suggesting cognitive and linguistic processes differed
between odors presented orthonasally and retronasally. Our results indicate that olfaction is in fact a dual
sense, in which the routes change the perception of an odor.
Highlights
We show notable differences in how we describe odors depending on if the odor comes from the
nose or the mouth.
More concrete and source-based language was used when describing odors presented through the
nostrils.
Olfactory sensitivity and intensity did not explain route-dependent differences in descriptor
usage.
Introduction

The sense of smell is unique in that the very same receptors can be activated by two distinct stimulation

pathways, orthonasal (external odors are transported by air flowing in through our nostrils) and retronasal

(odors inside our mouths are transported out through our nostrils). The possible effects of this profound

anatomical distinction are not well understood, as most research on human olfactory perception focused

on the orthonasal route. Each route is suggested to serve complementary evolutionary functions.

Orthonasal olfaction plays a major role in tracking and spatial memory in many species (Jacobs, 2019),

while the retronasal route plays a pivotal role in the eating/drinking experience and thus is especially

important to appetite, nutrition and quality of life (Keller and Malaspina, 2013; Croy et al., 2014). Other

functions are shared across routes, as detection and identification of hazardous substances by means of

smell before ingestion. Although the same odor may present itself through both routes, the route of

stimulation affects neural processing at both peripheral and central levels in humans (Heilmann and

Hummel, 2004; Small et al., 2005; Bojanowski and Hummel, 2012; Hummel et al., 2017). Even before

receptor interactions occur, anatomical differences affect airflow paths, and sorption rates of odorants

vary across the olfactory mucosa, leading to differences in activation patterns along the olfactory

epithelium (Frasnelli et al., 2005; Scott et al., 2007, 2014). When compared to orthonasal stimulation,

retronasal stimulation shows similar, but weaker activations in the olfactory bulb (Gautam and Verhagen,

2012; Gautam et al., 2014; Sanganahalli et al., 2020) but additional activations in the gustatory cortex

(Small et al., 2005; Blankenship et al., 2019). Thus the route of the odor may provide a “duality” in smell

(Rozin, 1982). However, the nature of this duality would be even more evident if behavioral outcomes

followed neural ones. In a recent report, Hannum and colleagues (Hannum et al 2018) delivered odors

orthonasally (sniffing) and retronasally (ingesting flavored liquids), and they found that participants are

less able to identify matching odor pairs when they were presented via alternate routes (i.e. orthonasal-

retronasal) compared to the same route (i.e. orthonasal-orthonasal or retronasal-retronasal). The authors

suggest that different cognitive strategies might have been employed, although the use of liquids might

have also added additional non-olfactory sensations in the retronasal condition to affect these results.
In the present work, we use verbal descriptions as a behavioral window to the human mind and

how it interprets external events. Linguistic analyses of the meaning of words, semantics, have rarely

been applied to the study of olfaction. Our ability to communicate olfactory experiences is limited

(Engen, 1987; Lorig, 1999; Majid, 2021), and a recent cross-cultural study showed that odors often have a

lower degree of linguistic codability than other sensory materials (Majid et al., 2018). In other words, we

are often good at discriminating between two odors, but unable to name odors with high accuracy

(Jönsson et al., 2005). Odor identification involves matching familiar odors to labels, and language-based

olfactory tasks involve not only sensory acuity but also memory, as there is an assignment of learned

meaning to the object being smelled (Engen, 1991). Whether the difficulty in naming odors is a

consequence of human cortical organization (Lorig, 1999; Olofsson et al., 2013; Olofsson and Gottfried,

2015b, 2015a) or due solely to cultural factors (Majid, 2015; Majid and Kruspe, 2018) is discussed

(Olofsson and Wilson, 2018); however, a combination of both might be at play. English, and at least other

Western languages like English, lack a specialized odor vocabulary, yet recent work on English olfactory

semantics suggests an organization along a few principal dimensions and categories such as pleasantness

and edibility (Iatropoulos et al., 2018; Hörberg et al., 2020). In the English language, a few descriptors

that primarily are used to describe odors exist (e.g. fragrant), but more often, people default to source-

based descriptors (e.g. lemon), evaluative descriptors (e.g. pleasant or strong) or abstract descriptors that

denote metaphorical, cross-modal perceptual properties (e.g. light) (Majid et al., 2018). The distinction

between source-based, abstract and evaluative descriptors is related to word concreteness (Brysbaert et

al., 2014); source-based descriptors such as apple are concrete, whereas evaluative descriptors such as

pleasant are abstract. Thus, concreteness is concerned with the degree to which a word denotes a

perceptual entity (Bryesbaert et al. 2014), and is highly related to word imageability—how easily a word

evokes a mental image (Bird et al., 2001).

        Olfactory descriptors also differ with respect to their olfactory-semantic properties in terms of

olfactory specificity and olfactory association - how specific a descriptor is in its description of odors and

how often it is mentioned in an odor context (Iatropoulos et al., 2018). For example, a word that is used
for a limited set of odor percepts (e.g. flowery) is of high specificity, while a word used to describe a wide
range of odor qualities (e.g. strong) is of low specificity.
Little is known about how stimulation routes affect how odors interact with lexical semantics to
produce verbal characterization. This study sought to determine if route-dependent differences in
olfactory language could be uncovered using recently developed tools for semantic analysis of olfactory
language (Iatropoulos et al., 2018; Hörberg et al., 2020). Odors were selected to represent the two
principal sensory dimensions, pleasantness and edibility, and we probed these perceptual qualities, as well
as intensity and familiarity, to obtain measures of perceptual sensitivity and memory activation,
respectively (similar to (Olofsson et al., 2013). We explored whether there were route-dependent
differences in verbal odor descriptions and ratings, differences that could not be explained by sensory
sensitivity and that would provide some evidence of route-dependent olfactory cognition.
We first established sensitivity and intensity differences across routes as well as basic verbal
capacity (e.g. ability to identify). Based on the freely given description of the odors, we further compared
the types of descriptors given across routes, in terms of semantic meaning as well as modality
associations - how strongly routes are associated with the gustatory and olfactory sensory modalities, but
also with the visual and interoceptive modalities. Since orthonasally perceived odors normally have
visible sources, orthonasally presented odors might evoke descriptors that denote visual objects.
Retronasally perceived odors, on the other hand, originate from sources inside the mouth, and may thus
be experienced interoceptively. The variability in odor descriptions was then investigated using
multivariate modeling with respect to the perceptual features of the odors, their presentation route, as well
as the semantic features of the descriptors themselves.
Lastly, we tested whether route differences in descriptor usage could be explained by differences
in sensitivity and perceived intensity, using mediation analyses.
Materials and Methods
ParticipantsThirty-six healthy adults (16, males, 20 females) ranging in age from 21 – 67 years (M = 37.6, SD = 12.6) participated in the study. Participants were all native English speakers and reported no smell impairments (acute or chronic). Recruitment was done through the University of Tennessee Center for Sensory Science participant database. All participants signed an informed consent form and were compensated for their time. This experiment was conducted according to the Declaration of Helsinki for studies on human subjects and approved by the University of Tennessee IRB review for research involving human subjects (IRB # 18-04342-XP). Stimulus delivery Odors were presented using opaque, brown Nalgene® plastic bottles (39 x 86 mm; mouth: 28mm). Orthonasal presentation was conventional (removal of cap) while the bottle was modified for retronasal based on the “straw” technique (Chen and Halpern, 2007) with an additional vacuum release nozzle (for a more naturalistic airflow; Figure 1). To use, individuals twist the blue valve allowing air to flow from the outside to carry odorant in the bottle when inhaling through the straw. This method has recently been validated by effectively distinguishing between smell loss groups, and by providing evidence of high test- retest reliability (Yoshino et al., 2021). Figure 1. Stimulus delivery bottles for retronasal odor presentation
Threshold assessment

The SMELL-S (v2) was used to measure detection threshold for each route. The SMELL-S uses a

combination of 30 odorants to create an unfamiliar, but pleasant odor mixture as the target odor and

paraffin oil was used for blanks (Hsieh et al., 2017). Mixtures, rather than single molecules, have been

shown to be more reliable in threshold testing (Hsieh et al., 2017; Oleszkiewicz et al., 2017). Target odors

ranged from 1:8 dilution of the mixture (highest concentration) to 1:262,144 (lowest concentration) with a

1:2 step dilution to create 16 levels of odor concentration. Threshold values were obtained using a 3-

alternative forced choice paradigm, in which the odor concentration (of the target bottle; 1 mL of mixture)

was decided with a Bayesian-based adaptive algorithm (QUEST) implemented with PsychoPy software

(Höchenberger and Ohla, 2019). The QUEST algorithm assumed a sigmoid psychometric function of the

Weibull family with a slope β=3.5, a lower asymptote γ=⅓ (chance of guessing correct), and a parameter

λ=0.01 to account for response errors due to momentary fluctuation of attention. This method shows

considerable overlap with more standard testing procedures (e.g. staircase), with QUEST displaying

slightly higher test-retest correlations, less variability between measurements, and reduced testing

duration. For each test, individuals were asked to smell a target and two non-target bottles (either under

the nose or through a straw) at a certain concentration (decided by the QUEST algorithm) and choose

which had the odor. A random order of bottle presentation within each triplet was given by the software

to be used by the administrator.

Odor Stimuli

Twelve odors, differentiated by pleasantness and edibility (see Table 1) were chosen on the basis of their

scores on the first (representing pleasantness) and the second (representing edibility) principal component

derived from the Dravnieks’ data set (Dravnieks, 1982). We selected odors that scored high or low on

these dimensions, in order to achieve a diverse stimulus set. Furthermore, odors were selected on the basis
of odor label frequencies1, as high-frequency odors are easier to name and thus would be better suited for

our study (Huisman and Majid, 2018). All odors were either from essential oils or ecologically sourced.

Prior to the study, orthonasal pilot testing (N = 10) was carried out to guide the construction of stimuli

with similar intensities and familiarities. Additionally, preliminary work was used to identify odorants

that represented both high and low pleasantness and high and low edibility. Exact odors and dilutions are

shown in the Supplementary (Table S1).

1
 Frequencies were estimated on the basis of natural texts from the Internet, found in the Maryland Baltimore
County WebBase corpus of English texts (Han et al., 2013).
Table 1. Odors for different quality categories used in study. Numbers in parentheses show word
frequencies in terms of number of occurrences per 100 000 words in the Maryland Baltimore County
WebBase corpus (Han et al., 2013).
Pleasantness
Pleasant Unpleasant
Edibility
Coconut (18.7) Fish (862.1)
Edible Pineapple (12.9) Garlic (29.4)
Strawberry (39.6) Yeast (59.3)
Lavender(12.7) Antiseptic (5.42)
Inedible Eucalyptus (9.5) Motor Oil (4.5)
Soap (92.3) Bleach (19.6)
Procedure
We used a counterbalanced design (across routes) involving two sessions, separated by at least a week.
Within each session, threshold evaluation was followed by an uncued odor identification procedure
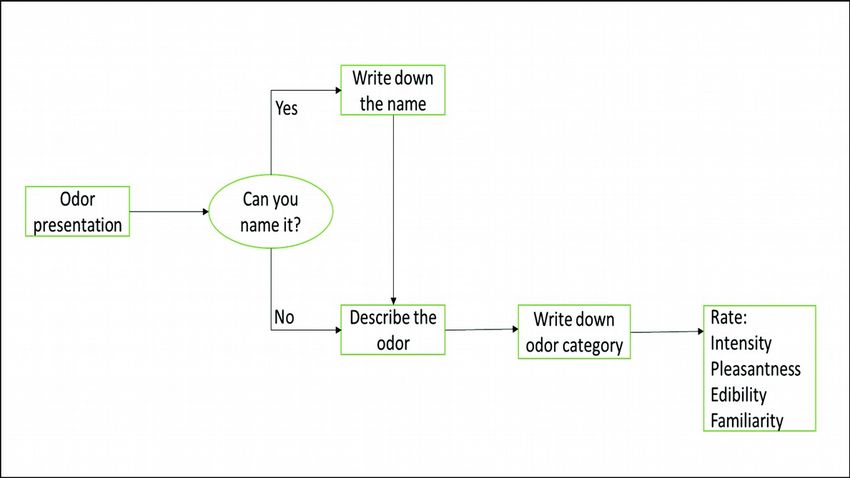
(Figure 2) and then the cued procedure of the same route. In the uncued odor identification procedure, an
odor was presented, and participants were asked to name it – the administrator wrote down the name and
a “yes” for any attempt. Next, individuals were asked to describe the odor in any terms (all were written
down) and then classify it into one category of their choice. Lastly, odor ratings for intensity,
pleasantness, familiarity and edibility were given using a visual analog scale (0 -150) with correspondinganchors (e.g. “Extremely Unpleasant” to “Extremely Pleasant”). Figure 2. Identification and description schema for uncued identification test (adapted from Jönsson et al., 2005). In the cued identification procedure, a word bank of 24 words was given at the time of presentation – 12 words were odorants in the procedure and the other 12 were foils. For the identification procedures, odors were presented in a randomized order. All tests were done in English at the University of Tennessee, and participants were tested in individual booths. Descriptor data pre-processing The descriptor data was pre-processed in Python. The data was initially converted into descriptor token- level format so that each individual descriptor mentioned constituted a data point that was matched with
the corresponding perceptual ratings. Descriptors where then manually edited so that spelling errors were

corrected, multi-word descriptors where shorted when possible (e.g. changing "almost rancid" into

"rancid"), and low-frequency forms were standardized into high-frequency forms with the same meaning

(e.g. changing "citrusy" into "citrus"). In order to further investigate differences in odor description and

semantic properties across routes descriptor tokens were assigned according to the following variables,

semantic category, imageability, concreteness, olfactory-semantic association and specificity, as well as

modality associations, as described below.

Semantic category. Odor descriptions vary with respect to whether they are abstract (e.g. "pungent"),

capturing an inherent quality of the odor, source-based (e.g. "lemon"), referring to the source of the odor,

or evaluative (e.g. "bad"), giving a subjective evaluation of the odor. Descriptor tokens were manually

coded for semantic category, following the guidelines of Majid et al. (2018). These provide semantic

definitions of each category (source-based, evaluative, and abstract) and describe how to deal with cases

that potentially could be coded both as evaluative or abstract.

Imageability & Concreteness. The semantic category of descriptors is related to word imageability and

concreteness. Imageability concerns the ease with which a word evokes a mental image (Bird et al.,

2001), and, relatedly, concreteness to the extent to which a word denotes a perceptual entity (Brysbaert et

al., 2014). Descriptor tokens were also assigned imageability and concreteness ratings. For imageability,

we used the ratings data set of Bird et al. (2001). This data set consists of ratings on 7-point Likert scale

for 2,645 words from various word classes. Out of these, 91 corresponded to the descriptors used by our

participants, making up only 10.4% of the total number of descriptors used. For concreteness, we used the

ratings of Bryesbart et al. (2014). This data set is substantially larger, consisting of ratings of 37,058

words of different word classes, that were rated on 5-point Likert scale. Of these, 507 corresponded to our

descriptors, making up 58% of all of our descriptors.
Olfactory-semantic association and specificity. Olfactory-semantic properties of the descriptors were

further assessed using a method developed by Iatropoulos et al. (2018). They derived the olfactory

association index (OAI), measuring the degree to which a descriptor is semantically related to olfaction

(relative to non-olfactory meanings), and the olfactory specificity index (OSI), measuring the semantic

specificity of a descriptor, on the basis of the distribution of nouns and verbs in the University of

Maryland Baltimore County WebBase corpus of English texts (Han et al., 2013). OAI is the log2

probability that a given descriptor d occurs in an olfactory/gustatory-related context as opposed to a

context unrelated to olfaction / gustation, i.e.,

                                                              of d
                                                    OAI d =
                                                              tf d

where tfd is the total frequency of d and ofd is the frequency of d in olfactory/gustatory-related contexts.

OSI is the negative log2-probability that a given descriptor d occurs in an olfactory/gustatory-related

context,

                                                                 of d
                                            OSI d =−log 2
                                                               ∑       of d
                                                              ∀ d ∈D

where D is the set of all descriptors investigated. As such, OSI is an estimate of the information contained

in a descriptor about the olfactory or gustatory contexts. A high OSI indicates a high information content

in terms of the descriptor being used in a limited set of contexts, and a low OSI is indicative of low

information content in that the descriptor is used across a broad range of contexts. OAI and OSI values

were extracted for those descriptors that overlapped with the descriptors that were used by the participants

in our study. This resulted in the assignment of OAI and OSI values for roughly 51% of all of our

descriptors2. These were then compared across routes.

2
 Most of the descriptors for which OAI and OSI was not calculated were multi-word descriptors, e.g. "alcohol
rubbing wipe".
Modality associations. The descriptors used by participants also vary with respect to how strongly they are associated with the different sensory modalities. Descriptors were investigated with respect to their sensory associations based on the modality norms provided by Lynott et al. (2019). Lynott and colleagues had participants rate almost 40,000 words on a 5-point Likert scale with respect to the extent to which they associated each word with the visual, auditory, tactile, interoceptive, olfactory and gustatory sensory modality (Lynott et al., 2019). Olfactory and gustatory ratings for those nouns and adjectives were extracted and assigned to those which overlapped with the descriptors used in our study. This resulted in the assignment of ratings for about 58% of all of our descriptors which were then compared across routes. In addition to token-level analyses, the descriptor data was also analyzed at the descriptor type level, with each descriptor type constituting a data point with matched variables. In this data set, presentation route (orthonasal vs. retronasal), odor (e.g. pineapple), and odor category (e.g. high vs. low pleasantness) is coded as the proportion of times each descriptor was elicited by the stimulus at hand (e.g. the proportion of times a descriptor was elicited by a retronasally presented odor), and perceptual ratings are mean ratings of odors that elicited the descriptor. Statistical Analysis All data was analyzed with the statistical software R (R Core Team 2018). Alpha level was set to 0.05. Analyses of route differences in terms of threshold sensitivity, odor ratings, and odor identification are presented in the supplementary materials. All data and analysis code are available at: https://osf.io/umazj/. Odor descriptor properties The use of odor descriptors was analyzed with respect to differences and similarities in descriptor use across odor categories (i.e., edibility and pleasantness), presentation route and descriptor properties. The frequency distributions of descriptors across routes for all odor categories were calculated and compared with a χ2-test.
To investigate route differences with respect to the descriptor properties (semantic category,

olfactory-semantic association and specificity, modality associations, as well as concreteness and

imageability) additional models were run. Analyses of semantic category were done both on the

descriptor token level (i.e., each individual descriptor mention constituting a data point) using logistic

mixed effects modeling in lme4 (Bates et al., 2014), and on the type level (i.e., each descriptor type

constituting a data point), using logistic regression. Due to the low number of evaluative descriptors (see

Figure 8), we only conducted analyses of the use of source-based vs. non-source based (i.e., abstract and

evaluative) descriptors. These models thus predicted whether a descriptor token (token-level analysis) or

a descriptor type (type-level analysis) was source-based or not. Analyses of all other descriptor variables

(i.e., the dependent variables OAI, OSI, Olfactory association, Gustatory association, Visual association,

Interoceptive association, Imageability and Concreteness) were done on the type level only, using linear

regression. In all of these models, we were only interested in whether we would observe a main effect of

route. All models contained the predictors route, together with odor edibility, odor pleasantness, the odor

edibility × odor pleasantness interaction included as covariates. The token-level model also contained the

covariates session, and (standardized) trial number fixed effects covariates, together with random

intercepts for participants and odors.

Mediation with threshold and intensity

To explore if differences in perceived intensity is related to differences in odor threshold, and, further, to

what extent this effect is mediated by presentation route additional analysis was ran. To this end, linear

regression and linear mixed effects modeling was conducted on the subject-and the odor-level,

respectively, predicting intensity ratings. Both subject-level and odor-level analyses were conducted in

order to ensure robustness of results. In the former analyses, each data point constitutes by-subject mean

intensity ratings, differentiating between orthonasally and retronasally presented odors. Thus, for each

data point, there is one corresponding threshold measure. In the latter analyses, the data points instead

consist of the individual odor intensity ratings, with the corresponding thresholds being repeated across
odors. In the odor-level model, we also included covariates controlling for odor category (i.e., Edibility,

Pleasantness and their interaction), Session, and Trial Number, as well as random intercepts for

participants and odors, and a by-participants random slope for Trial number.

          Additional analyses were run to understand the observed route differences in descriptor use and

their dependence on threshold and intensity differences between routes. To this end, semantic type (i.e.,

frequency of use of source-based vs. non-source-based descriptors), concreteness and olfactory

association of the descriptors were investigated for their relations to perceived odor intensity, and odor

threshold, either independently of the effect of route, or when accounting for the route effect. Type-level

analyses were conducted, containing covariates for odor type (Pleasantness, Edibility and Pleasantness ×

Edibility). In order to further investigate significant relationships, we performed mediation analyses using

the method proposed by Hayes & Preacher (Hayes and Preacher, 2014).

Multiple factor analysis of descriptor data

Lastly, multiple factor analysis (MFA) of the single word descriptor data was performed (Husson et al.,

2017). This was used to explore the variability for descriptors both with respect to the odors per se,

qualitative aspects of the odors for which they were used (as indicated by the odor ratings), the odor

presentation route, and, finally, different aspects of the descriptor semantics (described above, i.e.,

semantic category, olfactory-semantic association and specificity, and imageability / concreteness).

Additionally, the relationships between these properties with respect to descriptor use was examined. To

this end, MFA was performed on our descriptor type data set. A more detailed description of this analysis

is found in the Supplementary Materials.

Results

Odor identification (cued and uncued) across routes
Orthonasally presented odors were more often correctly identified (uncued) than retronasally presented
odors (Figure 3; Supp. Table 3). There was also a main effect of pleasantness, showing unpleasant odors
to more frequently be identified than pleasant odors regardless of task. Further, the main effect of
edibility showed that high edibility odors were more easily identified than low edibility odors regardless
of task. There was also a main effect of task, showing that odor identification was easier in the cued than
in the uncued task (naming), as can be expected. For instance, for both routes, only 4 out of the 35
participants used the correct term “coconut” for the coconut odor in the uncued task. The term
“strawberry” for the strawberry odor was not even in the top terms used when presented retronasally
(table S4). Other significant interactions for odor identification can be found in the supplementary table
S3.
Cued Uncued
80%
70%
60%
% Correct
50% Route
40% Orthonasal
Retronasal
30%
20%
10%
0%
Low High Low High
Odor Pleasantness
Figure 3. Percentage correctly identified odors as a function of presentation route, odor pleasantness and
task, as predicted by the logistic mixed effects model. Error bars represent standard errors of predicted
effects, calculated on the basis of model simulations.
Descriptor properties as a function of stimulation route
On average, participants used 3.51 (CI: [3.11;3.91]) descriptors to describe each orthonasally presented
odor, and 3.66 (CI: [3.32; 4.00]) descriptors to describe each retronasally presented odor. The number ofdescriptors used within each odor category was evenly balanced across routes (χ 23 = 1.91, p = 0.59);
however, the different routes were associated with different descriptors and different perceptual quality
ratings (Supplementary Table 2). Therefore, we explored the properties of the descriptors used for each
presentation route and compared the results.
First, each descriptor was coded by its semantic category (i.e. source-based, abstract or
evaluative) and compared across presentation routes. Figure 4 shows the distribution of descriptors,
according to their semantic category and odor presentation route. Source-based descriptors were used
more frequently for orthonasally than for retronasally presented odors, and this notion was supported both
in the token-level (ß = 0.73, z = 4.06, p =descriptors, ß = 0.09, t86 = 1.35, p = 0.18 (Supplementary Table 6). Descriptors more frequently used for
orthonasally presented odors had marginally larger olfactory specificity index (OSI), ß = 0.05, t437 = 1.91,
p = 0.057, but did not differ with respect to olfactory association index (OAI) (ß = 0.00, t437 = 0.19, p
= .85). Further, orthonasally presented odors were more frequently described with descriptors with
stronger associations to the olfactory modality, ß = 0.07, t503 = 2.38, p = 0.018, but there was no
relationship between presentation route and the gustatory modality association of the descriptors, ß = -
0.00, t503 = -0.14, p = 0.890. There was also a tendency for descriptors that are more frequently used for
orthonasally odors to be more strongly associated with the visual modality (e.g. colorful), ß = 0.04, t502 =
1.78, p = 0.074 while retronasally presented odors were more frequently described with descriptors that
have a stronger interoceptive association (e.g. tingling), ß = -0.05, t501 = -2.06, p = 0.040. Descriptors high
in vision also tend to be concrete objects, and descriptors high in interception tend to be abstract feelings.
More specifically, there was a positive correlation between concreteness and vision (r = 0.43, t 504 = 10.63,
p < 0.0001) and a negative correlation between interception and concreteness (r = -0.49; t 504 = -12.77, p <
0.0001).
Thus, the results support the notion that, compared to retronasally presented odors, orthonasally
presented odors are described with more specific and concrete source-based descriptors that are more
strongly associated with both olfaction and vision. Retronasally presented odors, on the other hand, are
described with descriptors that are more abstract, and more strongly related to interception.
Influence of intensity and sensitivity on descriptor usage
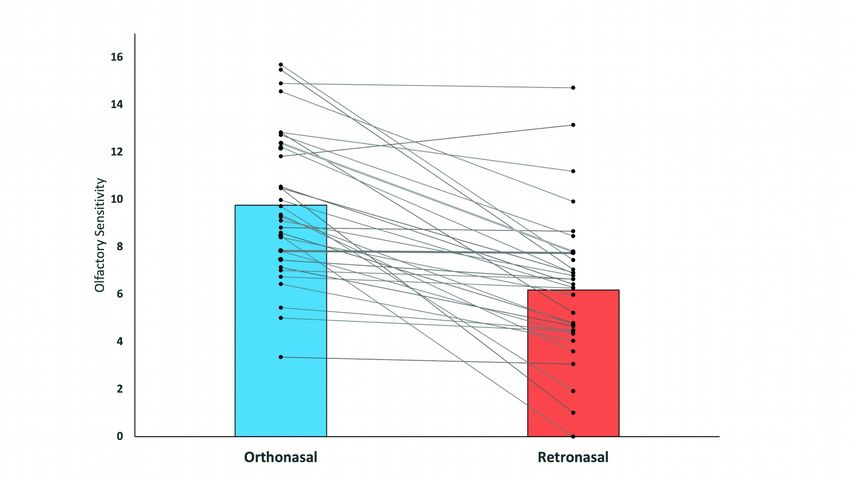
Our analyses of route-dependent sensitivity thresholds and intensity ratings showed that retronasal
presentation resulted, as expected, in reduced odor sensitivity (Figure 5; t 35 = 7.42, p < 0.001) and
intensity (ß = -4.21, t790.31 = -10.99, p < .0001). Sensitivity scores for the two routes were positively
correlated within individuals (r = .54, p < 0.001).Figure 5. Smell-S threshold scores for the two odor routes. Individual participants are represented as dots
that are connected by grey lines to indicate individual-level performance difference in the two conditions.
We then investigated whether sensitivity and intensity could explain the route effects on odor language
usage. The evidence for route-dependent effects on the central processing of odors would be strengthened
if sensitivity/intensity could not explain the effect on descriptor properties (e.g. semantic type,
concreteness and olfactory association).
First, the relationships between presentation route, odor sensitivity, and perceived intensity were
investigated using linear regression, linear mixed effects modeling and mediation analysis (Preacher &
Hayes 2004). The analyses showed that intensity ratings were higher for individuals with higher odor
sensitivity, according to subject-level (ß=0.9, t 70 = 2.45, p = .017) and odor-level (ß=1.12, t 112.31 = 6.78, p <
.0001) analyses.
Presentation route explained the relationship between threshold and intensity, and therefore, their
independent relationships with descriptor properties and route differences were further explored.
Mediation analyses (Figure 6) found no evidence for intensity or sensitivity mediation of the route effect
on semantic type. In fact, the influence of route on concreteness (ß = 0.10) and olfactory association (ß =
0.10) was stronger than the total mediation effect from intensity (both ß = 0.07), resulting in a negativeindirect, or suppression-like effect for intensity on their relationship (ß = -0.2). This means that when taking sensitivity into account, the route-dependent effect became even stronger.
Figure 6. Results from mixed-effects and mediation models for route and sensitivity/intensity dependencies. Each panel shows that
sensitivity/intensity either has no mediation effect or suppresses the relationship between presentation route and semantic properties: Panel A:
Semantic type (no mediation), Panel B: Concreteness (suppressed by Intensity) and Panel C: Olfactory Association (suppressed by Intensity).
In sum, although the difference in odor sensitivity between presentation routes influences the

perceived intensity of the odors, there is no evidence for the notion that this effect is also responsible for

the observed route differences in descriptor use. On the contrary, taking intensity into account further

strengthens the route effect on descriptor concreteness and olfactory association: Whereas orthonasally

presented odors are more frequently described using concrete descriptors (which are more strongly

associated with olfaction), high-intense odors tend to be described with descriptors that are less concrete

and less strongly associated with olfaction.

Multiple factor analysis of descriptor data

Having established that retronasal olfaction rely less on source-based description and that this was not

explained by route-differences in sensitivity or intensity, the descriptors were explored both with respect

to the odor IDs, qualitative aspects of the odors for which they were used (as indicated by the odor

ratings), the odor presentation route, and, finally, different aspects of the descriptor semantics (described

above,     i.e.,   semantic     category,      olfactory-semantic    association    and     specificity,    and

imageability/concreteness). The analysis was restricted to the initial 4 principal components (PCs), each

of which explain more than 7% of the variance in the data, and whose eigenvalues are well above 1

(Factor 4: 1.42). For subsequent factors, the amount of variance explained levels out at around 5% (see

Supplementary Figure S6), and the eigenvalues drop to one and below.

         We found that 4 principal components explained a significant portion of the variance in

descriptor use. PC1 (13.29%) and PC2 (11.02%) were primarily related to the specific odors and odor

categories, indicating that these components primarily are concerned with qualitative aspects of the odors.

More specifically, PC1 seems to correspond to the pleasantness of odors deemed edible, while PC2 seems

to cover a pleasantness dimension for odors deemed inedible (Figure 7a and 7b). For instance, PC1

descriptors such as peach, fruit and strawberry scored high on PC1, and descriptors such as murky,

spoiled, and rough score low while descriptors such as cream, cedar and rose scored high, and foul, stale

and funky scored low for PC2.
A 3.0 B 3.0
1.5 1.5
Component 2 (11.02%)
Component 2 (11.02%)
0.0 0.0
-1.5 -1.5
-3.0 -3.0
-3.0 -1.5 0.0 1.5 3.0 -3.0 -1.5 0.0 1.5 3.0
Component 1 (13.29%) Component 1 (13.29%)
Pleasantness Edibility
-1.50 -0.75 0.00 0.75 1.50 -1.50 -0.75 0.00 0.75 1.50
C D
3.0 3.0
1.5 1.5
Component 4 (7.20%)
Component 4 (7.20%)
0.0 0.0
-1.5 -1.5
-3.0 -3.0
-4 -2 0 2 -4 -2 0 2
Component 3 (8.55%) Component 3 (8.55%)
Type Source Abstract Evaluative Concreteness
-2 -1 0 1
E F
3.0 3.0
1.5 1.5
Component 4 (7.20%)
Component 4 (7.20%)
0.0 0.0
-1.5 -1.5
-3.0 -3.0
-4 -2 0 2 -4 -2 0 2
Component 3 (8.55%) Component 3 (8.55%)
Intensity Route
-3.0 -1.5 0.0 1.5 -3.0 -1.5 0.0 1.5
Figure 7. A and B) Descriptor positions on principal component 1 and principal component 2, and their
standardized mean ratings in terms of Edibility (Panel A) and Pleasantness (Panel B). C, D, E and F)
Descriptor positions on principal component 3 and principal component 4, and their standardized mean
concreteness ratings (Panel C), their semantic type (i.e., Source-based, abstract or evaluative; Panel D). E
and F), their standardized intensity mean ratings (Panel E) and their standardized percentage of times
they were used to describe a retronasally presented odor (Panel F).PC3 (8.55%) was primarily related to semantic properties of the descriptors, such as semantic
category (i.e., source-based, abstract, or evaluative) and imageability (Supplementary Figure S7) and
concreteness (Figure 7c and 7d). Importantly, PC3 was negatively correlated with imageability and
concreteness, and therefore may correspond to an abstractness dimension. Whereas abstract descriptors
such as pleasant, offensive and yummy scored high on PC3, concrete descriptors like cow, toast and fish
have a lower score. PC4 (7.20%), finally, was most strongly related to presentation route, to specific
odors, as well as to odor ratings. In particular, PC4 was negatively correlated with retronasal presentation,
but positively correlated with familiarity and intensity (Figure 7e and 7f). The complete MFA results are
shown in Supplementary Table 7 along with other descriptor properties (Supplementary Figure S5).
Discussion
Retronasal olfaction is common in everyday olfactory experience, but it is poorly understood. In our
study, we capitalized on novel semantic analysis methods to assess the impact that odor presentation
routes may have on perceptual and semantic processing. Confirming earlier reports, our participants were,
on average, less sensitive (Heilmann and Hummel, 2004; Bojanowski and Hummel, 2012; Hummel et al.,
2017) and less able to identify (Pierce and Halpern, 1996; Hannum et al., 2018) retronasally presented
odors. A novel result was that odors presented retronasally were more frequently described with abstract
terms that were less specific to olfaction. This result extends observations in wine and coffee experts, who
use more source-based language when sniffing, versus drinking, their respective beverages of expertise
(Croijmans and Majid, 2016). Importantly, the dimensions underlying the variability in descriptor use was
not explained by peripheral mechanisms such as sensitivity and intensity.
Individuals were less sensitive to retronasal odors which were in turn perceived as less intense
and familiar, especially for odors with high edibility. The nasopharynx receives a relatively high odor
concentration that is severely reduced at the olfactory cleft (Frasnelli et al., 2005), and in turn, a lower
concentration than orthonasal presentation (Buettner et al., 2008). The sorption of the odorant may affect
route-dependent differences in odor perception (Frasnelli et al., 2005; Scott et al., 2014) however recentfindings suggest sorption is less important than previously thought (Coppola et al., 2017, 2019).
Importantly, the results of our mediation analyses indicate that the decreased sensitivity and intensity are
not a contributor to the differences in descriptor use seen across the routes. Therefore, our route-
dependent differences may likely be due to two separate, but not independent explanations. Firstly,
activation patterns in the olfactory epithelium are slightly different across routes which might cause odor-
perceptual differences (Mozell, 1964; Zhao et al., 2004; Scott et al., 2007; Gautam and Verhagen, 2012,
2012; Furudono et al., 2013; Sanganahalli et al., 2020). Secondly, cognitive odor processing may depend
on the route of presentation (Small et al., 2005; Blankenship et al., 2019) and this might be due to “top-
down” effects related to expectation and context.
Orthonasal odors were found to be more easily identified, and described with more source-based
descriptors, compared to retronasally presented odors. These findings could be explained by differential
activations and processing at key olfactory processing centers. Orthonasal and retronasal odor stimulation
leads to similar activation maps in the olfactory bulb (OB) as well as similar perceived qualities for a
given odor (Gautam and Verhagen, 2012; Furudono et al., 2013; Sanganahalli et al., 2020). However,
there are route-specific activations across the glomerular sheet of the OB, with dorsal-medial regions
responding to orthonasal presentation and caudal and lateral regions responding to retronasal presentation
(Sanganahalli et al., 2020). Moreover, overall OB responses to odorants presented retronasally are lower
and slower than orthonasal presentation (Scott et al., 2007; Gautam and Verhagen, 2012; Furudono et al.,
2013). Temporal coding is known to be important in the signaling from the OB to piriform cortex (Chong
et al., 2020). Moving upstream, primary olfactory regions, such as the posterior piriform cortex, show
similar activation patterns for similar odor qualities (e.g. lemon-like) (Gottfried et al., 2006), but neural
comparison made between routes show that differences are more likely to appear in secondary olfactory
regions (Small et al., 2005). High and low sorption odor comparisons between routes showed no neural
difference while non-food and food odors showed activation differences in two secondary olfactory
cortex regions, the insula and orbitofrontal cortex. A change, and dependence, of insula activation for
odor delivery routes have also been observed in mice models (Blankenship et al., 2019). Additionally, thebase of the central sulcus, a region responsive to oral cavity somatosensory stimulation in human (Pardo
et al., 1997), was larger for retronasal presentation than orthonasal (collapsing analysis across four odors)
(Small et al., 2005). Indeed, odors presented retronasally in our study showed more interoceptive
language while orthonasally presented odors were visual or source-based in language. This increased
association with interoceptive language is most directly interpreted as an extension of oral referral, where
humans mislocalize retronasal odor as emanating from inside the oral cavity (Rozin, 1982; Lim and
Johnson, 2011). Oral referral is thought to be modulated by the link between oral sensations (e.g. texture
and taste) and retronasal aroma (Todrank and Bartoshuk, 1991; Stevenson et al., 2011). This belief is
based on the eating experience, where foods and beverages that elicit retronasal aromas also have
physiochemical properties that stimulate gustatory and somatosensory receptors in the oral cavity.
Unlike retronasally presented odors, orthonasally presented odors are typically presented with a
visual source (when actively sensed). This common multimodal pairing may skew orthonasally presented
odor language towards implicit source-based language. Conversely, retronasally presented odors originate
from the mouth and may not be so tightly linked to a visually prominent source, leading to abstract odor
language. Similarly, humans may have also developed an olfactory perception rooted in approach
behaviors in which orthonasal olfactory information is used to guide the visual search field. The use of
orthonasal olfaction in this manner might strengthen the relationship between visual objects and their
olfactory essence. From studies looking at hunter-gatherer populations there is evidence that the external
sense of smell and vision are used at similar rates (Majid and Kruspe, 2018) and larger odor vocabulary
exists for this group (Majid and Burenhult, 2014) compared to English-speaking societies. Supporting the
biological relevance of smell, our data shows people were better at identifying and describing unpleasant
odors, especially for those presented orthonasally (or external). Thus, it may be that human olfaction has
strong roots in guiding approach and avoidance behaviors, especially when it comes to potential hazards.
Meanwhile, retronasal odors provides the pleasure of eating and are typically perceived with other
sensations (e.g. taste, texture) which together represent oral percepts such as flavor. The absence of a
sensation may lead to cognitive interference (Dalton et al., 2000; Small and Prescott, 2005; Green et al.,2012). As discussed, secondary olfactory structures responding to retronasal-presented odors have
dependency on other sensations (Blankenship et al., 2019), therefore the absence of this sensory
information would help to explain our findings of a subdued retronasal vocabulary, when humans have
demonstrated rich and associative vocabularies when it comes to wine and food flavor.
The main objective of this study was exploring route-dependent differences in olfactory language,
however from our data, several avenues for future research present themselves. Orthonasal odors were
described with more odor-specific, concrete and source-based descriptors. Drawing parallels to
differences between vision and olfaction, it is possible that odors perceived retronasally elicit less
resolved, or fewer features, than orthonasally perceived odors before the percept is linked onto a source
descriptor through designated olfactory-specific language centers. These less resolved percepts, with
fewer features could result in difficulty describing and identifying the odor. Future research should seek
to quantify the level of detailed features we perceive in odors perceived retronasally, compared to
orthonasally. These studies should try to understand the information added during multisensory
processing that typically accompanies retronasal olfaction.
Conclusion
While the orthonasal-retronasal distinction has been discussed for almost 30 years (Rozin, 1982), there
has been little evidence of qualitative perceptual or cognitive differences across the two routes. This
study, leveraging semantic analysis, highlights perceptual and cognitive differences between the routes.
Our behavioral findings are compatible with previous behavioral and neuroimaging work, indicating that
the two odor presentation routes engage perceptual and cognitive processes differently. Lastly, our
findings suggest that while orthonasal olfaction is tuned primarily to odor source identification and
analysis, retronasal olfaction serves an associative and synthetic role due to its involvement in
multisensory flavor integration.References Bates, D., Mächler, M., Bolker, B., and Walker, S. 2014. Fitting Linear Mixed-Effects Models using lme4. ArXiv:14065823 [Stat]. Bird, H., Franklin, S., and Howard, D. 2001. Age of acquisition and imageability ratings for a large set of words, including verbs and function words. Behav Res Methods Instrum Comput. 33:73–79. Blankenship, M.L., Grigorova, M., Katz, D.B., and Maier, J.X. 2019. Retronasal Odor Perception Requires Taste Cortex, but Orthonasal Does Not. Current Biology. 29:62-69.e3. Bojanowski, V., and Hummel, T. 2012. Retronasal perception of odors. Physiology & Behavior. 107:484–7. Brysbaert, M., Warriner, A.B., and Kuperman, V. 2014. Concreteness ratings for 40 thousand generally known English word lemmas. Behav Res Methods. 46:904–911. Buettner, A., Otto, S., Beer, A., Mestres, M., Schieberle, P., and Hummel, T. 2008. Dynamics of retronasal aroma perception during consumption: Cross-linking on-line breath analysis with medico- analytical tools to elucidate a complex process. Food Chemistry. 108:1234–1246. Chen, V., and Halpern, B.P. 2007. Retronasal but Not Oral-Cavity-Only Identification of “Purely Olfactory” Odorants. Chemical Senses. 33:107–118. Chong, E., Moroni, M., Wilson, C., Shoham, S., Panzeri, S., and Rinberg, D. 2020. Manipulating synthetic optogenetic odors reveals the coding logic of olfactory perception. Science. 368. Coppola, D.M., Fitzwater, E., Rygg, A.D., and Craven, B.A. 2019. Tests of the chromatographic theory of olfaction with highly soluble odors: a combined electro-olfactogram and computational fluid dynamics study in the mouse. Biology Open. 8. Coppola, D.M., Ritchie, B.E., and Craven, B.A. 2017. Tests of the sorption and olfactory “fovea” hypotheses in the mouse. J Neurophysiol. 118:2770–2788. Croijmans, I., and Majid, A. 2016. Not All Flavor Expertise Is Equal: The Language of Wine and Coffee Experts. PLOS ONE. 11:e0155845. Croy, I., Nordin, S., and Hummel, T. 2014. Olfactory Disorders and Quality of Life--An Updated Review. Chemical Senses. 39:185–194. Dalton, P., Doolittle, N., Nagata, H., and Breslin, P.A. 2000. The merging of the senses: integration of subthreshold taste and smell. Nat Neurosci. 3:431–432. Dravnieks, A. 1982. Odor quality: semantically generated multidimensional profiles are stable. Science. 218:799–801. Engen, T. 1987. Remembering odors and their names. American Scientist. 75:497–503. Engen, T. 1991. Odor sensation and memory. New York, NY, England: Praeger Publishers.
Frasnelli, J., Ruth, S. van, Kriukova, I., and Hummel, T. 2005. Intranasal Concentrations of Orally
Administered Flavors. Chemical Senses. 30:575–582.

Furudono, Y., Cruz, G., and Lowe, G. 2013. Glomerular input patterns in the mouse olfactory bulb
evoked by retronasal odor stimuli. BMC Neurosci. 14:45.

Gautam, S.H., Short, S.M., and Verhagen, J.V. 2014. Retronasal odor concentration coding in glomeruli
of the rat olfactory bulb. Frontiers in Integrative Neuroscience. 8:81.

Gautam, S.H., and Verhagen, J.V. 2012. Retronasal Odor Representations in the Dorsal Olfactory Bulb of
Rats. J Neurosci. 32:7949–7959.

Gottfried, J.A., Winston, J.S., and Dolan, R.J. 2006. Dissociable Codes of Odor Quality and Odorant
Structure in Human Piriform Cortex. Neuron. 49:467–479.

Green, B.G., Nachtigal, D., Hammond, S., and Lim, J. 2012. Enhancement of Retronasal Odors by Taste.
Chem Senses. 37:77–86.

Han, L., Kashyap, A.L., Finin, T., Mayfield, J., and Weese, J. 2013. UMBC_EBIQUITY-CORE:
Semantic Textual Similarity Systems. In: Atlanta, GA, USA: Association for Computational Linguistics.
pp. 44–52.

Hannum, M., Stegman, M.A., Fryer, J.A., and Simons, C.T. 2018. Different Olfactory Percepts Evoked
by Orthonasal and Retronasal Odorant Delivery. Chemical Senses. 43:515–521.

Hayes, A.F., and Preacher, K.J. 2014. Statistical mediation analysis with a multicategorical independent
variable. Br J Math Stat Psychol. 67:451–470.

Heilmann, S., and Hummel, T. 2004. A New Method for Comparing Orthonasal and Retronasal
Olfaction. Behavioral Neuroscience. 118:412–419.

Höchenberger, R., and Ohla, K. 2019. Estimation of Olfactory Sensitivity Using a Bayesian Adaptive
Method. Nutrients. 11:1278.

Hörberg, T., Larsson, M., and Olofsson, J.K. 2020. Mapping the semantic organization of the English
odor vocabulary using natural language data. psyarxiv.

Hsieh, J.W., Keller, A., Wong, M., Jiang, R.-S., and Vosshall, L.B. 2017. SMELL-S and SMELL-R:
Olfactory tests not influenced by odor-specific insensitivity or prior olfactory experience. Proceedings of
the National Academy of Sciences of the United States of America. 114:11275–11284.

Huisman, J.L.A., and Majid, A. 2018. Psycholinguistic variables matter in odor naming. Memory &
Cognition. 46:577–588.

Hummel, T., Seo, H.-S., Pellegrino, R., and Heilmann, S. 2017. Electro-Olfactograms in Humans in
Response to Ortho- and Retronasal Chemosensory Stimulation.

Husson, F., Le, S., Pagès, J., Le, S., and Pagès, J. 2017. Exploratory Multivariate Analysis by Example
Using R. Chapman and Hall/CRC.
Iatropoulos, G., Herman, P., Lansner, A., Karlgren, J., Larsson, M., and Olofsson, J.K. 2018. The
language of smell: Connecting linguistic and psychophysical properties of odor descriptors. Cognition.
178:37–49.

Jacobs, L.F. 2019. The navigational nose: a new hypothesis for the function of the human external
pyramid. Journal of Experimental Biology. 222.

Jönsson, F.U., Tchekhova, A., Lönner, P., and Olsson, M.J. 2005. A Metamemory Perspective on Odor
Naming and Identification. Chemical Senses. 30:353–365.

Keller, A., and Malaspina, D. 2013. Hidden consequences of olfactory dysfunction: A patient report
series. BMC Ear, Nose and Throat Disorders. 13:8.

Lim, J., and Johnson, M.B. 2011. Potential Mechanisms of Retronasal Odor Referral to the Mouth.
Chemical Senses. 36:283–289.

Lorig, T.S. 1999. On the similarity of odor and language perception. Neuroscience & Biobehavioral
Reviews. 23:391–398.

Lynott, D., Connell, L., Brysbaert, M., Brand, J., and Carney, J. 2019. The Lancaster Sensorimotor
Norms: multidimensional measures of perceptual and action strength for 40,000 English words. Behav
Res.

Majid, A. 2015. Cultural Factors Shape Olfactory Language. Trends in Cognitive Sciences. 19:629–630.

Majid, A. 2021. Human Olfaction at the Intersection of Language, Culture, and Biology. Trends in
Cognitive Sciences. 25:111–123.

Majid, A., and Burenhult, N. 2014. Odors are expressible in language, as long as you speak the right
language. Cognition. 130:266–270.

Majid, A., and Kruspe, N. 2018. Hunter-Gatherer Olfaction Is Special. Current Biology. 28:409-413.e2.

Majid, A., Roberts, S.G., Cilissen, L., Emmorey, K., Nicodemus, B., O’Grady, L., Woll, B., LeLan, B.,
Sousa, H. de, Cansler, B.L., et al. 2018. Differential coding of perception in the world’s languages.
PNAS. 115:11369–11376.

Mozell, M.M. 1964. Evidence for sorption as a mechanism of the olfactory analysis of vapours. Nature.
203:1181–1182.

Oleszkiewicz, A., Pellegrino, R., Pusch, K., Margot, C., and Hummel, T. 2017. Chemical complexity of
odors increases reliability of olfactory threshold testing. Sci Rep. 7.

Olofsson, J.K., and Gottfried, J.A. 2015a. Response to Majid: Neurocognitive and Cultural Approaches to
Odor Naming are Complementary. Trends Cogn Sci (Regul Ed). 19:630–631.

Olofsson, J.K., and Gottfried, J.A. 2015b. The muted sense: neurocognitive limitations of olfactory
language. Trends in Cognitive Sciences. 19:314–321.

Olofsson, J.K., Rogalski, E., Harrison, T., Mesulam, M.-M., and Gottfried, J.A. 2013. A cortical pathway
to olfactory naming: evidence from primary progressive aphasia. Brain. 136:1245–1259.
Olofsson, J.K., and Wilson, D.A. 2018. Human Olfaction: It Takes Two Villages. Current Biology.
28:R108–R110.

Pardo, J.V., Wood, T.D., Costello, P.A., Pardo, P.J., and Lee, J.T. 1997. PET study of the localization and
laterality of lingual somatosensory processing in humans. Neuroscience Letters. 234:23–26.

Pierce, J., and Halpern, B.P. 1996. Orthonasal and Retronasal Odorant Identification Based upon Vapor
Phase Input from Common Substances. Chem Senses. 21:529–543.

Rozin, P. 1982. “Taste–smell confusions” and the duality of the olfactory sense. Perception &
Psychophysics. 31:397–401.

Sanganahalli, B.G., Baker, K.L., Thompson, G.J., Herman, P., Shepherd, G.M., Verhagen, J.V., and
Hyder, F. 2020. Orthonasal versus retronasal glomerular activity in rat olfactory bulb by fMRI.
NeuroImage. 212:116664.

Scott, J.W., Acevedo, H.P., Sherrill, L., and Phan, M. 2007. Responses of the rat olfactory epithelium to
retronasal air flow. Journal of Neurophysiology. 97:1941–50.

Scott, J.W., Sherrill, L., Jiang, J., and Zhao, K. 2014. Tuning to Odor Solubility and Sorption Pattern in
Olfactory Epithelial Responses. The Journal of Neuroscience. 34:2025–2036.

Small, D.M., Gerber, J.C., Mak, Y.E., and Hummel, T. 2005. Differential neural responses evoked by
orthonasal versus retronasal odorant perception in humans. Neuron. 47:593–605.

Small, D.M., and Prescott, J. 2005. Odor/taste integration and the perception of flavor. Exp Brain Res.
166:345–357.

Stevenson, R.J., Oaten, M.J., and Mahmut, M.K. 2011. The role of taste and oral somatosensation in
olfactory localization. Quarterly Journal of Experimental Psychology. 64:224–240.

Todrank, J., and Bartoshuk, L.M. 1991. A taste illusion: Taste sensation localized by touch. Physiology &
Behavior. 50:1027–1031.

Yoshino, A., Pellegrino, R., Luckett, C.R., and Hummel, T. 2021. Validation Study of a Novel Approach
for Assessment of Retronasal Olfactory Function with Combination of Odor Thresholds and
Identification. European Archives of Oto-Rhino-Laryngology.

Zhao, K., Scherer, P.W., Hajiloo, S.A., and Dalton, P. 2004. Effect of Anatomy on Human Nasal Air
Flow and Odorant Transport Patterns: Implications for Olfaction. Chemical Senses. 29:365–379.
You can also read