REWARDS FOR PATENTS AND INVENTOR BEHAVIORS IN INDUSTRIAL RESEARCH AND DEVELOPMENT
←
→
Page content transcription
If your browser does not render page correctly, please read the page content below
r Academy of Management Journal
2018, Vol. 61, No. 1, 264–292.
https://doi.org/10.5465/amj.2015.0633

                  REWARDS FOR PATENTS AND INVENTOR BEHAVIORS IN
                      INDUSTRIAL RESEARCH AND DEVELOPMENT
                                                                    MARCO S. GIARRATANA
                                                                        IE University

                                                                          MYRIAM MARIANI
                                                                          Bocconi University

                                                                              INGO WELLER
                                                                               LMU Munich

                          This study investigates the effects of rewards in a research and development (R&D)
                          setting in which employees’ inventive efforts lead to patented inventions. Pay for per-
                          formance (PFP) for inventions is associated with two challenges: Low-quality inventions
                          may be rewarded (false positives), and high-quality inventions may be overlooked (false
                          negatives). Building on previous findings regarding the motivational and informational
                          effects of rewards, we use social identity theory to predict that different types of in-
                          ventors react differently to such false positive and false negative information. Specifi-
                          cally, we hypothesize that PFP that produces false positives has detrimental effects on
                          corporate inventors with a taste for science, who are motivated by scientific prestige,
                          reputation, and intellectual curiosity. The empirical results from survey data related to
                          3,995 inventor–patent pairs show that, for this particular group of inventors, false
                          positives are associated with reduced effort in research activities and fewer interactions
                          with peers in the R&D department. In addition, these effects are stronger when firms
                          have many patents and thus provide less noisy information to corporate inventors.

  Pay for performance (PFP) is a prevalent human                                                  organizational success (Gerhart et al., 2009), yet it
resource management (HRM) practice (Rynes,                                                        remains a complex topic, marked by disagreement
Gerhart, & Parks, 2005), spreading across diverse                                                 about the contexts in which PFP is most effective, for
sectors, including those that traditionally have pre-                                             whom, and in what conditions (Larkin, Pierce, &
ferred fixed compensation, such as education,                                                     Gino, 2012; Nyberg, Pieper, & Trevor, 2016).
health, and innovation (CEB, 2006; Gerhart, Rynes, &                                                 One critical finding indicates that PFP is most
Fulmer, 2009). Empirical evidence suggests that                                                   effective when pay is closely tied to performance
PFP enhances individual-level performance and                                                     (Trevor, Reilly, & Gerhart, 2012). However, even if
                                                                                                  firms intend to tie pay to performance, they may not
   We are grateful to Associate Editor Linus Dahlander and                                        be able to do so. For example, performance cannot
three anonymous reviewers for their feedback and sugges-                                          always be observed or measured objectively, and
tions during the review process. We thank seminar partici-                                        subjective performance measures also have draw-
pants at Bocconi University, Boston University, Groningen                                         backs, such as the threat of rater biases (Kampkötter
University, IE Business School, Imperial College, LMU                                             & Sliwka, 2016; Rynes et al., 2005). Furthermore,
Munich, Skema Business School, the University of Ljubljana,                                       firms might strategically prefer to decouple pay from
the University of Mannheim, the 2015 Open Innovation                                              performance, such as when they run contests with
Workshop Gothenburg, 2016 TIM-AOM Research Workshop-                                              fewer prizes compared to competitors (e.g., Bothner,
Boston College, and the 2014 Academy of Management
                                                                                                  Podolny, & Smith, 2011; Boudreau, Lacetera, &
Conference. We would also like to thank Chiara Spina for
                                                                                                  Lakhani, 2011; Lazear & Rosen, 1981) or use exces-
her contribution in managing the recall-bias survey and
the interviews. Myriam Mariani thanks the European                                                sive rewards to stimulate risky behaviors (Baumann
Commission [Contract FP7-SSH-2007-1- grant agreement                                              & Stieglitz, 2014; Ederer & Manso, 2013; Scherer &
No. 217299] for supporting creation of the dataset, and the                                       Harhoff, 2000).
Italian Ministry of Education, University and Research                                               When pay and performance are not in sync, two
[Project CUP B41J12000160008]. All errors are ours.                                               types of false rewards occur: Low-performance
                                                                                         264
Copyright of the Academy of Management, all rights reserved. Contents may not be copied, emailed, posted to a listserv, or otherwise transmitted without the copyright holder’s express
written permission. Users may print, download, or email articles for individual use only.
2018 Giarratana, Mariani, and Weller 265
contributions may be rewarded, and high-performance (R&D) and the extent to which they interact with R&D
contributions may be overlooked. The first issue peers. We also find that these results are stronger in
represents “false positive” rewards; the second in- firms with many patents that provide corporate in-
dicates “false negative” rewards.1 Substantial liter- ventors with more precise information about the
ature has described the nature of performance company reward system. False negatives, instead, do
appraisals and the use and effects of PFP, but the not show any significant association with these in-
implications of the dual nature of false rewards ventors’ behaviors.
are not well understood. Some theories in related As its main contribution, our work extends the
fields, like the economics of law and crime, have informational perspective of PFP (Gerhart et al.,
investigated the differential deterrence effects 2009; Lazear, 2000; Shaw, 2015) by accounting for
of judicial systems that commit Type I errors the dual nature of false rewards. Specifically, we
(i.e., convicting innocent people) or Type II errors amend traditional (agency) perspectives with social
(i.e., failing to convict those who are guilty) (Rizzolli identity arguments (Ashforth & Mael, 1989; Tajfel &
& Stanca, 2012). Gamba and Stanca (2016) modeled Turner, 1986). Whereas agency theory predicts
a bidding contest and varied inclusion and exclu- equally negative effects of both types of false re-
sion errors; Marchegiani, Reggiani, and Rizzolli wards (Gamba & Stanca, 2016; Marchegiani et al.,
(2016) analyzed whether failing to reward a de- 2016), we anticipate that false positives are tangible
serving agent is more detrimental than rewarding an artifacts and symbols that conflict with collective,
undeserving agent. behaviorally relevant belief systems and norms.
We apply these notions to innovation contexts by Furthermore, we add to growing literature on the
exploiting field data related to innovation and pat- “interplay between a firm’s motivational system
enting. We analyze how PFP for patents creates false and its employees’ mix of motives” (Bridoux,
positives and false negatives, and how these false Coeurderoy, & Durand, 2011: 712). The match (or
rewards differ in their impact on employee behav- mismatch) between individual preferences and pay
iors. Using social identity theory (Ashforth & Mael, attributes can produce relevant and differential
1989; Tajfel & Turner, 1986), we develop predictions effects of PFP strategies, leading to a significant
about the different information provided by false source of interfirm heterogeneity (Chng, Rodgers,
positives and false negatives. False positives collide Shih, & Song, 2012; Larkin et al., 2012; Wowak &
with the beliefs and norms of corporate scientists— Hambrick, 2010). We introduce individual-level
that is, inventors who work for for-profit firms but heterogeneity as a social identity- or group-based
who embrace a traditional view in which scientists phenomenon. Employees identify with social groups
are driven by a desire to resolve challenges and gain (“invisible colleges” [Gustin, 1973]) within their
recognition from their peer community (Gustin, firms and develop shared norms and beliefs (Tajfel &
1973; Merton, 1973; Roach & Sauermann, 2010; Turner, 1986), which interact positively or negatively
Stern, 2004). These corporate scientists identify with with the firm’s policies and practices, such as pay
the scientific “guild” and its beliefs, rules, and systems.
norms, which include winner-take-all reward struc-
tures (Mudambi & Swift, 2009; Stephan, 1996).
Therefore, corporate scientists should react nega- THEORY DEVELOPMENT
tively to PFP that produces many false positives,
Background Literature
because this system threatens their belief and value
structures, as well as their social identity as scien- This research relates to several different strands of
tists. In line with this contention, we observe that literature, including PFP and performance appraisal,
false positives lead corporate scientists to reduce the contest, and innovation research. These broad re-
effort they devote to research and development search fields embrace multiple disciplines (e.g.,
management, innovation, economics, psychology),
1 but our review focuses on those studies that relate
These two issues also have been termed inclusion/
most consistently and closely to our research question
exclusion errors (Gamba & Stanca, 2016) or Type I/Type II
errors (Marchegiani, Reggiani, & Rizzolli, 2016), with some and setting. That is, we focus on prior work that aims
distinct definitions (Markussen, Putterman, & Tyran, to explain how false rewards arise and that links false
2014). We use the terms “false positives” and “false nega- rewards to individual-level behaviors. Moreover, be-
tives” to highlight that pay and performance are not in cause we explore individual-level behaviors rather
sync, while avoiding overstressing the error connotation. than collective outcomes (e.g., social welfare [Bothner266 Academy of Management Journal February et al., 2011]), we concentrate on studies that deal are broader, such that multitasking trade-offs almost with individual-level factors and explanations. inevitably arise (Lawler, 1971; Manthei & Sliwka, PFP and performance appraisal literature. A 2013; Rynes et al., 2005). lively debate about the effectiveness of PFP for Problems and biases in performance appraisals achieving desired employee behaviors spans both lead to false rewards and weaken the incentive effect academic research (Nyberg et al., 2016) and the of PFP tied to these appraisals. Extant contributions popular press (e.g., Pink, 2009). Even PFP advocates have argued that both false positives and false neg- conclude that when it “works, it seems capable of atives “should be equally detrimental to the agent’s producing spectacularly good results and when it effort provision” (Marchegiani et al., 2016: 184), be- does not work, it can likewise produce spectacularly cause for risk-neutral agents “exclusion and in- bad results” (Gerhart et al., 2009: 253). An in- clusion [errors] have the same negative impact on formative theme in PFP research relates to pay dis- effort, as they reduce its marginal return by the same persion (Shaw, 2014, 2015; Trevor et al., 2012). This amount” (Gamba & Stanca, 2016: 2). line of research notes that dispersion in explained Strategic HRM, contest design, and innovation pay, or the proportion of an employee’s pay that “is literature. Strategic HRM literature has recognized tied to productivity-relevant employee inputs” that PFP is a crucial driver of firm performance and (Trevor et al., 2012: 586), predicts performance better integral to high-performance work systems (Huselid, than does dispersion in unexplained pay, which 1995; Posthuma, Campion, Masimova, & Campion, stems from other sources, such as seniority-based 2013). Two types of PFP systems generate false re- recognition, “politics, discrimination, favoritism, wards: nontrivial contests that generate false nega- [or] random decisions” (Trevor et al., 2012: 586). tives, and excessive reward strategies that produce These latter processes, which are unrelated to em- false positives. First, nontrivial contests create a com- ployees’ performance, subvert expectations of pro- petitive situation with fewer rewards than competitors; cedural justice (Lind & Tyler, 1988; Thibaut & at the extreme, “winner-take-all markets translate Walker, 1975) and result in inequitable input– small differences in performance into large differ- output relations, thus violating distributional fair- ences in reward” (Frank & Cook, 1996: 29). Such ness rules (Adams, 1963; Trevor et al., 2012). selective rewards can have more positive perfor- According to equity theory (Adams, 1963), people mance effects compared to broadly distributed re- who receive inequitable treatment vary or cogni- wards (Bradler, Dur, Neckermann, & Non, 2016). tively adjust their inputs or outputs, manipulate Second, some firms allocate rewards to low- others’ inputs or outputs, withdraw, or change their performance outcomes (i.e., false positives), as in reference group. In addition, relative underpayment the case of “golden parachutes” that help establish (which is correlated with the risk of false negatives) more tolerance for failure and encourage a risk- and relative overpayment (which is correlated with taking culture (Ederer & Manso, 2013). Rewarding the risk of false positives) result in different re- more outcomes than a few, highly ranked ones is actions. Research has indicated that equity pre- common in creative and innovative contexts, in dictions are better supported in the context of which the performance distribution is skewed underpayment than overpayment (Pritchard, 1969). (Fleming, 2007). This observation holds for patented The concepts of explained and unexplained pay inventions, whose value distribution is typically log- also relate to performance appraisal literature (Landy normal with a stretched right tail (Giuri et al., 2007; & Farr, 1983; Murphy & Cleveland, 1995; Rynes et al., Hall, Jaffe, & Trajtenberg, 2005; Scherer & Harhoff, 2005). Performance appraisals may be subjective or 2000; Silverberg & Verspagen, 2007; Trajtenberg, based on objective output measures. With subjective 1990). That is, the top 10% of patents often account appraisals, raters often exhibit severity, leniency, or for more than 80% of the market value of all patents centrality biases (Landy & Farr, 1983; Marchegiani (Scherer, Harhoff, & Kukies, 2000). et al., 2016; Murphy & Cleveland, 1995), and ratings Inventing may also be related to false negatives. tend to be unreliable (Viswesvaran, Ones, & Schmidt, Innovation, from “the germ of an idea to its impact on 1996). Objective measures, such as productivity or society” (Garud, Tuertscher, & Van de Ven, 2013: 776), sales volume (Rynes et al., 2005), can remedy such confronts manifold technological and market risks concerns but are seldom available, or they might be (Christensen, 1997; Giarratana & Mariani, 2014). In- available only at aggregate, instead of individual, ventions are often poorly defined at the outset, and levels. Moreover, objective measures tend to be nar- their success or failure manifests long after their row in scope, whereas desired employee behaviors generation and entry into the market (Gambardella,
2018                                          Giarratana, Mariani, and Weller                                          267

Giarratana, & Panico, 2010). For example, 90% of all              in multiple projects with varying team compositions,
pharmaceutical R&D investments go to drugs that ul-               so they can gain insights into multiple contributions,
timately fail (The Economist, 2014). Thus, creative               which should improve their potential to understand
forecasting (i.e., predicting the outcomes of new ideas           and assess the invention process and its outcomes.
[Berg, 2016]) is per se uncertain and can result in both          Predictive abilities may also benefit from path-
false positives and false negatives.                              dependent projects or from consistency, such that
                                                                  star researchers consistently produce high-quality
                                                                  inventions (Call, Nyberg, & Thatcher, 2015).
Innovation, Patenting, and False Rewards
                                                                     Although the expected value of an invention is the
   Firms employ a broad set of rewards to honor                   most important PFP criterion, firms’ reward strategies
innovative efforts. In addition to salaries, which are            may respond to other rationales as well. For example,
the largest, most often used pay component for in-                managers may be tempted to use politics and power
ventors, firms offer incentives, including bonuses for            (Pfeffer, 1992). Due to resource constraints that limit
patents, royalty compensation plans (CEB, 2006;                   the number of proposed projects that can be imple-
Malanowski, 2007), increased autonomy that allows                 mented (Foss, 2003), firms might attempt to limit
employees to organize their time and research ac-                 bonus payments, worried that too many incentives
tivities, the option to publish research results, or re-          will produce excess ideas that cannot be funded
search grants (Gustin, 1973; Stern, 2004). In general,            (Baumann & Stieglitz, 2014). Other companies might
PFP for patents is widespread, with more than three-              reward a vast number of patents in an effort to stim-
quarters of U.S. firms using it (CEB, 2006). The ex-              ulate risky behaviors, establish tolerance for failure
tent to which firms use PFP for patents differs across            (Ederer & Manso, 2013), or build large patent port-
countries and institutional settings, as well as among            folios that can deter competitors (Ziedonis, 2004).
firms in the same country (Harhoff & Hoisl, 2007).                   Overall, then, PFP for patents comprises two com-
   When rewarding inventors, firms primarily seek                 ponents, and the weight attached to each component
to calibrate the rewards according to the likely value            varies across time and firms. The first component
of the invention (Harhoff & Hoisl, 2007). This logic,             reflects a value-based logic, such that firms engage
which we refer to as “value-based PFP,” is similar to             in creative forecasting and try to reward the most
explained pay (Shaw, 2014; Trevor et al., 2012).                  promising inventions. The second component is
Value-based PFP starts with creative forecasting                  based on reasons unrelated to performance. To illus-
(Berg, 2016): Building on their past experience, an-              trate the functioning of PFP in such a setting, con-
alyst evaluations, and industry benchmarks, firms                 sider a simple simulation. Assume a population of
gather knowledge to predict the expected value of                 patents, in which the proportions of high-quality
their inventions. However, given the uncertainty of               (15%) and low-quality (85%) patents are fixed. These
the invention process, they naturally struggle with               proportions are realistic (Scherer et al., 2000; The
predictions about the potential of any invention to               Economist, 2014). Next, imagine four reward regimes:
fall into the right tail of the value distribution.
                                                                  (1) random selection, such that firms are unable to
   As both a challenge and an opportunity, the in-
                                                                      predict the future value of the inventions and
vention process has multiple steps, carried out by
                                                                      draw from a uniform distribution,
different actors, so roles and responsibilities are di-
                                                                  (2) perfect selection, according to which firms have
vided: “creators are expected to generate novel and
                                                                      perfect knowledge about the future value of in-
useful ideas (variation), managers decide which of
                                                                      ventions and reward them accordingly,
these ideas to implement (selection), and the exter-
                                                                  (3) informed selection, such that high-quality pat-
nal audience determines the ultimate success of any
                                                                      ents have a higher probability of being rewarded
implemented ideas (retention)” (Berg, 2016: 435). On
                                                                      compared to low-quality patents (e.g., twice as
the one hand, split roles and responsibilities create
                                                                      likely), and
informational problems, opportunities for politics,
                                                                  (4) twofold selection, in which 50% of rewards are
and threats of favoritism, which make it more diffi-
                                                                      assigned to high-quality patents (perfect selec-
cult to anticipate the future value of an invention. On
                                                                      tion) and 50% of rewards go to all remaining patents.
the other hand, multiple actors are also multiple in-
formation sources; peers in particular are knowl-                   If we simulate these regimes with different pro-
edgeable informants (Berg, 2016; Bridoux et al.,                  portions of rewarded patents (see Appendix A), ran-
2011). Most inventions result from teamwork                       dom selection produces a linear process, and false
(Harhoff & Hoisl, 2007), and inventors often engage               positives and false negatives develop symmetrically
268 Academy of Management Journal February
but in opposite directions. With perfect selection, Nobel Prize” (see Arora, Belenzon, & Patacconi, 2015).
the percentage of false positives increases steeply We label the group of industrial inventors with a taste
after all high-quality patents have been rewarded. for science as “corporate scientists.”
Informed selection mixes these two outcomes, and The strong prestige of science as a field (Chalmers,
twofold selection creates an asymmetric process, in 1999; Stephan, 1996), together with the salient and
which further increases in reward breadth produce distinctive norms maintained by the “scientific
relatively larger increases in false positives than de- guild” (Mudambi & Swift, 2009), enable scientists to
creases in false negatives. The twofold selection form a strong collective identity that spans both
outcome fits our empirical data well: As we explain corporate and academic worlds. To frame and un-
subsequently, as the ratio of rewarded to unrewarded derstand this social group formation process, we turn
patents increases, false positives increase more to social identity theory (Ashforth & Mael, 1989;
strongly than false negatives decrease. Therefore, we Tajfel & Turner, 1986), which posits that people ex-
use this selection model as the starting point for de- hibit a fundamental need to maintain and improve
veloping theory about inventors’ reactions to false their self-concepts (Epstein, 1998). They therefore
rewards. sort themselves and others into social categories
(Tajfel, 1981) and units like “fathers,” “friends,”
“athletes,” “scientists,” or more generally “group
PFP, Individual Differences, and
members.” This social classification has two main
Social Identification
functions: cognitive segmentation, related to shared
As Wowak and Hambrick (2010: 804) explained, or group mental models (Cannon-Bowers, Salas, &
“pay cannot be studied in isolation;” rather, pay ef- Converse, 1993; Klimoski & Mohammed, 1994), and
fects likely vary with individual differences (Barrick, social identification, in the sense of “oneness with or
Mount, & Li, 2013; Bartling, Fehr, & Schmidt, 2012; belongingness to some human aggregate” (Ashforth
Bridoux et al., 2011; Chng et al., 2012; Larkin et al., & Mael, 1989: 21). Work settings and organizations
2012; Prasad, Enns, & Ferratt, 2007; Wowak & are important reference objects (Ashforth & Mael,
Hambrick, 2010). In general, researchers are a fairly 1989) because they provide multiple opportunities
heterogeneous group of knowledge workers (Roach for feedback, from both social (e.g., peers) and ad-
& Sauermann, 2010). Those with a “taste for science” ministrative (e.g., pay systems) sources (Leonard,
(Gustin, 1973; Merton, 1973) value the freedom to Beauvais, & Scholl, 1999).
choose projects, enjoy opportunities to publish their Social identification theory postulates (Tajfel &
research results, present their achievements to peers, Turner, 1986) that a person forms a sense of self
and strive for their peer community’s recognition through three crucial steps: categorization, or the
(Merton, 1973; Roach & Sauermann, 2010; Stern, selection of a reference group; identification, which
2004). Above all, “the scientist is reminded that it is entails adoption of the reference group’s values and
his role to advance knowledge” (Merton, 1973: 293), beliefs; and comparison, such that symbols and be-
and a reward “often attributed to science is the sat- haviors distinguish in-group from out-group mem-
isfaction derived from solving the puzzle” (Stephan, bers. The simultaneous occurrence of the three steps
1996: 1203). Moreover, owing to the primacy produces an augmented individual identity that can
principle—“a key component of the scientific guild’s generate reciprocal behaviors (Tajfel & Turner, 1986)
measures of excellence” (Mudambi & Swift, 2009: and positive attitudes such as commitment or em-
738)—a winner-take-all logic is pervasive in science powerment (Settoon, Bennett, & Liden, 1996). In this
(Stephan, 1996). sense, corporate scientists identify with the scien-
Relative to other inventors in industrial R&D, cor- tific community’s values about rewards and reward
porate researchers with a taste for science are more structures: In science, there are “no awards for being
similar to scientists in academia (Sauermann & second or third;” rather, a reward is “priority-based
Cohen, 2010; Sauermann & Stephan, 2013). Stephan and reflects the value of the winner’s contribution to
(1996: 1209–1210) highlighted that “the research of science” (Stephan, 1996: 1202).
some scientists and engineers in companies like IBM,
AT&T, and Du Pont is virtually indistinguishable from
Social Identification and Information
that of their academic counterparts” and that “Bell
from Rewards
Labs, Du Pont, IBM, Smith Kline and French, Sony,
and General Electric have each been the research PFP initiates both motivational and informa-
home to scientists who have subsequently won the tional processes. First, pay is intended to motivate2018 Giarratana, Mariani, and Weller 269
employees to exert more effort. Second, pay prac- with a predisposition to cancer, and licensed it to
tices have informational (also called signaling or DuPont, scientists were frustrated over the com-
sorting) effects (Gerhart et al., 2009; Lazear, 2000; mercial use of their invention. As a result, they began
Shaw, 2015), which mitigate information asymme- to reinterpret the meaning of patents and “incorpo-
tries in imperfect markets (Connelly, Certo, Ireland, rated them into hybrid exchanges at the boundary as
& Reutzel, 2011; Spence, 1973). Through PFP, em- a means of maintaining (and even strengthening) the
ployees receive information and attach subjective distinction between the academic and commercial
meanings to the pay system of their firm—though logics” (Murray, 2010: 346).2 False negatives instead
these meanings may differ from the firm’s actual in- are inevitably noisy signals, because it is difficult
tentions (Bowen & Ostroff, 2004; Liao, Toya, Lepak, & to interpret whether they result from uncertainty or
Hong, 2009; Nishii, Lepak, & Schneider, 2008). Our strategic considerations.
theory follows directly from these processes, with
the arguments that rewards and false rewards both
Hypotheses
have motivational and informational effects, and
that false rewards get interpreted differently by sci- False positives lower individual effort by reducing
entists and nonscientists. the opportunity costs of diminished effort, for cor-
From a motivational perspective, rewards have porate scientists and nonscientists alike. Organiza-
positive effects on effort and performance because tions that reward many patents (and thus generate
they reinforce desired behaviors, reflect equitable false positives) indicate that they are using these re-
input–output relations (Adams, 1963), and increase wards for purposes other than to recognize out-
the instrumentality of efforts (Vroom, 1964). They standing achievements. Such uses might lead to
also inform employees about the firm’s desired be- negative social comparisons and envy (Nickerson &
haviors, as well as its strategic intentions. For ex- Zenger, 2008), harm morale, stimulate unethical be-
ample, firms may want to establish a culture that havior, and lower effort (Larkin et al., 2012), as well
tolerates failure (Ederer & Manso, 2013), and rewards as resulting in perceptions of relative deprivation
for risky outcomes would signal this approach. Re- (Crosby, 1984; Walker & Pettigrew, 1984) and un-
wards are also tangible artifacts that result from selec- fairness (Greenberg & Colquitt, 2005). Such outcomes
tion and appraisal processes. Thereby, they establish are detrimental to both the social climate at work
social group boundaries (e.g., high versus low per- (Collins & Smith, 2006) and employees’ creative out-
formers, those to retain or fire) and evoke social put. Harhoff and Hoisl (2007) found that such work
comparison processes (Ockenfels, Sliwka, & Werner, conflicts represent a major perceived drawback of
2015), which are necessary for social classification competitive pay schemes in an innovation context.
and identity formation. Unlike false negatives, which may remain un-
False rewards also have motivational and in- noticed, false positives are tangible and create sym-
formational effects. False positives lower the op- bolic power. They also carry important information
portunity costs of decreasing effort, and false about the firm’s type and strategic intentions, which
negatives lower the instrumentality of rewards. From may affect corporate scientists more strongly than
a motivational perspective, though, it is hard to de- nonscientists. Corporate scientists find it difficult
termine whether one type of false reward might exert to reinforce their self-concept when rewards are
a stronger negative effect than the other. From an omnipresent. In response, they may choose to change
informational perspective, false rewards provide “the out-group with which the in-group is com-
helpful information about the firm’s type, such as pared” (Ashforth & Mael, 1989: 24), withdraw from
whether it is more scientific or commercial (Murray,
2010). False positives, in particular, provide strong
2
and tangible feedback that the firm tolerates failure As a second example, researchers in academia may
and appreciates risk. However, they also signal receive rewards from their institutions for publishing ar-
ticles in scientific journals. The journals’ review processes
a conflict with the values of the scientific community
and decisions reveal the researchers’ contributions, out-
that only rewards stellar performance. As such, false
comes, and rewards, which may be perceived as correct,
positives potentially generate discontent because false positives, or false negatives. Rewards for publications
they violate an important norm. Such norm viola- also carry a symbolic meaning that distinguishes academic
tions and their effects have been vividly documented scientists from other faculty members. If many systematic
(Murray, 2010): When Harvard researchers patented false positives occur, the value of rewards for publications
the “Oncomouse,” a genetically manipulated mouse diminishes and loses its identity formation function.270 Academy of Management Journal February
their peers in R&D, and collaborate with other Firms that have many patents create consistency by
members of their organization. In posing salient “establishing an effect over time and modalities
threats to the identities of corporate scientists, false whereby the effect occurs each time the entity is
positives cause them to perceive that they are rela- present” (Bowen & Ostroff, 2004: 201). In summary,
tively more deprived and unfairly treated compared to observations of reward decisions about many patents
other inventors. Following social identity, equity, and reveal false rewards as a consistent pattern, which
withdrawal theory (Adams, 1963; Hulin, Roznowski, facilitates employees’ sense-making process and
& Hachiya, 1985), we expect that in response to false creates stronger feedback effects. We posit:
positives, corporate scientists invest less in R&D
Hypothesis 3. The effects of false positives on
tasks and turn to alternative reference groups within
corporate scientists’ (a) working time in R&D
the firm.
tasks and (b) interactions with peers in R&D are
Hypothesis 1. With increasing levels of false more strongly negative when the firm has many
positives, corporate scientists (relative to other patents.
types of inventors) (a) dedicate fewer working
hours to R&D tasks and (b) invest less in in-
DATA AND MEASURES
teractions with peers from the R&D department.
Sample Description
In contrast, false negatives are relatively noisy and
difficult to interpret. They might reflect the un- Our data come from a survey conducted between
certainty of the context, indicate that the firm uses 2009 and 2011 in 20 European countries, Israel, the
rewards selectively, or both. Because selective re- United States, and Japan among inventors who ap-
wards mimic the scientific reward structure and plied for a patent to the European Patent Office, with
norms, corporate scientists (relative to nonscientists) priority dates between 2003 and 2005. Appendix B
should react less negatively, or even positively, to provides a detailed description. From the 22,557
false negatives. At a minimum, because of the noise valid responses to this survey, we extract a sample
that accompanies false negatives, they should have that matches our theoretical requirements. We first
a significantly weaker relationship with identity select patents owned by for-profit corporations (77%
threats compared to false positives. We therefore of all observations). We then focus on inventors who
hypothesize: work in formal R&D projects and whose regular job is
“inventing” in an R&D department (50% of obser-
Hypothesis 2. The effects of false positives on
vations). In addition, we only consider firms with
corporate scientists’ (a) working time in R&D
two or more patents in the database (73% of obser-
tasks and (b) interactions with peers in R&D are
vations) to reduce the potential noise due to sporadic
more strongly negative than are the effects of
innovators. After excluding cases with missing data
false negatives.
for our core covariates, the final sample consists of
Finally, false rewards may have stronger effects in 3,955 patent–inventor observations.3
firms that own many patents. To convey consistent
messages, firms must establish a sufficiently large
Dependent Variables
stream of observations and information that em-
ployees can interpret. According to signaling theory The dependent variables measure inventors’ be-
(Bangerter, Roulin, & König, 2012; Connelly et al., haviors during projects that led to a patented in-
2011), clear signals are observable and intense, and vention. We use responses to two survey questions.
occur frequently. Connelly et al. (2011: 53–54) noted The first question, R&D Working Hours, reflects the
that sending information “repetitively can increase number of weekly working hours that the inventor
the effectiveness of the signaling process.” In firms dedicated to creative R&D activities. The second
with only a few inventions and patents, PFP and false
rewards are difficult to interpret, but in firms with 3
Hoisl and Mariani (2016) and Torrisi et al. (2016) used
many inventions and patents, false rewards emerge
data from this same survey. Their studies addressed dif-
as a consistent pattern. Similarly, strategic HRM lit- ferent issues (i.e., gender pay gap; use and nonuse of pat-
erature has recognized that firms can create more ents) and employed different dependent variables. Most of
uniform and unambiguous reactions among em- the control variables differed too, with only some similar-
ployees if they implement strong, distinctive, and ity in the basic inventor- and firm-level control indicators.
consistent HRM systems (Bowen & Ostroff, 2004). They also employed different subsets of the overall sample.2018 Giarratana, Mariani, and Weller 271
question pertains to the relative frequency of com- information about whether the inventor, as a re-
munication and interactions with colleagues in the sult of the focal invention, received a permanent
R&D department. We construct Interactions with R&D salary increase (2.2%), a one-shot bonus (54.5%),
Colleagues as (a – b)/(a 1 b), where a is the frequency a payment conditional on future revenues from the
of interactions with colleagues in the R&D department, patent (16%), career advancement opportunities
and b is the average frequency of interactions with (4.7%), or none of these rewards (22.6%). In line
colleagues in other departments (production, mar- with our theory, we define salary increases or bonus
keting, logistics, human resources). The scales for payments as PFP rewards that accrue when a patent
both a and b range from 1 (“never”) to 5 (“daily”). is filed.5
Second, the inventors provided an estimate of the
monetary value of the patented invention, based on
Corporate Scientists
their expert experience and knowledge they had
To differentiate corporate scientists from other accumulated between the filing date and the time of
inventors, we focus on two main work motivations the survey.6 This self-reported patent value indicator
of scientists, as suggested in sociological literature was cross-validated with a regression approach in
(Gustin, 1973; Merton, 1973): peer community rec- which the indicator served as the dependent variable,
ognition and a desire to solve intellectual challenges. and standard proxies for patent value (e.g., forward
The inventors assessed their motivations on five- citations, patent claims, number of patents in the
point rating scales, ranging from 1 5 “not important” patent family [Trajtenberg, 1990]) were the indepen-
to 5 5 “very important.” From their responses, we dent variables. The results from these estimations
created a dummy variable (Corporate Scientists) that (available on request) confirm that the covariates are
takes a value of 1 for all inventors who rated both highly correlated with self-reported patent value,
recognition and intellectual challenges higher than after controlling for several other sources of patent
the sample median (2 and 3, respectively). A dummy value heterogeneity.
variable approach can identify inventors who score Third, we compare the monetary value of the focal
high on both dimensions (Prendergast, 2008) and is patent with the average monetary value of all patents
conceptually aligned with our theory of social in the same technological class in our survey.7 Then,
identity formation and social group membership, in False Positives is the number of a firm’s rewarded
that it clearly demarcates corporate scientists from patents whose value is below the average value of
other types of inventors.4 patents in the same technological class, divided by
Our data reveal some salient characteristics of
corporate scientists. On average, they publish 10.7 sci-
5
entific articles, compared with 6.74 by other inventors; In alternative specifications (available on request), we
35% hold a PhD, versus 25% of other inventors. These treated other payments conditional on future patent reve-
differences are statistically significant at the 1% level. nues and career advancement opportunities as PFP com-
ponents. Alternatively, we controlled for them in the
Table 1 shows that corporate scientists account for
regressions. The estimated results do not change relative to
17.4% of the sample. As we demonstrate subsequently,
those that use only monetary rewards at the time of the
these motivations are also stable over time. invention.
6
Specifically, the survey asked: “Suppose that on the
False Positives and False Negatives day in which this patent was applied for, the applicant and
you had all the information you have today regarding the
To measure false positives and false negatives, value of this and the related patents. In case a potential
we use two survey questions. First, we gather competitor of the applicant was interested in buying the
whole set of patents (the patent family including all na-
tional patents derived from it), what would have been the
4
Our results also hold if we employ the sample mean minimum price (in euros) that the applicant should have
(more than 3 and 4, respectively) to define the threshold, demanded?” The respondents were provided with 10
and if we define corporate scientists by applying a clus- value classes, from 0 to more than 300 million euros.
7
tering procedure to the two motivations (i.e., using the city Patents were classified into 30 ISI-INPI-OST techno-
block distance metric and centroids equal to the medians). logical classes (http://www.wipo.int/export/sites/ www/
Similarly, in the upcoming regressions, the estimated re- ipstats/en/statistics/patents/pdf/wipo_ipc_technology.
sults show the same signs (but slightly lower statistical pdf). The results did not substantially change when we
significance thresholds) when we use the sum of the mo- used the average value of all patents in all technological
tivation scores as a continuous variable. classes for a focal firm.272 Academy of Management Journal February
TABLE 1
Corporate Inventors and Motivations to Invent
Intellectual Challenge
Below the Median (%) Above the Median (%) Total (%)
Scientific Reputation Below the Median 46.4 23.8 70.2
Above the Median 12.4 17.4 29.8
Total 58.8 41.2 100.0
Notes: 3,955 observations.
all of a firm’s patents. Following the same logic, False False Positives estimates is about four times greater
Negatives is the number of a firm’s nonrewarded than that of False Negatives).
patents whose value is above the average value of We also estimate ordinary least squares (OLS) re-
patents in the same technological class, over all of gressions at the firm level that employ False Positives
a firm’s patents.8 Note that False Positives and False and False Negatives as dependent variables, with Re-
Negatives are firm-level variables that reflect the warded Patents as the key independent variable, as well
firms’ pay system and the degree to which it is af- as the control variables detailed in the next section.
fected by false rewards. Rewarded Patents is the These estimated results (available on request) show that
overall share of a firm’s patents that the firm rewar- Rewarded Patents correlate negatively with False
ded with a bonus. Negatives (b 5 20.112, SE 5 0.014) and positively with
Table 2 shows that the average share of Rewarded False Positives (b 5 0.473, SE 5 0.022), in line with
Patents is 41%, and about half of them have a value the simulation patterns that we present in Appendix A.
below the sample average (False Positives), whereas
only 7% achieve a value above the sample average
Control Variables
but do not receive a monetary reward (False Nega-
tives). The correlation between Rewarded Patents We control for several sources of heterogeneity at
and False Positives is strong and positive; the corre- different levels: patent, inventor, and firm. An in-
lation between Rewarded Patents and False Nega- ventor’s work autonomy could influence her or his
tives is negative, as expected. Thus, in line with the ability to choose the level of R&D Working Hours, as
twofold selection regime explained in Appendix A, well as the degree of her or his Interactions with R&D
the larger the share of rewarded patents, the greater Colleagues. Thus, the first factor that we control for is
the probability that both low- and high-value patents Autonomy, defined as an inventor’s ability to allo-
receive a reward. cate his or her working time freely to different tasks
Table 3 contains the results of a t-test that com- or projects. We measure this variable on a scale from
pares False Negatives and False Positives in firms 1 (“very low”) to 5 (“very high”).
with a different reward breadth; that is, for firms In addition to information about whether a patent
where Rewarded Patents is either above or below the received a bonus, we have some details (but with
sample median. This comparison again confirms
the expected trade-off: With more Rewarded Patents,
False Negatives are relatively lower, and False TABLE 2
Rewarded Patents, False Positives, and False Negatives
Positives are relatively higher. However, the increase
in False Positives is much larger than the decrease in Correlations
False Negatives (the absolute difference between the Variables Mean SD 1 2 3
8
We performed robustness checks with different cutoff 1. Rewarded 0.41 0.24 1
points to define False Positives and False Negatives, in- Patents
2. False Negatives 0.07 0.09 20.31*** 1
cluding the median and the 55th, 60th, and 75th percen-
3. False Positives 0.19 0.15 0.73*** 20.23*** 1
tiles of the patent value distribution. The signs and
statistical significances of the estimated results (available Notes: 3,955 observations. The statistics were derived from
on request) were consistently confirmed; the magnitude of individual-level patent observations. Firm-level statistics are vir-
the coefficients decreased for higher cutoff values, though, tually identical and available on request.
probably due to range restrictions. ***p , .012018 Giarratana, Mariani, and Weller 273
TABLE 3 correlate with inventor behaviors, such as whether
False Positives and False Negatives: Firm Comparisons the patent is the result of teamwork (Teamwork
% False % False dummy), the size of the project investment in terms
Negatives Positives of the log of the number of man-months employed to
develop the invention (Project Size), whether the
Firms with Rewarded 0.096 (0.002) 0.096 (0.001) patent is part of a patent family that composes the
Patents below the invention (Patent Family dummy), and whether
median
Firms with Rewarded 0.046 (0.001) 0.285 (0.002)
the project is financed with the firm’s internal
Patents above the cash (Funding dummy). At the firm level, we
median control for firm size (Large Firm indicates firms
Difference (t-test; 0.05*** (0.002) 20.189*** (0.00) with more than 250 employees, Medium Firm is
p value) 50–250 employees; the reference group is smaller
Notes: 3,955 observations. The statistics were derived from
firms), the log of stock of the firm’s patents in
individual-level patent observations. Firm-level statistics are vir- the survey (Firm Patents), R&D employees over
tually identical and available on request. total firm employees (R&D Intensity),10 and the
***p , .01 extent to which the firm provides a scientifically or
technically stimulating work environment (Work
sizable missing data) about the size of the bonus Environment), measured on a 1–5 scale. Finally,
(i.e., monetary value of the reward). We aggregate the we include dummies for patent priority years
reward size data to the firm level and use the stan- (Year2003, Year2004, and Year2005), the techno-
dard deviation to control for the dispersion of reward logical classes of the patents (30 technology class
size within a firm.9 Information about pay systems dummies), and the 23 countries of the inventors’
can be weak or strong, depending on the frequency residence. Table 4 displays the descriptive statis-
with which it is transmitted and the similarity of the tics; Appendix C lists the variables and their
rewards. For example, the expected negative effect of definitions.
False Positives could be mitigated if companies used
heterogeneous reward intensities to discriminate RESULTS
between low- and high-quality patents. The Reward
Size Standard Deviation variable, which measures Table 5 contains the results of four patent–
within-firm standard deviations in reward size, inventor-level OLS regressions with robust stan-
controls for such effects. dard errors clustered by firm, where the dependent
As additional scientist-level controls, we use the variable is R&D Working Hours. Table 6 mirrors
number of weekly working hours (Working Hours), these regressions for the outcome variable In-
annual income (Income), gender (Gender dummy: teractions with R&D Colleagues. In each set, we
1 5 men, 0 5 women), years of experience as an add the covariates stepwise to the models. The
inventor (Experience), education (PhD and Bache- main effects of False Positives and False Negatives
lor’s or Master’s dummies, with high school or lower on the dependent variables are statistically not
degrees as the baseline), stock of past inventions significant, but when we allow False Positives to
(Inventor’s Past Inventions), and stock of past pub- interact with Corporate Scientists, the coefficient is
lications (Inventor’s Past Publications). We also negative and statistically significant (p , .01) for
control for project-specific factors that could both R&D Working Hours and Interactions with
R&D Colleagues. Thus, Corporate Scientists dedi-
cate fewer working hours to R&D and withdraw
9
The firm-level aggregation makes the missing-data from their closest peers in the R&D department
problem less intense. We also conducted robustness
checks in which we used the average monetary value of the
10
reward at the company level, together with individual- Missing data about total employees affect 31% of the
level bonus and false rewards variables (i.e., patent re- observations, also creating missing values in the R&D In-
ceived a reward/did not receive a reward and was/was not tensity measure. To avoid underrepresentation of small
economically successful). In interviews with a small and medium-sized firms, we employed a procedure pro-
sample of inventors (detailed in the “Evidence from In- posed by Hall and Ziedonis (2001) and set the missing
terviews” section), we confirmed that the amount of money values to 0, then added a new dummy variable that takes
inventors typically receive for patents is low and thus less a value of 1 when the value for the prior variable is missing
important as a decision criterion than one might expect. (R&D Intensity Missing Dummy).274 Academy of Management Journal February
when they confront compensation plans that reward Working Hours and Interactions with R&D Col-
many low-value inventions. This result is robust leagues. The F-tests of the differences between the
across all specifications and robustness checks (as we coefficients in the two groups equals 3.53 for R&D
detail subsequently) and supports Hypothesis 1.11 In Working Hours and 4.91 for Interactions with R&D
terms of effect size, the False Positives 3 Corporate Colleagues. These tests are significant at the 5% and
Scientists interaction produces an elasticity of 29.2% 1% levels, respectively. In other words, if firms
for R&D Working Hours, equivalent to an average have many patents, the negative interactions be-
reduction of about four hours of R&D working time tween False Positives and Corporate Scientists are
per week. The elasticity for Interactions with R&D stronger, in support of Hypotheses 3a and 3b.13
Colleagues is 10.1%.12 Estimates for firms with many patents (above the
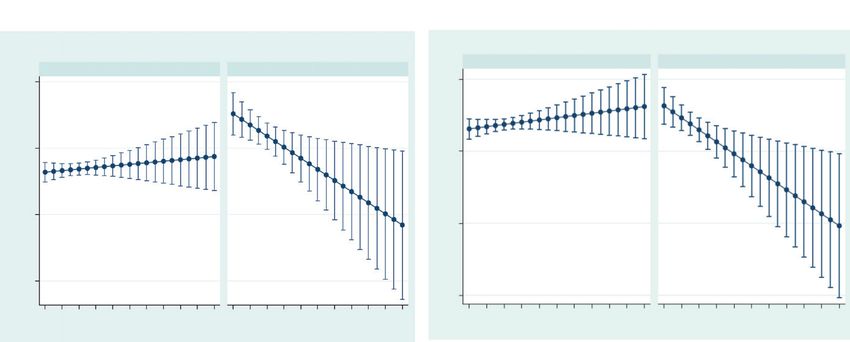
To facilitate interpretation of the results, Figure 1 median) may have smaller standard errors (due to
displays the marginal effects of the two regression the larger number of patents and thus more robust
models (Models 4 and 8 from Tables 5 and 6, re- information) than those for firms with fewer pat-
spectively) for Corporate Scientists and other in- ents. However, with regard to the results in Table 7,
ventors. For example, an increase in False Positives for R&D Working Hours as the dependent variable,
from 0.04 (mean minus one standard deviation) to the standard errors of the interaction term (False
0.44 (mean plus one standard deviation) results in Positives 3 Corporate Scientists) are 72% greater
a decrease of the R&D Working Hours of a corporate for firms with many patents than for firms with
scientist from 17.26 to 13.91 (on average); likewise, fewer patents. For the Interactions with R&D Col-
Interactions with R&D Colleagues drop from 0.35 to leagues variable, the standard errors decrease by
0.28. For other types of inventors, the same variation 49% for firms with many patents, but the increase
in False Positives produces negligible effects (in- in the effect size is much stronger from a relative
crease in R&D Working Hours from 13.2 to 13.7, in- standpoint and amounts to 166%. Therefore, we
crease in Interactions with R&D Colleagues from are confident that differences in the numbers of
0.33 to 0.34). patents are unlikely to drive these findings through
The interaction between False Negatives and Cor- smaller standard errors. An alternative interpre-
porate Scientists is not statistically significant. If we tation suggests that firms with many patents enable
compare the interaction effects of False Positives 3 scientists to form stronger social identity-related
Corporate Scientists and False Negatives 3 Corporate processes. Although we cannot rule out this in-
Scientists (from Models 4 and 8, Tables 5 and 6), the terpretation, it also does not contradict our theo-
Wald test of the differences between the coefficients is retical approach.14
3.57 for R&D Working Hours and 4.86 for Interactions Because our study involves different levels of
with R&D Colleagues. These tests are significant at analysis (i.e., patent–inventor and firm), we employed
the 5% and 1% levels, respectively, in support of two alternative approaches to confirm that our results
Hypotheses 2a and 2b. are not driven by the use of an OLS model or the
To address Hypothesis 3, we split the sample aggregation procedure (from patent to firm level).
according to the median value of Firm Patents First, we employed a multilevel, mixed-effects lin-
(Table 7). The False Positives 3 Corporate Scientists ear regression model that accounts for the patent–
interaction term is significantly weaker when Firm inventor and firm levels of observation. Second,
Patents is below the sample median, for both R&D because the aggregated variables at the firm level
might vary in their reliabilities, depending on
11
We estimated our model with cross-sectional data, be- the numbers of observed patent–inventor pairs
cause the firm-level variables exhibit little variation over the per firm, we performed our regressions on three
three-year period that we observe. However, this approach
may lead to simultaneity issues. As a robustness check,
13
we estimated the regressions with a one-year lag in the core In an alternative test of Hypothesis 3, we estimated a
covariates False Positives(t-1) and False Negatives(t-1), rela- three-way interaction effect of False Positives 3 Corporate
tive to inventors’ behaviors measured at t. Although we lose Scientists 3 Firm Patents. The effect is negative, as ex-
about one-third of the observations, the estimated results are pected, and statistically significant at the 10% level for
similar to those in Tables 5 and 6. R&D Working Hours and the 1% level for Interactions
12
We calculated these elasticities using the STATA with R&D colleagues. All other results remain virtually
command eyex, as d(log y)/d(log x), such that they indicate unchanged.
14
the marginal variation of y relative to the marginal varia- We thank an anonymous reviewer for providing this
tion of x. insight.2018 Giarratana, Mariani, and Weller 275
TABLE 4
Descriptive Statistics and Pairwise Correlations
Mean SD Min Max 1 2 3 4 5 6 7 8
1 R&D Working Hours 13.91 14.63 0 95 1
2 Interactions with R&D 0.34 0.21 20.56 0.67 0.01 1
colleagues
3 False Positives 0.19 0.15 0 1 20.14 0.06 1
4 False Negatives 0.07 0.09 0 1 0.07 20.03 20.23 1
5 Corporate Scientists 0.17 0.38 0 1 0.12 20.02 20.06 0.02 1
6 Autonomy 3.48 1.2 1 5 0.11 20.04 20.05 20.01 0.08 1
7 Reward Size Standard 3.63 5.06 0 46.04 20.08 0.05 0.2 20.16 0.03 20.02 1
Deviation
8 Working Hours 43.54 14.1 0 100 0.33 20.02 20.04 0.1 0.02 0.03 20.07 1
9 Inventor’s Past 6.94 15.39 0 240 0.11 0.05 20.06 20.04 0.11 0.09 0.02 0.07
Publications
10 Work Environment 4.03 1.09 1 5 0.02 0.07 0.04 20.06 0.02 0.12 0.08 20.01
11 Income 3.6 1.2 1 5 20.08 0.01 0.03 0.03 0.01 20.01 0.02 0.03
12 Experience 2.49 0.8 0 4.54 20.01 20.09 20.04 20.02 0.03 0.08 0.03 0.04
13 Gender Dummy 0.96 0.19 0 1 20.02 20.05 0.04 0.03 20.03 20.01 20.02 0.01
14 PhD Dummy 0.28 0.45 0 1 0.12 0.06 20.08 20.02 0.08 0.11 0.03 0.06
15 Bachelor’s or Master’s 0.63 0.48 0 1 20.09 20.01 0.11 0.01 20.08 20.1 20.02 0
Dummy
16 Large Firm Dummy 0.91 0.28 0 1 20.03 0.08 0.09 0.02 20.03 20.04 0 0.01
17 Medium Firm Dummy 0.05 0.21 0 1 0.02 20.06 20.07 20.02 0.02 0.02 0.01 20.02
18 Inventor’s Past 39.58 64.12 1 1000 0.04 20.01 20.03 0.04 0.06 0.02 20.02 0.12
Inventions
19 Teamwork Dummy 0.82 0.39 0 1 0.07 0.07 20.07 0.01 20.01 0.02 20.03 0.04
20 R&D Intensity 0.21 0.32 0 1 0.02 0.08 0.04 20.06 0.06 0.05 0.11 0.02
21 R&D Intensity Missing 0.31 0.46 0 1 20.06 0.07 0.09 20.03 20.06 20.08 0.05 20.01
Dummy
22 Firm Patents 3.22 1.34 1.1 6.25 20.13 0.16 0.22 20.11 20.04 20.05 0.33 20.01
23 Project Size 2.02 1.22 0 4.45 0.33 0.01 20.18 0.09 0.06 0.08 20.09 0.14
24 Funding Dummy 0.91 0.29 0 1 0.01 0.02 20.01 0.02 0 0.02 0.01 0.01
25 Patent Family Dummy 0.4 0.49 0 1 0.15 20.02 20.09 0.04 0.04 0.04 20.02 0.07
separate subsamples; namely, the top 30%, 50%, Inventors’ Income and Experience correlate nega-
and 70% of firms in terms of their number of patents tively with R&D Working Hours. More experienced
and inventors. With both these analyses (results inventors dedicate less time to R&D activities than
available on request), we fully confirm the central younger researchers do, and interact more with
results of our estimations. people in other departments. Inventors involved in
Finally, the control variables behave mostly as Teamwork allocate less time to R&D, but focus more
expected. Corporate Scientists work more hours on on interactions in their department. In firms with
R&D projects; the relationship with Interactions many Firm Patents, inventors work fewer R&D hours
with R&D Colleagues is also positive, though sta- and have more interactions with colleagues in the
tistically weaker. A stimulating Work Environment R&D department. However, the counterintuitive sign
positively correlates with the number of hours of Firm Patents on R&D Working Hours should be
worked on R&D projects and with interactions in- cautiously interpreted together with the positive sign
side the R&D department. Autonomy has a posi- of Patent Family.
tive correlation with R&D Working Hours and
a negative relationship with Interactions with R&D
Colleagues, suggesting that inventors with high VALIDATIONS AND ROBUSTNESS CHECKS
levels of autonomy focus more on R&D and look out-
Heterogeneity in Reward Size and Autonomy
side their departments as a source of inspiration;
however, autonomy might also imply greater mana- To check the robustness of our results further, we
gerial responsibilities, including cross-departmental performed our main regressions (Tables 5 and 6) for
tasks. Working Hours behaves similarly to Autonomy. two subsamples of observations, above and below theYou can also read