THE CARROLL FUND P2 REPORT - ADAM HALL, COLLIN WILCOX, JOHN PARK, PAXTON CHERRY, WALKER HALE, WILL DAVIS AND WILL LEWIS
←
→
Page content transcription
If your browser does not render page correctly, please read the page content below

THE CARROLL FUND P2 REPORT

ADAM HALL, COLLIN WILCOX, JOHN PARK, PAXTON CHERRY, WALKER HALE, WILL DAVIS AND WILL LEWIS

                                                                                             1
TABLE OF CONTENTS

 Letter to the Carrolls………………………...…………………………………….……….. 3
 Economic Outlook………………………………………………………………………….. 4
 Performance Summary…………………………………………………………………….. 5
 Risk Metrics……………………..………………………………………………………….. 6
 Best & Worst Performers………...…………………….………………………………….. 7
 Holdings Returns..…………...…...………………………...………..………………….….. 8
 Allocation of Funds……………………………………....………………………………….9
 Portfolio Breakdown…………………………………......…………………………...…….10

Communication Services………….………11-13 Industrials…………..……..….…… 35-38
  Fidelity MSCI Communication Services ETF
                                         .    12     Jacob’s Engineering                         36
  Verizon                                     13      Lockheed Martin                            37
Consumer Discretionary…………………..14-16                 Raytheon Technology                         38
   Amazon                                      15 Information Technology.….…...….. 39-43
   Nike                                        16     Apple                                    . 40

Consumer Staples………………………… 17-20                      First Trust NASDAQ Cybersecurity ETF 41
  Coca-Cola                                    18     Microsoft                                 42
   PepsiCo                                 .. 19      SPDR S&P Semiconductor ETF                43
  Walmart                                      20  Materials………………....………...... 44                     .

Energy………………………………………..21                          Real Estate….…………. …….….... 45-46               .

Financials…………………………………...22-27                          PotlatchDeltic                         46
   BlackRock                           .       23  Utilities….……………...……….... 47-48        .   .

   Global X FinTech ETF                       .24        Utilities Select Sector SPDR Fund       48
   J.P Morgan                                  25 Fixed Income……………...……….. 49-52
   S&P Global                                  26       iShares Core US Aggregate Bond ETF .50
   Visa                         .              27      Principal Spectrum Preferred Securities 51
Healthcare……....………………………….28-34                        Active ETF
    Amgen                                      29       WisdomTree Floating Rate Treasury ETF 52
    AMN Healthcare Services                    30     .
    ARK Genomic Revolution ETF           .    .31
    CVS Health Corporation                     32
    Johnson & Johnson               .          33
   Merck                                          34

 Fund Managers…………………………………………………………………………. 53-54
 Works Cited……………………………………………………………………………... 55-60

                                                                                                           2
LETTER TO CARROLLS

Dear Mr. and Mrs. Carroll,

The Carroll Fund managers would like to take this opportunity to thank you for allowing us this tremendous
experience in the world of wealth management. Unlike any other class, and incredibly unique in its purpose,
our time spent on the Carroll Fund has been both educating and enriching to each member personally. As we
venture into careers in the professional world, we will undoubtedly apply the skills and lessons learned
through serving as Torch Fund managers.

Throughout Period 2, in reaction to new developments and trends, several important changes were made to
the portfolio. The Carroll sold some of our positions in Global X FDS Fintech ETF (FINX), JPMorgan
Chase (JPM), Raytheon Technologies (RTX), and all Healthcare holdings, as we looked to realize profits
while also freeing up cash for future investments. With our replenished cash, we were able to unanimously
establish new positions in several companies including Walmart (WMT), Lockheed Martin (LMT), and Visa
(V). The fund felt that these companies greatly aligned with our long-term outlook for the economy and
offered both great stability and upside potential in times of continued uncertainty.

Over the last period, the Carroll Fund returned 1.89%, narrowly missing our benchmark of 2.35%. The fund
continues to look for opportunities to manage our risk, without leaning into currently unattractive yields
available in fixed income, to achieve a risk profile comparable to our 60/40 benchmark.

We would once again like to thank you for allowing us the opportunity to take part in this experience.
Knowing that this would not be possible without your generous support, we are humbled by your willingness
to continue to give back to the University of Tennessee and to students like us.

Sincerely,

Adam Hall, Collin Wilcox, John Park, Paxton Cherry, Walker Hale, Will Davis, and Will Lewis

                                                                                                             3
ECONOMIC OUTLOOK
Summary
With a remarkable start to 2021 thus far, the Carroll Fund has come to have an optimistic outlook for the
domestic economy and has taken a slightly optimistic outlook on the global economy for 2021. We see the
long-term effects of COVID-19 as the greatest risk to the economy but still expect a swift increase in overall
activity. We expect for the economic powerhouses of the global economy to recover quickly and expect large
demand post-covid. However, we expect the smaller less developed countries to recover much slower.
Domestic Economy
To gauge the health and future of the domestic economy, the Carroll Fund has studied the economic data for
Period 2 and noticed the purchasing manager index, existing home sales, and consumer confidence index are
outperforming expectations. Another key indicator we are monitoring is the rising 10-year Treasury yield to
gauge the potential cost of future growth. This is great news as it shows that people are becoming more
confident in the economic recovery. Similarly, the fund noticed unemployment figures and wholesale
inventories are decreasing faster than expected. Following that trend, the fund has also noted the massive
increase in vaccinations, a decrease in covid cases, and the fact that many states have retracted their mask
mandate and other health and safety protocols. Our team has determined that the re-opening of the economy,
along with the aforementioned economic indicators, is a clear indication of a swift economic recovery,
leading us to our optimistic outlook as we begin Q2 of 2021.
Global Economy
To gauge the health of the global economy, we studied geopolitical events throughout Period 2. The fund has
discussed many notable events and topics that have occurred throughout 2021 thus far. We believe that
vaccine rollout will have the greatest effect on the global economy. The Carroll Fund thinks that the vaccine
brings about positive future growth prospects as we expect economies and countries around the world to
reopen. Another major topic that we have discussed is the revival of global travel, and as a result, an increase
in global spending. However, due to the slow, and in some places inaccessible, distribution of vaccines, as
well as new economic lockdowns, our fund has decided to remain cautiously optimistic about the global
economy moving through the rest of 2021.
Outlook
The Carroll Fund’s economic outlook is optimistic about short-term future economic growth within the
United States and cautiously optimistic for the global economic recovery. As a result, we designed our
portfolio allocations to reflect the team’s economic outlook. We are overweight relative to the S&P 500 in
healthcare, financials, industrials, real estate, and consumer staples. We specifically targeted the financials
and industrials sectors for this time of expected economic expansion, as they are highly sensitive to the
economy. We believe that as the economy begins to recover more wholistically from the COVID-19
pandemic, these sectors will grow and expand. As a result, we believe that our investment strategy will allow
for the greatest growth for the portfolio during the coming year, while maintaining mindfulness to our
holding-specific, market, and economic risks.

                                                                                                               4
PERFORMANCE SUMMARY
Our Mission

To manage our funds and securities in a financially prudent manner, so that we can increase the overall value
of the fund while outperforming our benchmark and the other Torch Funds.

                   Carroll Fund       Benchmark           S&P 500         Spread from       Spread from
     Period
                     Return             Return             Return         Benchmark          S&P 500

       P2              1.89%             2.35%             6.17%             -0.46%            -4.28%

                                              Our Goals
                   Objectives                                              Period 2
    1. Achieve Positive Return
                                                                              ✅
    2. Outperform Our Benchmark
                                                                              ❌
    3. Outperform Competing
       Funds on Relative Return
                                                                              ❌
    4. Outperform Competing
       Funds on Absolute Return
                                                                              ❌
1. Period 2 (P2) date range is 12/31/2021 - 3/31/2021.
2. Our benchmark is the weighted average of the S&P 500 Index and Bloomberg Barclays US Aggregate Total
   Return Value Unhedged Index, weighted 60% and 40% respectively.

                                                                                                            5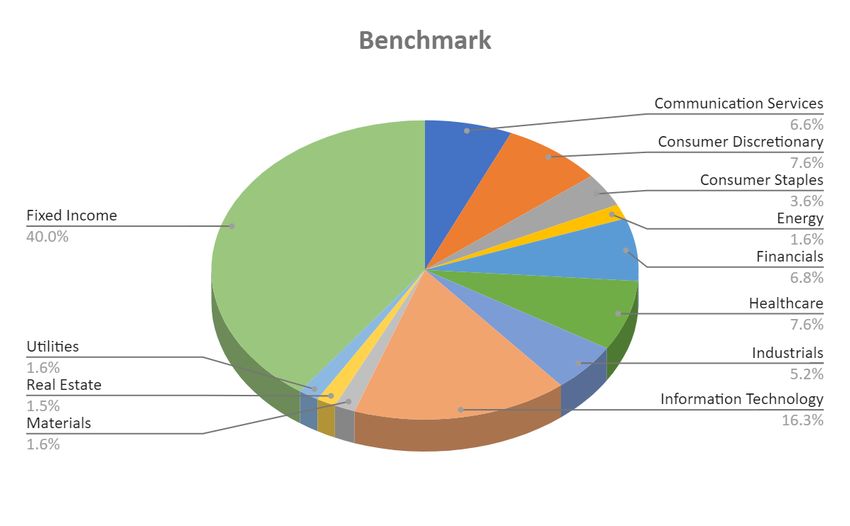
RISK METRICS

                                                  P2 Risk Metrics
                      Beta vs Benchmark               1.27                   Standard Deviation    12.76%
                            R2 of Beta                0.96                      Tracking Error      3.72%
                       Beta vs S&P 500                0.78                     Information Ratio   -0.3866
                            R2 of Beta                0.95

 Metric                        Portfolio                     Benchmark                   BETFX
 Sharpe Ratio                  0.67                          1.00                        1.55
 Treynor Ratio                 0.07                          0.10                        0.17

3. All metrics reported are annualized and use daily returns for their calculation.
4. BETFX is the Morningstar Balanced ETF Asset Allocation Portfolio

                                                                                                             6
BEST & WORST PERFORMERS

Holding           % Return          $ Return

 JPM               20.97%           $3,517.50
   J               18.83%           $2,523.96
 CVS               10.69%           $2,372.30
 RTX               9.66%            $3,004.57
AMGN               8.76%            $1,269.41
AMZN               -5.00%           -$1,954.20
 CIBR              -5.77%           -$1,505.28
 FINX              -6.00%           -$1,302.61
 NKE               -6.06%           -$556.28
AAPL               -7.79%           -$2,955.81

                                                 7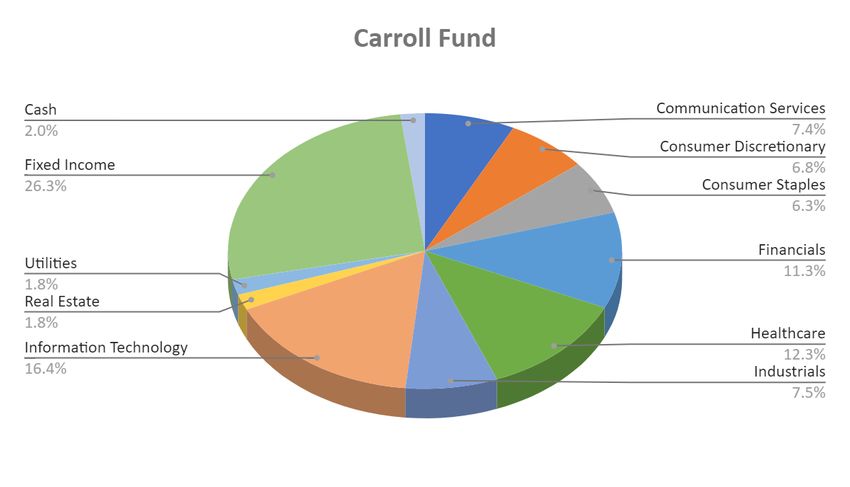
HOLDINGS RETURNS

Holding                      P2 Return   .   Holding                  P2 Return

        Communication Services                CVS                      10.69%

FCOM                          8.56%           JNJ                      4.76%

  VZ                          0.05%           MRK                      -4.46%

          Consumer Discretionary                        Industrials

AMZN                          -5.00%            J                      18.83%

 NKE                          -6.06%          LMT                      8.13%

            Consumer Staples                  RTX                      9.66%

  KO                          -3.88%           Information Technology

 PEP                          -3.11%         AAPL                      -7.79%

 WMT                          6.87%           CIBR                     -5.77%

                Financials                   MSFT                      6.25%

 BLK                          5.07%           XSD                      7.07%

 FINX                         -6.00%                   Real Estate

 JPM                          20.97%          PCH                      6.62%

 SPGI                         7.58%                      Utilities

  V                           1.11%           XLU                      2.87%

                Healthcare                             Fixed Income

AMGN                          8.76%           AGG                      -3.37%

 AMN                          8.41%           PREF                     -0.60%

ARKG                          -4.56%         USFR                      0.00%

                                                                                  8
ALLOCATION OF FUNDS

                      9
PORTFOLIO BREAKDOWN
Security Value on 1/1 Value on 3/31 % of portfolio
SPAXX $10,303.57 13,595.38 2.00%
Equity Holdings
AAPL $37,949.34 $34,934.90 5.15%
AMGN $14,484.96 $13,933.36 2.05%
AMN $10,647.00 $10,244.30 1.51%
AMZN $39,083.16 $37,128.96 5.47%
ARKG $16,133.98 $13,575.69 2.00%
BLK $15,873.88 $16,587.12 2.44%
CIBR $26,095.44 $24,590.16 3.62%
CVS $22,197.50 $21,741.47 3.20%
FCOM $36,627.50 $39,702.60 5.85%
FINX $21,720.15 $6,972.54 1.03%
J $13,402.08 $15,900.21 2.34%
JNJ $10,387.08 $9,532.30 1.40%
JPM $16,773.24 $13,548.47 2.00%
KO $10,693.80 $10,278.45 1.61%
LMT - $18,475.00 2.72%
MRK $17,341.60 $14,492.92 2.14%
MSFT $22,019.58 $23,341.23 3.44%
NKE $9,337.02 $8,770.74 1.29%
PCH $11,704.68 $12,383.28 1.82%
PEP $22,838.20 $21,783.30 3.21%
RTX $31,106.85 $16,767.59 2.47%
SPGI $17,751.42 $19,054.98 2.81%
V - $20,326.08 2.99%
VZ $10,692.50 $10,583.30 1.56%
WMT - $10,730.57 1.58%
XLU $12,101.10 $12,359.72 1.82%
XSD $26,812.46 $28,696.46 4.23%
Fixed Income Holdings
AGG $64,649.93 $62,265.01 9.17%
PREF $58,237.98 $57,390.08 8.74%
USFR $59,060.30 $59,060.30 8.87%
Total $666,026.30 $678,746.47 100.00%
10COMMUNICATION SERVICES
Manager: John Park
Sector Overview
The communications services sector is comprised of companies that offer a variety of services related to
communication, whether it is communication between people, machines, organizations, or through
information transfer. The companies in this sector serve the public by offering services such as fixed-line,
cellular, wireless, high bandwidth, or fiber optic cable network services to help further connect the world.
The communication services sector is critical because it provides an enabling function across all critical
infrastructure sectors.1
Recent Events
One major event that has been and will be sparking up the industry growth within the communications
services sector is the rollout of 5G. Analysts predict that there will be 2.8 billion 5G subscribers by 2025 and
3.5 billion by 2026. This technology is poised to change the way we live and is expected to power everything
from self-driving cars to advanced augmented reality experiences.2
The pandemic has also been a key driver for the growth within the communication services sector. Due to the
ongoing COVID-19 pandemic, businesses and individuals have adapted a new style within their operations
and lifestyle. Businesses have been shifting their workforces to work remotely, with many workers becoming
well adapted to that environment. Individuals are also avoiding direct contact due to the virus. This has
significantly increased the demand for wireless and other telecommunication services. The ongoing increase
in demand of higher quality communication methods, and more efficient ways to communicate and transfer
information will help the communications services sector to continue to grow in the future.
The communication sector, however, is exposed to risk due to regulation and cyber-attacks related to data
privacy and security threats.
Performance
11FIDELITY MSCI COMMUNICATION SERVICES ETF (FCOM)
Holdings Description
Fidelity MSCI Communication Services Index ETF is an exchange-traded fund incorporated in the USA.
The ETF seeks to provide returns that track the performance of the MSCI USA IMI Telecommunication
Services 25/50 Index3, less expenses and fees. The MSCI USA IMI Communication Services 25/50 Index
captures the large, mid and small cap segments of the domestic market within the communication services
sector, according to GICS.4 The ETF’s top 10 holdings (as of 03/31/2021) are shown below:5
Positive Impacts from Last Period
Communications services grew rapidly during the COVID-19 pandemic, as it inspired increased demand for
the products offered in the sector. Many companies held in the FCOM ETF were beneficiaries of this
increased demand, helping contribute soundly to the growth of this holding.
Negative Impacts from Last Period
International communication companies are a major threat to domestic communication companies. Global
communication is increasing at a faster rate due to the pandemic, leading global competitors to enter into the
market. This has resulted in a decrease in the international presence of domestic communication services
companies.
New Transactions
There were no transactions made involving FCOM during the P2 period.
Period 2 Performance
Start Value End Value Return Dividend Yield
$36,627.50 $39,702.60 8.56% 0.17%
12VERIZON (VZ)
Holdings Description
Verizon Communications Inc. is an integrated telecommunications company with over 120 million
subscribers. The company provides wire line voice and data services, wireless services, internet services, and
published directory information. Verizon also provides network services for the federal government,
including business phone lines, data services, telecommunications equipment, and payphones.6
Positive Impacts from Last Period
Verizon Communications Inc. announced that it will be ending its 3G services on the last day of 2022.7
While the end of the 3G era seems to be a substantial change, it shows that Verizon is committed to moving
on to develop its new services like 5G. The rollout of 5G has been, and will continue to be, a big trigger
point for Verizon’s future growth.
The company’s Q4 results have brought about some positive aspects as well. Verizon’s free cash flow and
operating cash flow increased 32.4% and 23.6% year-over-year, respectively, while its business segment
operating income and media revenues increased 42.6% and 11.4% year-over-year, respectively. The
company also spent $18.2 billion in capital expenditures to help support growth in both the current 4G, and
quickly developing 5G, networks.8
Negative Impacts from Last Period
The biggest negative impact from last quarter for Verizon was the lower-than-expected amount of postpaid
phone net additions. While this news disappointed the market, the company’sQ4 earnings furthered this
disappointment as the earnings report revealed that revenues decreased 1.2% year-over-year and that the
company’s in-line churn rate was higher than expected.9
New Transactions
There were no transactions made involving VZ during the P2 period.
Period 2 Performance
Start Value End Value Return Dividend Yield
$10,692.59 $10,583.30 0.05% 1.07%
13CONSUMER DISCRETIONARY
Manager: Will Davis
Sector Overview
The consumer discretionary sector of the economy focuses on goods and services considered non-essential
by consumers; they are products that are bought at the consumer’s discretion. Apparel, automotive, home
and office products, luxury goods, and travel and leisure industries all help to make up the sector. It is
cyclical in nature and heavily correlated to overall macroeconomic moves. When the economy is in
expansion, employment and wages tend to follow, as does spending on non-essential items. In contrast, when
the economy slows down or contracts, and unemployment rises while wages fall, spending on discretionary
products tends to fall as well.1
Recent Events
With the Biden administration achieving its goal of administering 100 million vaccinations in just 58 days,
compared to the original goal of its first 100 days, the economic reopening in the U.S. has gained a
substantial foothold, despite new variant concerns internationally. These vaccinations have allowed domestic
consumers to return to some of their favorite pre-pandemic restaurants, shopping centers, and other venues
under looser health and safety guidelines. January ’21 saw an increase in retail sales as former President
Trump’s final stimulus checks hit the direct deposits of eager consumers. February saw retail sales numbers
retreat as the Biden administration scrambled to pass its proposed $1.9 trillion relief bill but could not
successfully do so until early-mid March.2 The pent-up demand in the minds of consumers, and the pent-up
savings in their checking accounts, will continue to give way to vast consumer spending throughout the
coming spring and summer months. This influx of consumer spending will likely lead to a continued
outperformance by the consumer discretionary sector relative to the S&P 500, with the ‘travel and leisure’
and ‘retail/durables’ industries leading the charge behind the travel and retail demands of consumers. The
Carroll Fund is continuing to watch domestic vaccination progress, proposed corporate tax rate changes, and
inflation indicators to ensure that our discretionary holdings are situated for continued success.
Performance
14AMAZON (AMZN)
Holdings Description
Amazon.com, Inc. is a well-known e-commerce giant, that sells products ranging from its original staple of
books to clothing, electronics, home and office furnishings, and jewelry, with thousands of other offerings
available. Amazon manufactures and sells its own electric devices as well, including products like Kindle,
Fire tablet and tv, Echo, and Ring. In addition, Amazon dominates cloud services providers with its own
Amazon Web Services (AWS). It is also a dominant force in streaming operations and media content, as well
as is expanding into the grocery industry with the acquisition of Whole Foods Market and expanding grocery
delivery services.
Positive Impacts from Last Period
Amazon has remained in prime positioning to continue to be one of the biggest benefactors of the shift
toward e-commerce retail by consumers. While the economic recovery continues to become more prevalent
in the U.S. behind increasing vaccinations, brick and mortar retail locations are poised to see increased
demand relative to 2020 figures as consumers return to malls and shopping centers to enjoy the ending of the
pandemic. However, the pandemic-laden year of 2020 ingrained an excitement for disruptive technologies
within consumers, giving way to continued future success for both the company’s e-commerce and AWS
segments. The company has also remained in favorable standing with ESG-minded investors, reemphasizing
its commitment to sustainability and climate change during the beginning of 2021, as ESG continues to
become a more important and frequently discussed topic.3
Negative Impacts from Last Period
In 1994, Jeff Bezos started Amazon.com as an online bookstore from his garage. After years spent building it
into the e-commerce juggernaut that it has become, he announced in early February that he would be
stepping down from his role as CEO in July ’21 to become executive chair of the board.4 While he will be
leaving the company in very capable hands, found in current Head of AWS Andy Jassy, his departure adds a
slight element of risk to Amazon’s future outlook. The possibility of an increased corporate tax rate as a part
of the Biden administration’s proposed infrastructure bill looms as a concern as well, as the company has
notably paid next to nothing in federal income tax. While Amazon is in as good of a position as any to
absorb an increase to the corporate tax rate, its bottom line will certainly be negatively impacted if the bill is
passed into law.
New Transactions
There were no transactions made involving AMZN during the P2 period.
Period 2 Performance
Start Value End Value Return Dividend Yield
$39,083.16 $37,128.96 -5.00% N/A
15NIKE (NKE)
Holdings Description
Nike Inc. designs and markets athletic apparel including footwear, clothing, fitness equipment, and accessory
products. Its products are sold worldwide through its own stores, retail locations and websites. Its products
are primarily focused on the sports of basketball, soccer, football, and running, but develops products for all
types of athletics. Outside of Nike-branded products, the company also sells apparel and footwear under the
brand Converse. Nike operates in the apparel and textile products and retail industries within the consumer
discretionary sector.
Positive Impacts from Last Period
Nike reported FY ’21 Q3 earnings ended February 28th in mid-March, which were highlighted by strong
NIKE Direct and digital sales growth figures, increased gross margin, and strong Greater China revenues.
The company saw its direct-to-consumer segment grow 20% during the quarter, while digital sales increased
by 59%. Greater China sales grew by more than 20% for the second consecutive quarter after falling during
the onset of the pandemic in early 2020. Despite supply chain constraints experienced during the P2 period,
the company notes that consumer demand for its products has continued to increase; 5 this positions Nike to
have strong brand momentum as it continues to establish exciting long-term growth opportunities through its
digital and direct platforms.
Negative Impacts from Last Period
In late March it was released that Nike, along with other similar brands, had found itself in a dispute with the
Chinese Communist Party for alleged comments that the country’s Xinjiang region used forced labor to
produce cotton.6 While the original article, published in the Communist Party’s ‘People’s Daily’ newsletter,
called for boycotts against the brand, they had a hard time gaining traction after the Chinese National Soccer
team said they were going to stick with Nike. Pressure has primarily come from supply chain congestion
issues, as Nike saw U.S. imports decrease by 39% during the Q3 period, resulting in “supply shortages
relative to continued strong marketplace demand,” as told by CFO Matt Friend. This resulted in roughly a
10% decline in domestic revenues. These bottlenecks have largely been due to global shipping container
shortages, port congestions, and general transportation delays. While these factors are largely out of the
company’s control, Nike has been able to adjust its operations to shorten product wait times, and expects
many of these bottlenecks to be resolved in the coming quarter.7
New Transactions
There were no transactions made involving NKE during the P2 period.
Period 2 Performance
Start Value End Value Return Dividend Yield
$9,337.02 $8,770.74 -6.06% 0.78%
16CONSUMER STAPLES
Manager: Will Davis
Sector Overview
Consumer staples is a non-cyclical sector that includes products considered essential to consumers, such as
food and beverage products, household and personal products, and tobacco. Given that there are not many
substitutes for the products found in this sector, consumers are presented with many different options, in the
forms of brands and product lines, to choose from when making selection decisions. The sector as a whole
does not fluctuate with the economy as the consumer discretionary sector does, in part due to the fact that the
products in the consumer staples category are in demand regardless of the economic cycle. During the last
three recessionary periods, where GDP growth was negative, the consumer staples sector outperformed the
S&P 500, as well as has outperformed all but one other sector since 1962.1 This lack of sensitivity to
macroeconomic factors and events helps the sector achieve relatively lower volatility compared to other
sectors, along with slower, more steady growth.
Recent Events
The efforts put forth by both public and private officials to ensure a successful economic recovery in the U.S.
has largely brought attention to more cyclical sectors within the economy. This has led to the consumer
staples sector underperforming relative to the S&P 500 for the duration of 2021 thus far.2 While this comes
as no surprise that the staples sector would underperform during a time of economic acceleration, the Carroll
Fund is confident in the growth trajectories of our respective staples holdings, as each has the appropriate
positioning to take advantage of increased discretionary spending by consumers. Domestic vaccination
progress, possible corporate tax rate hikes, and inflationary concerns will continue to be monitored by the
Carroll Fund as the economy continues to make a push towards a renewed sense of normalcy.
Performance
17THE COCA-COLA CO. (KO)
Holdings Description
The Coca-Cola company is a producer of non-alcoholic beverages, and has distinguished itself as one of the
world’s most recognizable brands in the process. The company offers a variety of product lines outside of the
typical soft drink selections, including bottled water, tea, and sports drinks. Coca-Cola operates within the
global beverages sub-industry of the consumer staples sector.
Positive Impacts from Last Period
As the economic reopening continues to progress on the backs of increasing vaccination rates, Coke is poised
to be one of the company’s found in the consumer staples sector that benefits the most. Roughly 50% of
Coke’s sales come from away-from-home sales, meaning that the full reopening of restaurants and
entertainment venues will help to give the company’s revenues a needed jump back up after falling over 10%
in 2020.3 The operational efficiency measures implemented by the company during the heights of the
pandemic and its subsequent resurgences will continue to aid Coke moving forward as well, allowing
management’s focus to once again return to the company long-term growth strategy, venue partnerships, and
event sponsorship.
Negative Impacts from Last Period
Coke has been involved in a lawsuit with the IRS since November ’18 over a case filed by the IRS alleging
Coca-Cola had allocated an inappropriate amount of company profits to its foreign subsidiaries in Brazil and
Ireland.4 Appeals and other legal tactics used by both parties have led to a decision being made on the case
being pushed back until Q3 ’21 at the earliest.5 In preparation for this, the company hired former federal
judge Michael Luttig in January to serve as a special advisor to the company on this case.
New Transactions
There were no transactions made involving KO during the P2 period.
Period 2 Performance
Start Value End Value Return Dividend Yield
$10,693.80 $10,278.45 -3.88% 3.08%
18PEPSICO (PEP)
Holdings Description
PepsiCo manufactures, markets, and sells a variety of carbonated and non-carbonated beverages, grain-based
snacks, and other food items around the world. The company offers familiar product lines such as Pepsi,
Mountain Dew, Tropicana, and Gatorade, as well as owns snack brands Frito Lay and Quaker Foods.
PepsiCo operates across several different industries relating to food and beverage products in the consumer
staples sector.
Positive Impacts from Last Period
PepsiCo is among the names of consumer staples companies poised to benefit from a return to normalcy and
increased discretionary spending. As consumers begin to return to restaurants, stadiums, and entertainment
venues, concessions full of sugary sodas will be reopening as well, once again tempting consumers to
indulge. Aside from the economic reopening, in late January, the company announced a joint venture with
plant-based protein icon Beyond Meat to develop, produce, and market new plant-based snack and beverage
products.6 PepsiCo’s portfolio diversification, primarily in its snack food offerings, continues to aid the
company’s long-term growth plan in offering healthier product selections to keep up with shifting consumer
trends.
Negative Impacts from Last Period
On February 17th PepsiCo announced that there would be a ‘dramatic slowdown’ in share buybacks to help
shore up the company’s finances.7 The company has also remained in hot water over a distribution
disagreement, having been in a lawsuit with Vital Pharmaceuticals since December. The suit was filed
against PepsiCo, claiming the company was acting with ‘gross misconduct’ while distributing Vital’s
popular Bang Energy drink. A nearly identical lawsuit was filed at the end of January by Quash Seltzer,
alleging the same claims against PepsiCo in regards to the distribution of its Mixx hard seltzer.8
New Transactions
There were no transactions made involving PEP during the P2 period.
Period 2 Performance
Start Value End Value Return Dividend Yield
$22,838.20 $21,783.30 -3.11% 2.87%
19WALMART (WMT)
Holdings Description
Walmart Inc. engages in retail and wholesale activities worldwide, and has become the largest company in
the world by doing so. The company operates through three segments: Walmart U.S., Walmart International,
and Sam's Club. It operates supercenters, supermarkets, and membership-only warehouse clubs to serve an
approximate 220 million U.S. customers each week. The company is also a heavy participant in the
e-commerce industry with walmart.com and samsclub.com, as well as the company’s membership
subscription service, Walmart+. The addition of this subscription service in November ‘20 has allowed the
company to excel in the online grocery pick-up and delivery space. The company offers grocery products,
household goods, and health and wellness products including pharmacy and clinical services, to name a few
of the available selections.
Positive Impacts from Last Period
After the launch of Walmart+ in Q4 2020, Walmart continued to diversify its portfolio in Q1 2021, putting
the company on a potentially exciting growth trajectory. In early March, it was released that Walmart was
hiring away Goldman Sachs’ head of consumer banking to help reignite the company’s desire to venture into
the financial services sector. In partnership with Ribbit Capital, Walmart will aim to drive revenue from a
segment outside its traditional retail focus by developing and offering affordable financial products for both
customers and employees. 9 The company’s continued dominance in the grocery industry, and the Walton
family’s eagerness to continue share buybacks, will continue to aid this holding well.
Negative Impacts from Last Period
In mid-February Walmart reported earnings, beating estimates on revenue and e-commerce sales, but
missing estimates for EPS by $0.11, or 8%. The company also announced an increase to employee wages
during the same time period, resulting in average employee pay moving above $15.00/hr to get ahead of a
potential federal minimum wage hike.10 Walmart saw its share price correct roughly 13% in the weeks
following the two announcements.
New Transactions
The Carroll Fund bought $10,040.90 worth of WMT at $127.10/share on March 5th, 2021.
Period 2 Performance
Start Value End Value Return Dividend Yield
$- $10,730.57 6.87% 1.55%
20ENERGY
Manager: Adam Hall
Sector Overview
Virtually all companies rely on electric power and fuel to conduct business; these products are produced by
companies found within the energy sector. However, with slumped demand, and a push towards working
away from nonrenewable resources, profits and growth are extremely uncertain for the overall sector in both
the short and long-term. With the current uncertainties in mind, we are actively searching for the companies
within the sector that will be able to capitalize from the impending economic recovery. We believe the best
opportunities will be in ‘exploration & production’ or ‘refining & marketing’ because of their innovation
potential and low relative valuations. The subsectors we are not looking to pursue include ‘equipment &
services’ and ‘storage & transportation’ because of the consolidation of their customer base and focus on
cost-saving initiatives aimed at prolonging company life.
Recent Events
The rally during the P2 period was largely due to OPEC+’s output cuts given its pessimistic outlook on oil
demand, stemming from stronger COVID-19 variants and new lockdowns. Since then, the organization has
switched gears and committed to gradually increasing output as the global economy improves. OPEC+’s
opinion on where the economy is going will continue to be one of the largest risks to the energy sector.
Domestically, stakeholders will be watching how the Biden administration attempts to update US power
infrastructure and its reliance on nonrenewable energy relationships with volatile oil-producing countries.
The current consensus among analysts is that President Biden will prioritize the overall economic recovery
over negative policies and actions toward the industry. According to McKinsey, oil demand is still expected
to climb into the 2030s1 and WTI crude oil prices are up approximately 18% YTD.
Performance
21FINANCIALS
Manager: Walker Hale
Sector Overview
Within the S&P 500, the financial sector is one of the largest sectors, operating through many industries such
as investment firms, retail banks, insurance, and real estate brokerages3. Interest rates have a big impact on
the overall performance of these industries, with some benefitting more so than others as a large portion of
revenues are generated from loans and mortgages in this sector3. For example, mortgage-focused firms
experience higher net income in a low-rate environment as it is more attractive to consumers. On the other
hand, big banks struggle as lower rates decrease margins on loans and make fixed income products less
attractive to investors. Companies within this sector are usually a good indicator of overall economic health,
as their performance is closely tied to loans made to consumers. This means that if firms, or people, are
expecting growth and investing in new projects, then banks will be conducting more business.
Recent Events
Equities continued to push higher to start the new year as vaccine distribution and fiscal stimulus exceeded
expectations. As the 10YR rallied an astonishing 83 bps in just Q1 alone1, a massive rotation occurred as
investors left growth for value, resulting in the largest outperformance in nearly 20 years1. This rotation
resulted in financials being one of the strongest performers during this period fueled by rising rates in the
10YR. Many investors see this rally of 83 bps as an indicator of inflation, possibly resulting in an increase to
rates from the Federal Reserve to combat an overheating economy. As we look into the quarter ahead, we
still believe that big banks can push higher as our economic recovery is stronger than ever. In addition,
during Q1 the fund decided to purchase Visa Inc. (V) to capitalize on pent-up consumer demand as the
reopening play continues to accelerate in the recovering economy. The fund has remained well aware of the
rate of both COVID-19 cases and vaccinations, as both have the ability to influence the continued recovery.
In addition to COVID-19 cases, Chairman Jerome Powell stated, throughout Q1, that the Fed is not worried
about inflation at these levels as they are transitory, and to raise rates would require inflation to stabilize
around 2% and the economy to reach full employment. He does not believe that this will happen this
year2. If this is the case, however, financials could take a breather, as hopes of rising rates to combat inflation
will no longer be the case. With that in mind, the fund has chosen to be overweight financials as we have an
optimistic outlook for the U.S. domestic economy.
Performance
22BLACKROCK, INC. (BLK)
Holdings Description
BlackRock is the worlds’ largest investment management firm with nearly $8.68 trillion in assets under
management as of December 31st, 20207. Blackrock offers consumers a wide range of investment
opportunities and products such as equity funds, money market instruments, and fixed income8. With the
various investment vehicles offered by BlackRock, the company is able to attract a wide range of investors,
from those looking for retirement income, a college savings plans, or even a basic ETF9.
Positive Impacts from Last Period
While equity markets soared to new highs in the first quarter due to bettering economic and COVID-19
conditions, investors piled money into ETFs, shattering inflow records across the board. In Q1 alone, ETFs
across the U.S. experienced an increase in new inflows totaling $245.40 billion, the largest sum ever
recorded in a single quarter10. With this number more than triple the amount we saw last year, estimates for
the 2021 calendar year are around $1 trillion if inflows remain this strong11. At this rate, 2021 inflows would
more than double the previous annual record set in 2017 of $476.10 billion12, signaling great roads ahead for
BlackRock. With nearly 40% worldwide market share13 and the iShares business segment accounting for 1/3
of revenue14, BlackRock is poised to benefit from a growing investment space; one of which Analysts from
Bank of America expect to reach $50 trillion globally by 203015. While demand for ETFs is growing rapidly,
investors are not shying away from ESG approached investing strategies either. With ESG asset investment
criteria growing to roughly 33% of all $51 trillion assets invested in the U.S.16, BlackRock has strongly
committed to this shift. The company has already begun to invest in companies that are making the big
transition to net zero emissions by 205017. Overall, the future potential for the world’s largest AUM firm is
bright as it leads the way in both ETF and ESG investing, two areas with increased investor demand.
Negative Impacts from Last Period
Many investors were expecting a continuance of the dollar weakening into 2021, as fiscal policy remained
strong with new stimulus and increasing public debt, however, that was not the case. The ICE U.S. Dollar
Index, DXY, which measures the U.S. dollar against six other major currencies, appreciated just over 3% to
finish out the quarter18. If we continue to see the U.S. dollar appreciate, the margins BlackRock receives
from fees will continue to react positively, a number that has been under pressure over the past few years19.
Also, fierce competition with growing technological advancements in a heavy regulated industry are always
in the spotlight within financials. BlackRock will need to continue to place themselves in the right place
moving forward to avoid any possible legal scrutiny.
New Transactions
There were no transactions made involving BLK during the P2 period.
Period 2 Performance
Start Value End Value Return Dividend Yield
$15,873.88 $16,587.12 5.07% 1.84%
23GLOBAL X FINTECH ETF (FINX)
Holdings Description
The Global X FinTech ETF is an exchange-traded fund in which roughly 80% of its total assets are invested
into securities found within the Indxx Global Fintech Thematic Index. By doing so, the ETF has the intention
to provide investors with returns similar to that of the underlying index20. The underlying index gives
exposure to developed markets that focus on different financial technology products and analytics software,
alternative currencies, and companies that are focused on peer-to-peer and marketplace lending21.
Positive Impacts from Last Period
While FINX lagged the broader market in the first quarter of 2021, the growth prospects of the holdings, and
the fintech space in general, remain appealing. Square Inc. (SQ), the largest holding in FINX, released some
very strong numbers when they reported earnings on February 23rd. The company saw YoY gross profit and
net revenue increase 52% and 141%22, respectively. In addition to this growth, SQ experienced great
expansion within their mobile payment platform, Cash App, with YoY growth of 162% in gross profit23.
PayPal Holdings Inc. (PYPL), another top holding within FINX, reported great earnings on February 3rd,
posting YoY revenue and EPS growth of 23% and 208%24, respectively. In addition, PYPL added 16 million
net new accounts in the quarter alone, with expectations of roughly 50 million to be added throughout
FY’2125. As seen by quarterly reports of two of the top holdings within FINX, the fintech space is growing
rapidly with rising consumer demand. The fund believes the broad exposure of the ETF is a good way to
capture the future growth prospects of the industry, as it remains unbounded as digital wallets and payment
platforms are expanding with the growth of cryptocurrency globally.
Negative Impacts from Last Period
As the 10YR rate surged higher in the first quarter, many investors began to fear rising inflation, something
that is not good news for high growth stocks. With that being said, many of the top holdings within FINX
were trimmed from investors’ portfolios as these fears became stronger. As we move into the second quarter,
inflation and interest rates will continue to be factors for investors, as well as innovation from top companies
to penetrate further into the fintech space. The respective company’s abilities to remain compliant and up to
date with both the domestic and global regulations remain in the spotlight as well26.
New Transactions
The Carroll Fund sold $13,444.99 worth of FINX at $43.80/share on March 26th, 2021.
Period 2 Performance
Start Value End Value Return Dividend Yield
$21,720.15 $6,972.54 -6.00% N/A
24JPMORGAN CHASE & CO. (JPM)
Holdings Description
Conducting business globally, JPMorgan Chase & Co. operates in four primary divisions, including
consumer and community banking, corporate and investment banking, institutional banking, and
management of assets and wealth27. S&P global ranks JPM seventh largest in the world, falling behind
institutions serving the continents of Asia and Europe28.
Positive Impacts from Last Period
While the S&P 500 made 16 new all-time highs throughout the first quarter, the financial sector was a leader
and JPM was one of top performers returning just shy of 20% in the quarter alone. The push higher was
made as many equity investors rotated out of big growth names into more cyclical and value plays as the
10YR jumped, possibly signaling inflation in the near future as our economy continues to push forward. In
addition, many investors are still looking to the future as the Federal Reserve announced in late March that
share buybacks and normal distribution of dividend payouts can resume on June 30th, contingent on passing
the stress test29. With a very strong balance sheet that allows for safe deployment of capital, the fund believes
that passing the stress test will be no problem for JPM. With that being said, it is just a matter of time for the
trigger to be pulled on a $30bn share buyback plan that has already been authorized by the Board of
Directors30 allowing for a great deal of capital to be returned to shareholders. Lastly, the bank announced in
late January that it plans to expand to the U.K. where it looks to build a retail banking presence; however, the
approach is a little different. Instead of the usual brick-and-mortar, JPM looks to reach its customers via a
mobile app checking account. A “range of products” is likely to follow, including credit cards or home
loans31. Coming off a very strong first quarter, JPM could continue to the upside as our economy continues
to recover, share buybacks will allow for shareholder value to increase and global retail presence looks to
expand to the U.K.
Negative Impacts from Last Period
During the first quarter the Federal Reserve announced the ending of the Emergency Capital Relief, a
reprieve that was put in place when COVID-19 first hit to help banks battle the pandemic. The relief allowed
banks to exclude treasuries and deposits at the central bank from the lenders leverage ratio32. With this
temporary exclusion ending, JPM will now have more assets to account for, such as treasuries and deposits,
and this will force banks to either hold more capital or reduce the holdings of current assets33. While this
outcome is not ideal nor disastrous, this temporary relief did allow JPM to have their leverage ratio boosted
by 110bps34. In addition, the operation of the consumer & community banking branch could continue to
struggle as the low-rate environment decreases net interest margins and income.
New Transactions
The Carroll Fund sold $6,623.46 worth of JPM at $154.04/share on March 26th, 2021.
Period 2 Performance
Start Value End Value Return Dividend Yield
$16,773.24 $13,548.47 20.97% 2.37%
25S&P GLOBAL INC. (SPGI)
Holdings Description
Together with its subsidiaries, S&P Global Inc. works to provide a wide variety of services for the capital
and commodity markets worldwide, such as credit ratings, indices, analytics and data. Via these four primary
business divisions, the organization operates: S&P Global Ratings, S&P Global Market Intelligence, S&P
Global Platts and S&P Dow Jones Indices35.
Positive Impacts from Last Period
S&P Global was able to push higher in the first quarter, yielding over 7% to its investors as they were able to
beat Q4 earnings and offer good guidance for 2021 when they reported on February 9th. SPGI was able to
deliver quarterly earnings of $2.71, surpassing analyst expectations by 6.27% and posting their fourth
straight quarter of beating the streets EPS consensus36. Within their business segments, we saw YoY growth
of 4% for Ratings, 6% in Market Intelligence, 11% in the Indices platform, and 5% for Platts37. In addition,
management is very confident in their new AI integrated risk casting index, which tracks daily derivatives
from the S&P 500 giving insight to overall investor sentiment and overall market conditions which then
returns favorable allocation to equities and bonds38. While SPGI beat top line and EPS estimates in Q42020,
2021 could continue to be prosperous for SPGI as their indices segment continues to grow and the solid base
business continues to launch new products and be the leader in multiple markets.
Negative Impacts from Last Period
While unknown regulation changes within the credit ratings industry still remain in the spotlight throughout
2021, potential for increased expenditures for international expansion could pose an issue for earnings into
the future as well39. Additionally, with results almost unanimous in favor of the HIS Markit acquisition in
Q1, it is possible that problems could arise in the future as roughly 70 percent to 90 percent of M&A’s fail as
problems usually arise in “strategic planning, stakeholder engagement and third-party mediation, and
company-wide engagement40. Lastly, while post pandemic debt issuance levels continue to remain unknown,
this could result in a decrease of revenue if we do see a decline in overall issuance levels.
New Transactions
There were no transactions made involving SPGI during the P2 period.
Period 2 Performance
Start Value End Value Return Dividend Yield
$17,751.42 $19,054.98 7.58% 0.74%
26VISA INC. (V)
Holdings Description
Visa Inc. is a financial services firm that provides payment processing globally, operating in more than 200
countries and territories41. The company helps facilitate transactions between financial institutions,
consumers, merchants, and banks42. The firm reports as a single element business, but divides revenue into
the following segments: Data Processing Revenue, Service Revenue, International Transaction Revenue, and
Other Revenue23.
Positive Impacts from Last Period
Visa’s quarterly earnings were released on January 28th and they did not disappoint. The street expected EPS
drop of 13% to $1.27 per share, while reports signaled a nice beat of 11.80% coming in with $1.42 per share
with revenue of $5.69B, beating estimates by nearly 3.50%43. Visa saw service revenue and data processing
revenue grow 5% and 6%44, respectively. On the other hand, international transaction revenue did fall 28%45
as much international travel and spending remained dampened due to international COVID-19 restrictions.
As fiscal policy remained strong throughout the first quarter and lockdowns were lifted, many Americans got
out and spent more as personal income and spending numbers were better than expected for most of the
quarter46. In relation to Visa this is good news as they hold the largest market share of all competitors, and
with higher consumer transaction and payment volume comes higher revenues. Additionally, in late January
Visa announced a global partnership with TransferWire, a company that will help expand their Visa Cloud
Connect program47. This program allows the connection between fintech’s and other partners to VisaNet,
their global processing network48. As the fund remains optimistic on the global economic recovery, we
believe Visa will capture exposure to growth in consumer spending and demand, along with expansion into
the rapidly increasing fintech space.
Negative Impacts from Last Period
In mid-March, an antitrust investigation was launched by the Department of Justice in regard to Visa
possibly using anticompetitive practices to keep dominance in the industry49. The investigation is focused on
whether Visa is not allowing merchants to route transactions over a less expensive card network to decrease
network fees, an invisible cost to consumers that weighs on merchants profitability50. The stock did not react
well to the news, dropping more than 6%, presenting a good buying window for the fund. As a team, we do
not believe this will cause further problems for Visa as they have successfully operated in a highly regulated
industry for multiple decades and have already spoke on the subject and remain cooperative with the DOJ. In
addition to the lawsuit and operating in a highly regulated industry, Visa’s business model relies heavily on
consumer spending, and if COVID-19 variants continue to spread, our economy could see a slight
contraction resulting in lower revenues for Visa.
New Transactions
The Carroll Fund bought $20,122.27 worth of V at $209.50/share on March 26th, 2021.
Period 2 Performance
Start Value End Value Return Dividend Yield
$- $20,326.08 1.11% 0.55%
27HEALTHCARE
Manager: Will Lewis
Sector Overview
Healthcare is one of the largest and fastest-growing sectors. The firms in this sector provide services and
products that are related to the medical and health fields. The Carroll Fund’s holdings include AMGN,
AMN, ARKG, CVS, JNJ, & MRK. We see technological advancement as a major opportunity in the
healthcare sector. Digital transformation, artificial intelligence, and “telehealth” are all examples of new
innovations and potential disruptors in the sector. Big data and analytics are also becoming increasingly
useful in the healthcare world and are growing in popularity. The fund is fascinated by the idea of being able
to predict a patient’s needs before the patient even recognizes them, and we believe there is great opportunity
in the tech-health space in the coming years.
Recent Events
At the center of attention, while the world health crisis continues, the healthcare sector remains a great focus
of our government and leaders. Over the last quarter, vaccinations have become increasingly available both
domestically and globally, which should continue to propel society back to a certain level of normalcy. The
JNJ single-dose vaccine was paused recently after extremely rare blood clots formed in a series of patients
within weeks of receiving the vaccine. A report recently released by Foley & Lardner LLP found that the
pandemic has led state and federal lawmakers to remove certain restrictions and increase reimbursement for
telehealth at higher-than-average rates.1
Performance
28AMGEN (AMGN)
Holdings Description
AMGN is a biotechnology company that has been serving the world since 1980. Located across the globe,
the company focuses on developing medicines for illnesses that are not easily treatable. The company’s line
of products is surprisingly small, approximately twenty, but Amgen has done a remarkable job of selling and
distributing these products. Cancer-fighting drugs, such as Neulasta and Vectibix, are some of the company’s
top-selling products. These products are expensive but can provide necessary treatment that make them
worth the lofty costs. Amgen’s products are mainly sold to hospitals and different groups within the medical
field.
Positive Impacts from Last Period
The company’s smaller product line does not account for the numerous medicines being tested behind the
scenes, many with great potential in the coming years. As older products are phased out of offering, the
company has worked to make the transition seamless. Particularly exciting is the work being done on an anti-
cancer treatment, AMG 510. The company is also taking steps to address a lack of treatment for immune
system diseases. On March 30, Amgen announced the acquisition of Rodeo Therapeutics, a private company
specializing in small-molecule therapies.
Negative Impacts from Last Period
Some of Amgen’s patents are set to expire over the course of the next several years. However, the company
has fully taken this into consideration and has developed new products to buffer expiring patent products.
Concerns about the company’s level of debt have circulated but it appears that Amgen can comfortably
handle these levels, in particular because of its strong cash flows.
New Transactions
The Carroll Fund sold $1,710.13 worth of AMGN at $244.31/share on March 19th, 2021.
Period 2 Performance
Start Value End Value Return Dividend Yield
$14,484.96 $13,933.36 8.76% 2.57%
29You can also read