RoboCOP: A Robotic Coach for Oral Presentations - Microsoft
←
→
Page content transcription
If your browser does not render page correctly, please read the page content below
RoboCOP: A Robotic Coach for Oral Presentations
H. TRINH, Northeastern University
R. ASADI, Northeastern University
D. EDGE, Microsoft Research
T. BICKMORE, Northeastern University
Rehearsing in front of a live audience is invaluable when preparing for important presentations. However, not all
presenters take the opportunity to engage in such rehearsal, due to time constraints, availability of listeners who can
provide constructive feedback, or public speaking anxiety. We present RoboCOP, an automated anthropomorphic robot
head that acts as a coach to provide spoken feedback during presentation rehearsals at both the individual slide and
overall presentation level. The robot offers conversational coaching on three key aspects of presentations: speech quality,
content coverage, and audience orientation. The design of the feedback strategies was informed by findings from an
exploratory study with academic professionals who were experienced in mentoring students on their presentations. In a
within-subjects study comparing RoboCOP to visual feedback and spoken feedback without a robot, the robotic coach was
shown to lead to significant improvement in the overall experience of presenters. Results of a second within-subjects
evaluation study comparing RoboCOP with existing rehearsal practices show that our system creates a natural, interactive,
and motivating rehearsal environment that leads to improved presentation quality.
CCS Concepts: • Human-centered computing → Ubiquitous and mobile computing systems and tools
General Terms: Design, Human Factors, Measurement
Additional Key Words and Phrases: Presentation rehearsal, robot, coaching, feedback
ACM Reference format:
Ha Trinh, Reza Asadi, Darren Edge, and Timothy W. Bickmore. 2017. RoboCOP: A Robotic Coach for Oral Presentations.
PACM Interact. Mob. Wearable Ubiquitous Technol. 1, 2, Article 27 (June 2017), 24 pages.
DOI: http://doi.org/10.1145/3090092
1 INTRODUCTION
Rehearsals are the cornerstones of polished oral presentations. “Dry runs” and “practice talks” are standard
procedure for any important presentations, but the higher the stakes, the more rehearsal is required. TED
recommends that speakers take “weeks or months to memorize their talks and rehearse”. Executives often
engage private speaking coaches to help them prepare and provide feedback during rehearsals for important
presentations. However, rehearsal is important for any oral presentation, including anticipated “impromptu”
talks, to determine timing, delivery, content coverage and transitions, and to internalize key points so that
This work is supported in part by the National Science Foundation under award IIS-1514490.
Author’s addresses: H. Trinh, Northeastern University, 177 Huntington Avenue, 02115, Boston, MA, USA; R. Asadi, Northeastern
University, 177 Huntington Avenue, 02115, Boston, MA, USA; D. Edge, Microsoft Research, 21 Station Road, CB1 2FB, Cambridge, UK; T.
W. Bickmore, Northeastern University, 177 Huntington Avenue, 02115, Boston, MA, USA.
Permission to make digital or hard copies of all or part of this work for personal or classroom use is granted without fee provided that
copies are not made or distributed for profit or commercial advantage and that copies bear this notice and the full citation on the first
page. Copyrights for components of this work owned by others than the author(s) must be honored. Abstracting with credit is permitted. 27
To copy otherwise, or republish, to post on servers or to redistribute to lists, requires prior specific permission and/or a fee. Request
permissions from permissions@acm.org.
© 2017 Copyright is held by the owner/author(s). Publication rights licensed to ACM. 2474-9567/2017/6 – ART27 $15.00
DOI: http://doi.org/10.1145/3090092
PACM Interact. Mob. Wearable Ubiquitous Technol., Vol. 1, No. 2, Article 27. Publication date: June 2017.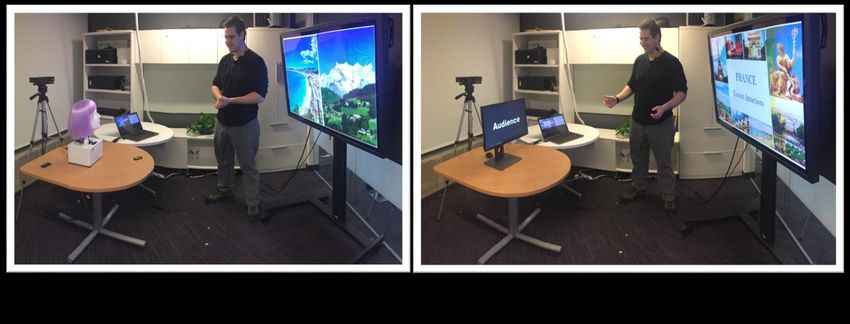
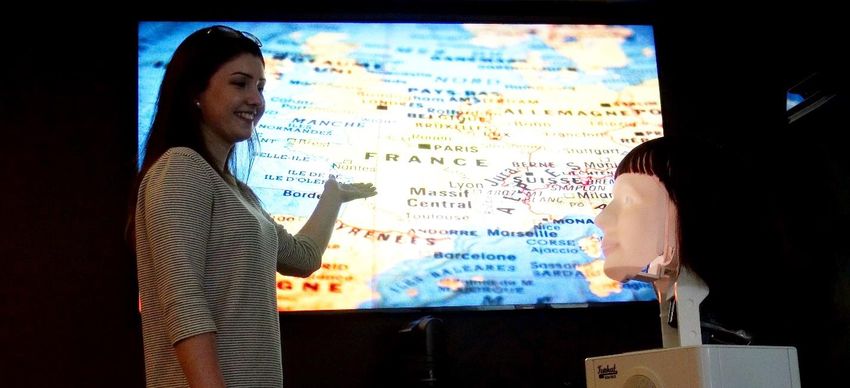
27:2 • H. Trinh et al.

                                   Fig. 1. Presenter rehearsing her talk in front of the robotic coach

strict note-reading is unnecessary. Rehearsal in front of a live audience—even if it is only a single person—can
also serve to lower speaker anxiety during the actual presentation.
   Unfortunately, many presenters do not rehearse their talks. One survey of 2,501 professionals found that
only 45% said they “always” or “usually” rehearse for presentations, and 35% said they “rarely” or “never”
rehearse [19]. Reasons for lack of rehearsal can include lack of preparation time, public speaking anxiety
(affecting up to 35% of the population [7]), lack of a practice venue, unavailability of an audience, coach, or
knowledgeable individual to give good feedback, or unawareness of the importance of rehearsal. Although
private speaking coaches are available for hire, their cost is typically prohibitive for most people.
   To support public speaking training, a number of interactive systems have been developed to provide
automated feedback on the presenter’s verbal and non-verbal behaviors (e.g., [10, 12, 27, 32, 54, 55]). Although
these existing systems often improve the presenter’s learning experience, there is little evidence that they can
actually lead to observable improvements in presentation quality when judged by human audiences.
   In this work we present RoboCOP, an integrated rehearsal environment, in which presenters rehearse their
talks in front of an automated speaking coach, which acts as both an audience and an empathetic expert coach
that provides spoken feedback on multiple facets of presentation delivery. In order to provide the greatest
audience realism through “sense of presence”, and to give the speaker a focal point for his or her rehearsal
without the clumsiness of a head-mounted display, we use an anthropomorphic robotic head as an
embodiment for the rehearsal coach. The coach is able to identify a range of speaker behaviors automatically,
including speech quality, content coverage, and head orientation behavior, and provides feedback in a natural
conversational manner.
   In the rest of this paper, we review related work in automated rehearsal support systems and human-robot
interaction, and discuss an exploratory study of human rehearsal coaches that informed the design of our
system. We then describe the design and implementation of the RoboCOP system, and a comparative study
assessing the feedback strategy employed by the robotic coach versus visual feedback and spoken feedback
without robot. We also report on an evaluation study in which presenters rehearsed with and without the
automated robotic coach and had their resulting presentations rated by a panel of human judges. Our
contributions include:

PACM Interact. Mob. Wearable Ubiquitous Technol., Vol. 1, No. 2, Article 27. Publication date: June 2017.
RoboCOP: A Robotic Coach for Oral Presentations • 27:3

      1.   Identification of common feedback categories provided by presentation coaches during rehearsal;
      2.   Development of the RoboCOP rehearsal support system, in which a robot plays the role of both an
           attentive audience and a coach that offers detailed spoken feedback on important aspects of
           presentations;
      3.   Comparison of three different feedback modalities (RoboCOP vs. spoken feedback without robot vs.
           visual feedback), which demonstrates the potential of RoboCOP to improve the overall experience of
           presenters;
      4.   Validation of RoboCOP in a comparative study that demonstrates its potential to improve both the
           presenter’s rehearsal experience and presentation quality as perceived by an audience.

2 RELATED WORK

2.1 Rehearsal and Presentation Quality
Previous research has investigated the effects of different rehearsal activities on presentation performance [36,
40]. In a study with 119 students, rehearsal for an audience was found to be a significant predictor of the
quality of speech delivery, as it enables the speaker to more fully develop their perspective-taking and
audience-analysis skills than in solo rehearsal [36]. In the same study, quality of presentation content was also
found to positively correlate with number of spoken rehearsals. Despite the demonstrated positive impact of
spoken rehearsals on presentation quality, many presenters spend little to no preparation time on these
activities [19]. High public speaking anxiety has been reported as a key contributing factor to avoidance of
rehearsal [5]. To treat public speaking anxiety, previous studies have explored the use of virtual audiences for
exposure therapy [2, 44]. In a study with 40 students, Pertaub et al. [44] showed that virtual audiences could
induce social anxiety, and the degree of anxiety was directly related to the type of virtual audience feedback.
This indicates the potential of virtual audiences as a viable platform for public speaking training.

2.2    Rehearsal Support Systems and Feedback Strategies
Recent research has addressed the need for more effective approaches to presentation rehearsal. Trinh et al.
[56] developed the PitchPerfect system, which provides an integrated rehearsal environment with a range of
targeted rehearsal tools for structured presentation preparation. In a study with 12 participants, the system
was found to significantly improve overall presentation quality compared to existing rehearsal practices.
    Several public speaking training platforms have also been developed that provide feedback on different
aspects of presentation delivery, from speech quality to speaker body language. Kurihara et al. [27] developed
the Presentation Sensei system, which provides graph-based visual feedback on the presenter’s speaking rate,
eye contact, filler rate and timing. Tanveer et al. [55] designed the AutoManner system, which offers visual
feedback on the speaker’s body movements. Lui et al. [32] developed a mobile application that displays
feedback on body motion, voice intensity and timing. Schneider et al. [50] developed the Presentation Trainer
system, which generates both visual and haptic feedback on the speaker’s voice intensity, use of pauses and
fillers, body posture and hand gestures. Similarly, the AwareMe system [10] measures voice pitch, filler words,
and speaking rate during presentation rehearsal and provides visual and haptic feedback through a wristband
device. The Rhema system [54] and the Logue system [13] provide visual feedback on the speaker’s verbal and
nonverbal behaviors using Google Glass.
    Previous studies have also explored the use of virtual agents to facilitate practice of communication skills.
Chollet et al. [12] developed Cicero, a virtual audience platform for public speaking training. The virtual
audience is capable of displaying indirect, nonverbal feedback to signal increased attention, cues of rapport,
lack of interest, or disagreement in response to sensed speaker behaviors. Although not designed for public
speaking, Hoque et al. [22] developed a related system to provide automated job interview training. The
MACH system uses a highly realistic animated virtual job interview coach to offer real-time visual feedback

                            PACM Interact. Mob. Wearable Ubiquitous Technol., Vol. 1, No. 2, Article 27. Publication date: June 2017.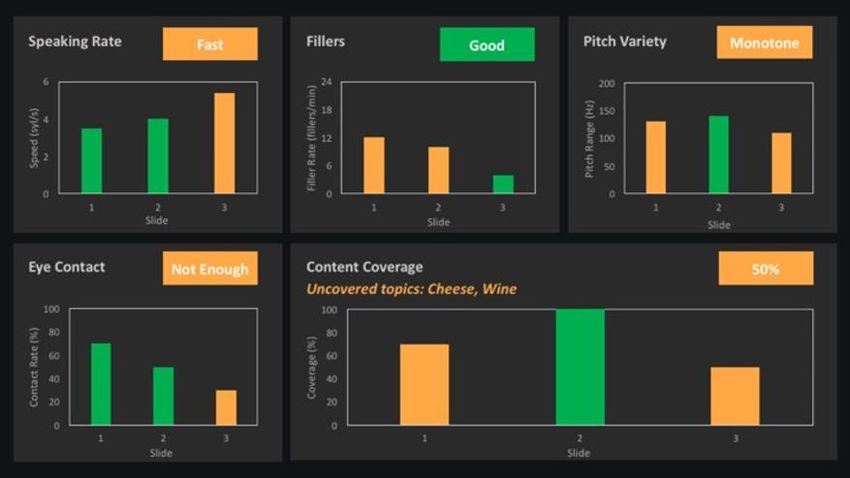
27:4 • H. Trinh et al.

on various verbal and nonverbal behaviors of human interviewees, including speech, prosody and facial
expressions.
   To our knowledge, there have been no studies to date that investigate the use of robots to provide
interactive coaching and feedback during presentation rehearsal.

2.3    Feedback Strategies and Presentation Quality
Evaluation results of most existing public speaking training systems often show the effects of automated
feedback on increasing user engagement and improving learners’ experience (e.g. [13, 50, 54, 55]). However,
prior work shows little evidence that automated feedback during presentation training can result in increased
presentation quality as perceived by human audiences. Most prior systems either did not evaluate the
audience perception of speaker performance (e.g. Presentation Trainer [50], AutoManner [55], Presentation
Sensei [27]), or reported no significant effects (e.g. Rhema [54], Cicero [12], Logue [13]). More specifically,
evaluations of the Rhema system showed no significant differences in performance between the visual
feedback and no-feedback conditions, as rated by Mechanical Turk workers [54]. Evaluations of the Cicero
virtual audience framework also showed no significant differences in performance between the interactive
virtual audience and no-feedback conditions, as judged by experts [12]. Interestingly, results of the same study
showed that the virtual audience and no-feedback conditions both led to significantly better expert ratings
than the direct visual feedback condition. The only exception is the MACH system [22], which reported
significant improvements in job interview performance after a week-long trial. However, job interviewing is a
significantly different problem than oral presentations. Thus, it is still an open question as to whether
providing feedback during brief rehearsal sessions could translate into observable improvements in
presentation quality.

2.4 Human-Robot Interaction
There have been many studies conducted on human perceptions of and attitudes towards anthropomorphic
robots, and more specifically in their use as tutors or coaches. Several studies have demonstrated the positive
impact of physical embodiment on “sense of presence” compared to equivalent screen-based animated robots
or live video feeds of remote robots. Most of these studies have demonstrated user preference for co-located
physical robots over animated characters and remote robots, as well as higher ratings of satisfaction,
enjoyment, engagement, and trust [22, 25, 29, 38, 43, 45, 46, 57].
   Robots have also been used as tutors, mostly for children. Previous studies have demonstrated
improvements in student motivation, concentration, engagement, and learning with a robot compared to more
conventional instructional media or human tutors [20, 31, 51]. Studies have also shown that when pedagogical
or coaching robots exhibit ideal social and supportive behaviors, such as positive feedback, they are also more
effective at improving student motivation, learning, and compliance with the robot’s requests [16, 49].
Together, this work implies that a robotic rehearsal coach—especially one that uses social and supportive
behaviors—could be more effective than an animated coach or other media.
   Research has also indicated that the physical presence of robots can lead to more intense social responses—
such as social desirability bias—compared to other media [26, 45]. This may indicate that presenters who
suffer from public speaking anxiety may experience even greater anxiety when rehearsing in front of a robotic
coach compared to a screen-based animated coach or a non-anthropomorphic interface.

3 UNDERSTANDING REHEARSAL COACHING PRACTICE
To motivate and inform the design of our rehearsal coaching system, we conducted an exploratory study to
understand the practices of presentation coaching. Our aim was to identify the categories, structure, language
and frequency of feedback offered by human coaches during presentation rehearsal.

3.1 Participants
PACM Interact. Mob. Wearable Ubiquitous Technol., Vol. 1, No. 2, Article 27. Publication date: June 2017.
RoboCOP: A Robotic Coach for Oral Presentations • 27:5

We recruited 8 professors (5 male, 3 female) from the health science, computer science, music and theatre
departments at our university. All participants were experienced in either teaching public speaking classes or
mentoring students on their oral presentations.

3.2 Procedure
Each study session lasted approximately 1 hour, in which participants were asked to give coaching feedback
during presentation rehearsals. Each rehearsal was 7-10 minutes long on general knowledge topics (France,
Italy, Lions and Tigers), and was either pre-recorded or a live rehearsal. The recorded rehearsals were
randomly selected from a pool of 24 videotaped rehearsals of 12 students and professionals with varying levels
of presentation experience, collected from our prior studies on presentation technologies. In those studies,
participants were given 30-60 minutes to review pre-made slides and notes before delivering their talk in front
of a camera. The live rehearsals were given by research assistants in our lab, who were given the presentation
materials five days in advance and were instructed to prepare in any ways they wanted before practicing their
talk with a coach. To mitigate learning effects, each assistant only performed two rehearsals.
   In each study session, we asked coach participants to watch two different rehearsals from different
speakers, who were unknown to them. The first rehearsal was an early-stage rehearsal, during which
participants were asked to give preliminary feedback on how to improve the speaker’s performance. They
were instructed to interrupt the speaker at any time during the rehearsal, and give any verbal feedback that
they thought would be useful. The second rehearsal was a complete dry-run, for which we asked participants
to wait until the end of the presentation and give all of their summative feedback for the entire talk.
   Prior to each rehearsal, we explained the goal and the target audience of the presentation to participants,
and gave them a handout of the slides and notes specifying the key points that should be covered in the talk.
In the case of videotaped rehearsals, we asked participants to imagine that the speaker was present in the
room and to speak their feedback directly to the speaker.

3.3 Findings

                                Table 1. Common Feedback Categories and Their Frequency

                Category                                               Frequency (%)
                Talk Planning, Organization and Design                 44.6
                  Goal & Audience Benefits                             19.9
                  Organization                                         6.6
                  Introduction & Close                                 8.3
                  Slide Design                                         9.9
                Speech Quality                                         31.5
                  Language / Pronunciation                             11.6
                  Speaking Rate                                        8.3
                  Filler Rate                                          7.5
                  Pitch Variety                                        4.1
                Nonverbal Behavior                                     19.8
                  Body Language                                        9.9
                  Eye Contact                                          9.9
                Content Coverage                                       4.1

                           PACM Interact. Mob. Wearable Ubiquitous Technol., Vol. 1, No. 2, Article 27. Publication date: June 2017.
27:6 • H. Trinh et al.
We recorded and transcribed all participants’ coaching feedback, resulting in a total of 78 early-stage feedback
samples and 8 dry-run feedback samples. During early-stage rehearsals, each coach gave an average of 1.6
feedback samples per slide (SD = 1.2). Most of the early-stage feedback occurred at the end of a slide. Coaches
often gave highly detailed feedback (mean length of early-stage feedback = 103.7 words, mean length of dry-
run feedback = 385.7 words), which comprised descriptions of the speaker’s performance, actionable
suggestions with explanatory justification, and positive reinforcement. Feedback messages were often
structured using the “feedback sandwich” technique [15], starting with positive messages before proceeding to
suggestions for improvement.
To identify feedback categories, we annotated each feedback sample with a category code. Table 1 shows
the 11 common feedback categories grouped into four main themes, along with their frequencies of
occurrence in our feedback corpus. The experts provided feedback on a wide range of topics, spanning talk
planning, organization and slide design (44.6% of comments), content coverage (4.1%), body language and eye
contact (19.8%), and speech quality (31.5%), with the last category further broken down into language and
pronunciation (11.6%), speaking rate (8.3%), use of “fillers”, such as “umms” and “ahs” (7.5%), and voice pitch
variety (4.1%). When the specific phrasing of expert feedback was particularly clear and helpful, we noted
these phrases as candidates for inclusion in an automated rehearsal coach.
4 DESIGN OF ROBOCOP
Informed by findings from our exploratory study, we developed RoboCOP (Robotic Coach for Oral
Presentations), an automated anthropomorphic robot head for presentation rehearsal. The robot plays the role
of a coach who actively listens to the presenter’s spoken rehearsals and offers detailed spoken feedback on
five key aspects of presentations: content coverage, speaking rate, filler rate, pitch variety, and audience
orientation (which is considered a proxy for eye contact). These metrics were chosen based on our exploratory
study and previous automatic presentation quality assessment studies [6, 22]. In addition, the coach also
provides high-level advice on the presentation goal and audience benefits, as well as talk organization,
introduction and close. Our aim was to simulate the interactive nature and feedback mechanisms of
rehearsing in front of a live audience, while mitigating public speaking anxiety that often arises when
performing with actual human audiences. Unlike existing virtual audience-based rehearsal systems that
provide indirect feedback through non-verbal behavior, our robot provides detailed, structured, actionable and
empathetic feedback that resembles the behavior of human coaches. We now present an overview of the
presentation preparation process with RoboCOP, followed by descriptions of its core components.
4.1 Presentation Preparation with RoboCOP
Prior to spoken rehearsals, RoboCOP enables the presenter to prepare speaking notes for each slide using our
topic-based note authoring interface (Fig. 2a). Implemented as an add-in for Microsoft PowerPoint 2016, our
note authoring tool allows the presenter to segment the speaking notes of each slide into a series of key
topics. The presenter can enter a short title for each topic, along with detailed notes specifying what they
intend to say about it. During rehearsal, our system tracks the presenter’s speech to determine which topics
have been covered on each slide, and provides feedback on content coverage accordingly.
Once the presenter is ready for the first spoken rehearsal, he/she activates the Slide Walkthrough mode by
clicking on the corresponding control in the PowerPoint ribbon. In this mode, the presenter practices
verbalizing slides while receiving preliminary feedback from the robotic coach at the end of each slide. At the
beginning of this mode, the coach engages presenters in a short introductory dialogue before proceeding to
the rehearsal. This simple dialogue serves three purposes: (1) establishing the role of the robot; (2)
familiarizing the presenters with the concept of talking to and receiving feedback from the robot; (3)
prompting them to keep in mind the overarching goal of their presentation and their target audience while
presenting. In this interaction, user input is limited to acknowledgment utterances that only serve to advance
the dialogue.
PACM Interact. Mob. Wearable Ubiquitous Technol., Vol. 1, No. 2, Article 27. Publication date: June 2017.RoboCOP: A Robotic Coach for Oral Presentations • 27:7
Fig. 2. RoboCOP Microsoft PowerPoint add-in with (a) note authoring pane and (b) presenter view
To facilitate the rehearsal, we provide the Presenter View, which displays all topic notes of a slide on a
single note page, along with the slide and timing information (Fig. 2b). During the rehearsal, the coach acts as
an attentive audience and offers verbal feedback at the end of each slide on five key presentation quality
metrics: content coverage, speaking rate, filler rate, pitch variety and audience orientation.
Once the presenters master each individual slide with the Slide Walkthrough mode, they can proceed to the
Dry Run mode to perform a complete practice talk from beginning to end, without interruption from the
coach. At the beginning of this mode, the coach also engages the presenters in an introductory dialogue,
reminding them to pay special attention to verbal transitions between slides and the presentation timing. The
coach also encourages the presenter to prepare for a strong introduction and close. During the rehearsal, the
coach actively listens to the presenter’s speech, but does not give feedback at the end of each slide to avoid
interrupting the presentation flow. Instead, she provides summative feedback on the overall presentation at
the end of the talk, focusing on the same five categories as in the Slide Walkthrough mode.
We now describe the three core components of our system, including the robotic coach, the presentation
quality assessment module, and the feedback generation module.
4.2 The Robotic Coach
We use Furhat [1], a human-like robot head, as our presentation coach. Furhat consists of an animated face
model that is back-projected onto a 3D translucent mask (Fig. 1). Our coach speaks using a female synthetic
voice from CereProc [4], with synchronized lip movements. She is capable of displaying a variety of non-
verbal behaviors while speaking, including facial expressions of affect (smile, neutral, concern), eyebrow
movements, directional gazes and head nods. Most of her non-verbal behaviors are automatically generated
using the BEAT text-to-embodied speech system [11]. Human-robot conversations are scripted using our
custom scripting language based on hierarchical transition networks. Users contribute to the conversation via
speech input. However, the current system does not incorporate natural language understanding
functionality. Thus, the coach does not attempt to interpret the user’s responses, and simply relies on speech
pauses to advance the dialogue.
While interacting with the presenter, the coach exhibits two types of listening behavior. First, the system
uses a Microsoft Kinect 2 camera to track the location and rotation of the presenter’s head. As the presenter
walks around during the presentation, the robot head moves so as to maintain its eye gaze in the presenter’s
direction. Second, the robot provides non-verbal backchannel feedback in the form of head nods at
appropriate times based on acoustic features of the presenter’s speech. Using a similar approach to [33], we
detect two prosodic cues, including raised loudness and lowered pitch. To identify these events, we
continuously process the last 2 seconds of speech at every 500-millisecond interval. We track prosodic events
PACM Interact. Mob. Wearable Ubiquitous Technol., Vol. 1, No. 2, Article 27. Publication date: June 2017.27:8 • H. Trinh et al.
occurring at least 500 milliseconds before the end of the speech sample. If the average intensity during the last
100 milliseconds of the voiced part of the sample is higher than the 99th percentile of the intensity contour, we
signal a raise in loudness. If the average pitch value for the same period is lower than the 23rd percentile of the
pitch contour, we signal a lowered pitch.
4.3 Presentation Quality Analysis
During the presentation, the system calculates the pitch range, speaking rate, filler rate, and audience
orientation every 20 seconds and reports the average of these values at the end of each slide. It also reports
the content coverage for each slide; determining whether the key ideas in the slide notes were spoken by the
presenter.
Content Coverage
To measure the content coverage for each slide, we use our method described in [3]. First, the slide notes are
processed to remove the stop words, convert numbers into their word representations, and lemmatize the
words using Stanford CoreNLP tools [34]. We select the remaining words as keyword candidates and extract
their synonyms using WordNet [37]. During the presentation, we perform automatic speech recognition
(ASR) using the IBM Watson cloud-based system [23], which provides a list of acoustically similar hypotheses
for each time frame. We detect keywords by matching each ASR hypothesis and its synonyms against the
keyword candidates and their synonyms.
To take into account the importance of each keyword, we assign weights to keywords based on tf.idf scores
and semantic similarity. Tf.idf is used for weighting the keywords based on their specificity to each topic.
Keywords are also weighted based on their semantic distance to the topic containing them compared to other
topics. Semantic similarity is measured based on the Euclidean distance between vector space representation
of words. We use Global Vectors for Word Representation (GloVe) [41] to measure the semantic similarity.
We update the coverage score of topics based on the spotted keywords and their weights. If the total score
of a topic gets higher than a threshold, that topic is tagged as covered. Our previous evaluation study showed
that setting the threshold to 25% results in a 77% F1 score for this method [3].
Speech Quality Features
To determine the speaker’s ranges for pitch and voice intensity, we calibrate the system at the beginning of
each session. We ask the speaker to read two short prepared lines of text and record their voice. We use these
recordings to extract the pitch and intensity contours in Praat [8]. This information is used for setting the
silence threshold, which is 25% of the difference between the 1st and 99th percentile of intensity, and the
thresholds used for identifying the prosodic cues for listening behavior.
Pitch is estimated using an autocorrelation method with a floor value of 75 Hz and a ceiling value of 500
Hz, which are Praat’s default settings. While the speaker’s pitch may vary based on speech content, previous
studies show that the overall pitch variety is significantly correlated with speech quality [6]. To measure pitch
variety, we calculate the difference between the 90th and 10th percentile (80% range) and the 95th and 5th
percentile (90% range) of pitch in Hertz and semitones. Semitone is a logarithmic scale which shows the
perceived pitch variation, and it can remove cross-gender differences [42]. We also calculate the Pitch
Dynamism Quotient (PDQ) by dividing the standard deviation of pitch by pitch mean values. PDQ has been
used as a normalized measure for pitch variation [21].
We use the method in [14] to estimate the speaking rate. Segments of speech with intensity values lower
than the silence threshold or undefined pitch values are marked as unvoiced segments. Peaks in the intensity
envelope of the voiced parts of the signal are identified and those that are at least 2 dB higher than their
succeeding peaks are extracted as syllable nuclei. To calculate the speaking rate, we divide the number of
syllables by the speaking time. Speaking time is defined as the total audio sample length minus the sum of
length of all pause segments. Pause segments longer than one second are considered as one second to remove
the effect of long pauses on speaking rate.
PACM Interact. Mob. Wearable Ubiquitous Technol., Vol. 1, No. 2, Article 27. Publication date: June 2017.RoboCOP: A Robotic Coach for Oral Presentations • 27:9
To measure the filler rate, we use the IBM Watson ASR to transcribe the speech and count filled pauses,
such as “um” and “uh”, and the word “like” in the speech transcription. Although “like” can be used as a non-
filler word, it is the most commonly used filler word [28]. Previous research shows that simply counting all
occurrences of potential filler words can result in approximately 70% accuracy in filler rate measurement.
Using language processing rules to filter non-filler usages can only reduce the error rate from 30% to 19%, at
the expense of much more complex algorithms [24]. The total number of fillers is divided by the speaking time
in minutes to determine the filler rate in fillers/minute.
Audience Orientation
As a proxy for eye contact measurement, our system uses Microsoft Kinect to track the speaker’s head
orientation to determine whether their focus of attention is on the robot audience rather than on the projected
slides or speaking notes. The Kinect is located behind and above the robot. Previous research [30] has shown
that using head pose could yield acceptable accuracy for real-time estimation of attentional focus, without the
expense of bulky eye trackers. The audience orientation ratio is calculated as the amount of time that the
speaker is looking at the robot while speaking divided by total speaking time.
Discretizing the Quality Measures
In order to provide feedback on quality measures, we need to set proper thresholds and ranges. Similar to [48,
54], we define these values using empirical data. We conducted a small user study in which we asked 8
participants to rate the speech quality of presentation samples randomly selected from a corpus. The corpus
includes 696 samples, each 20 seconds long, which were extracted from 30 presentation recordings of 21
different speakers. We automatically extracted the speech quality measures for these samples. The samples
were ordered based on the values of speech quality features and grouped into 20 bins. Each participant
watched 20 samples, one randomly selected sample from each bin, and rated the speaking rate, pitch variety,
and usage of fillers. We also recruited an additional group of 8 participants to rate the presenter’s eye contact
in 20 presentation recordings.
We grouped the values of speech quality measures from samples based on participants’ ratings. ANOVA
tests showed significant differences among group means for speaking rate, filler rate, and 90% pitch range in
Hertz. The results showed no significance for 90% and 80% pitch range in semitones, 80% pitch range in Hertz,
and PDQ. Therefore, we used 90% pitch range in Hertz as the pitch variety measure. Based on the participant
ratings, we set ranges and thresholds for each presentation quality measure, as shown in Table 2. We
evaluated the performance of our classifications by comparing the results of our automatic classifications
against participants’ ratings. Results of our evaluation showed that the system achieved 58.6% F1 for filler rate,
65.1% F1 for pitch variety, 46.1% F1 for speaking rate, and 84.3% F1 for audience orientation.
Table 2. Ranges and Thresholds for Speech Quality Metrics
Measures Range
Speaking Rate (syl/s) [0, 3]: slow (3,5): good [5, ∞): fast
Fillers (fillers/minute) [0,5): good [5,15): some [15, ∞): many
Pitch Variety (Hz) [0, 120): monotone [120, ∞): good
Audience Orientation [0, 0.4): low [0.4,1]: good
Identifying Performance Trends
We also determine the trends for each speech quality measure at both the slide level and overall presentation
level, which can be used to generate feedback on performance trends, as described in the next section. For
overall presentation level, we defined five different types of trend:
1. Flat Good: If the measure value in more than 80% of the slides is in the “good” range
2. Flat Bad: If the measure value in more than 80% of the slides is not in the “good” range
PACM Interact. Mob. Wearable Ubiquitous Technol., Vol. 1, No. 2, Article 27. Publication date: June 2017.27:10 • H. Trinh et al.
3. Improving: If the measure value in the first 40%-60% of the slides is not in the “good” range but in the
rest of slides is in the “good” range
4. Degrading: If the measure value in the first 40%-60% of the slides is in the “good” range but in the rest
of the slides is not in the “good” range
5. Variable: Other cases
For slide-level trends, we compared the performance of two consecutive slides and defined five trend types:
1. Significant Improvement: If there is a change in the range of the measure, in the positive direction
2. Slight Improvement: If there is no change in the measure range, but there is at least 10%
improvement in the measure value
3. Flat: If there is no change in the range of the performance
4. Slight Degradation: If there is no change in the measure range, but there is at least 10% degradation
in the measure value
5. Significant Degradation: If there is a change in the range of the measure, in the negative direction
4.4 Feedback Generation
Using the output from the presentation quality analysis, we automatically generate two types of verbal
feedback, including slide-level feedback provided at the end of each slide in the Slide Walkthrough mode, and
presentation-level feedback provided at the end of the talk in the Dry Run mode. Our aim was to offer
constructive coaching feedback that combines both contextualized suggestions for improvements and positive
reinforcement to build speaker confidence. Our feedback generation module, described next, is developed
based on the standard Natural Language Generation (NLG) pipeline [47].
Content Determination
Content determination is the process of deciding what information and messages should be included in the
feedback [47]. A common approach to this task is corpus analysis of human-authored text samples. Thus, we
collected a corpus of 134 slide-level feedback samples and 22 presentation-level feedback samples. These
samples were collected from two sources: transcribed feedback of expert coach participants from our
exploratory study, and written samples from two expert presenters in our team who are experienced in
mentoring students on their presentations. We analyzed the corpus following the procedure described in [18].
We first segmented the text samples into sentences, and categorized each sentence into one of six message
topics, including: (1) overall evaluation of slide/presentation performance; (2) content coverage; (3) speaking
rate; (4) pitch variety; (5) filler rate; (6) eye contact. For each quality measure, we then annotated each
sentence with a message type (e.g. description or suggestion). As the result of this process, we identified 4
main message types to be generated for each quality measure, as shown in Table 3: (1) description of current
performance; (2) description of performance trend; (3) suggestion; (4) elaboration of suggestion (e.g.
explanatory justification or relevant high-level advice). In addition to the message types, we also identified
text structure patterns, aggregation patterns as well as lexicalization options for each of the message type
classes. This forms the basic knowledge source for the document structuring and micro-planning processes.
Table 3. Examples of Message Types for Feedback on Speaking Rate, Extracted from Our Feedback Corpus
Message Type Example Sentence
Current Performance Description Your speaking rate was just right on this slide.
Trend Description That was much better on speaking rate.
Suggestion You could slow down a little bit.
Elaboration of Suggestion You should try to relax a little and take intentional pauses. Every pause is an
opportunity for the audience to digest what you just said and for you to
remember what to say next.
PACM Interact. Mob. Wearable Ubiquitous Technol., Vol. 1, No. 2, Article 27. Publication date: June 2017.RoboCOP: A Robotic Coach for Oral Presentations • 27:11
Document Structuring
Document structuring is the process of organizing all messages into a coherent structure. Informed by our
exploratory study, we structure our feedback messages using the “feedback sandwich” technique [15], starting
with positive messages before proceeding to suggestions for improvement. Previous research has shown that
positive feedback tends to be perceived as more accurate and thus more accepted than negative feedback [53].
Thus, starting with positive feedback could help increase the credibility of the feedback source and have
positive effects on the acceptance of subsequent suggestions.
More specifically, our feedback consists of three main sections:
1. Positive opening statement: describing the overall evaluation of the slide/presentation performance.
The level of positivity is dependent on the value of the overall quality measure.
2. Positive feedback section: describing either positive trends or positive performance of the current
slide or overall talk for each of the five presentation quality measures, if any.
3. Suggestion section: describing suggestions for improvement for each of the five quality measures, if
any.
This structure can be seen in the automatically-generated feedback examples shown in Table 4.
Table 4. Examples of Slide-level Feedback and Presentation-level Feedback Generated by Our System
Slide-level Feedback Presentation-level Feedback
Overall, good delivery on this slide. OK, Anna. Great job on your rehearsal.
Your speaking rate was perfect again. And you did You maintained a very good speaking rate throughout. And you
much better on avoiding fillers this time. Also, you did did a great job avoiding filler sounds. That’s a common problem
an excellent job maintaining eye contact with your that you don’t have. Also, you made a great use of pitch variety
audience. to emphasize important points.
However, there are a few things that you might want to Not let’s talk about things that you could still improve on.
work on. Regarding the content of the presentation, you did a pretty good
I think you might have missed some important points job covering the material. But I think you might have missed
about Geography, so you might want to review your some important points about Wine and Cheese on the last slide. If
notes before going on. you find you are skipping content accidently, try to figure out
Also, you could practice to add more pitch variety in why. Maybe there is a better way of making or connecting your
your speech. I recommend taking some time to identify points, so that you could flow more naturally into one another,
your most important points and really emphasize them, and become more memorable to you and to your audience.
using high tones or low tones. Also, you could try to spend more time maintaining eye contact
with your audience. It’s important for the audience to feel that
you are talking to them, and it’s important for you to constantly
assess their reaction.
Again, overall, a great rehearsal. I am looking forward to your
presentation.
Micro Planning and Surface Realization
At this stage, we define text specifications for each message type, specifying the syntactic structure and lexical
items to be used in each message. We use a mixture of procedurally generated specifications (for descriptions
of current performance, trend, and suggestions) and canned text (for elaboration of suggestions). To avoid
repetition, we provide multiple variations for each message type.
To increase the naturalness of the generated text, we also perform some aggregation operations in the
form of simple conjunction based on the user’s performance trends. For instance, if the system detects a slight
PACM Interact. Mob. Wearable Ubiquitous Technol., Vol. 1, No. 2, Article 27. Publication date: June 2017.27:12 • H. Trinh et al.
Fig. 3. Rehearsal setup for (a) RoboCOP and (b) Voice Only & Graphic conditions in the feedback modality study
improvement in speaking rate but it is still not in the optimal range, the system will generate a sentence
describing the positive trend (e.g. “You did better on speaking rate”) followed by a suggestion (e.g. “You could
still try to slow down a little more”). As there is a contrast discourse relation between these two sentences, the
system selects the word “but” as an appropriate connective for aggregation, resulting in the utterance: “You
did better on speaking rate, but you could still try to slow down a bit more”.
As the final step of the generation process, we use the SimpleNLG realization engine [17] to generate
natural language strings from the text specifications.
5 COMPARISON OF FEEDBACK MODALITIES
To investigate the effects of RoboCOP on the presenter’ experience, we conducted a user study comparing our
robot-based coaching feedback against visual feedback (Graphic condition) and verbal feedback without robot
(Voice Only condition). Our aim was to evaluate the effects of both the physical embodiment of the rehearsal
coach and the use of verbal feedback on the overall rehearsal experience of presenters.
5.1 Feedback Modalities
We compared three following feedback modalities:
RoboCOP: During rehearsal, the robot acts an audience and a coach to provide spoken feedback on five
presentation quality metrics: speaking rate, filler rate, pitch variety, audience orientation (i.e. eye contact), and
content coverage (Fig. 3a).
Voice Only: The system also provides the same type of spoken feedback generated by the RoboCOP
system. However, the robot is not presented during the rehearsal. To provide presenters with a focal point for
making eye contact while speaking, we replace the robot with a secondary monitor displaying the word
“Audience” (Fig. 3b).
Graphic: To compare the spoken feedback generated by RoboCOP with the type of feedback offered in
existing presentation support systems (e.g., [22, 27, 54]), we developed a Graphical Feedback system that
provides visual feedback at the end of each slide on the five presentation quality metrics (Fig. 4). For each
metric, we display a color-coded text label describing the range of performance for the current slide (e.g.
“good” or “monotone” for pitch variety), and a bar chart showing the exact values of performance across all
presented slides. As in the Voice Only condition, we replace the robot with a monitor displaying the word
“Audience” while the presenter is speaking. At the end of each slide, we switch the “Audience” window to the
Feedback window on the same monitor to display the graphical feedback. Compared to our spoken feedback,
PACM Interact. Mob. Wearable Ubiquitous Technol., Vol. 1, No. 2, Article 27. Publication date: June 2017.RoboCOP: A Robotic Coach for Oral Presentations • 27:13
Fig. 4. Example of graphical feedback displayed at the end of each slide
this visual feedback does not provide detailed suggestions for improvement. However, it offers the presenter a
glanceable way to access more fine-grained data about their performance levels and trends across all slides.
5.2 Procedure
We asked each participant to rehearse and deliver three 3-minute presentations on comparable topics
(France’s tourist attractions, French art and French cuisine) in English using prepared PowerPoint slide decks
and notes. Each slide deck contained 3 slides and approximately 300-word supporting notes, covering 8 key
points. For each presentation, presenters were asked to rehearse with a different feedback modality.
The study was a within-subject, single-session design with three conditions: RoboCOP vs. Voice Only vs.
Graphic. Each session lasted between 90-120 minutes. The ordering of the conditions and the slide decks were
randomly assigned and counterbalanced.
At the beginning of the session, we introduced participants to the task of preparing and delivering three
short presentations using pre-made slide decks and notes and different feedback systems. We instructed them
to cover all the key points in the notes, but not necessarily word-for-word. For each condition, we allowed
participants 10 minutes to review the slides and notes in PowerPoint, before performing one round of
videotaped, spoken rehearsal using the Slide Walkthrough mode that provides slide-level feedback. In this
mode, once participants finish presenting each slide, they press a button on a remote control to either listen to
the verbal feedback (in RoboCOP and Voice Only conditions) or view the visual feedback (in the Graphic
condition) on their performance of the current slide. At the beginning of the rehearsal in the Graphic
condition, the experimenter showed participants sample visual feedback generated by the system, and
provided a brief explanation of each of the five components of the feedback. Each rehearsal lasted between 5-
10 minutes, and the experimenter was not present during the rehearsal.
Following each rehearsal, participants were asked to deliver their final, videotaped presentation in front of
the experimenter. After delivering each presentation, they were asked to complete two questionnaires
assessing their experience of the feedback system that they have just used and self-ratings of their
presentation quality (see Section 5.4). Once the participants have completed all three presentations, we
instructed them to rank the three feedback systems using a questionnaire (see Section 5.4). We concluded the
session with a semi-structured interview, prompting for comparisons of the three feedback systems and their
effects on the overall experience of the presenters.
PACM Interact. Mob. Wearable Ubiquitous Technol., Vol. 1, No. 2, Article 27. Publication date: June 2017.27:14 • H. Trinh et al.
5.3 Participants
We recruited 30 students with backgrounds in science, technology, engineering, marketing and teaching, as
well as varying levels of presentation experience (11 female, 19 male, ages 18-27, mean 23). Of these, 8 were
categorized as high competence public speakers, 2 were categorized as low competence public speakers, and
20 had moderate competence according to the Self-Perceived Communication Competence Scale [35]. None of
the participants interacted with any of the feedback systems prior to the study. Participants were
compensated $25 for their participation.
5.4 Measures
Presenters’ experience with the feedback systems was evaluated using the following self-reported measures:
Absolute Rating of Feedback System: Assessed in each condition after delivering each presentation,
using a 10-item, 7-point scale questionnaire, as shown in Table 5.
Relative Rating of Feedback Systems: Assessed after delivering all three presentations, ranking the three
feedback systems from 1 (Best) to 3 (Worst) on 11 criteria, as shown in Fig. 5.
Self-perceived Rating of Presentation Quality: Assessed in each condition after delivering each
presentation, using a 7-item, 7-point scale questionnaire, as shown in Table 6.
5.5 Quantitative Results
Absolute Rating of Feedback System
Table 5 shows the results of the participants’ absolute ratings of the three feedback modalities. Overall,
participants reported high ratings across all three conditions for most measures. Results of a Friedman test
showed a significant effect of the feedback modality on satisfaction (χ2(2) = 6.93, p = .031). Post-hoc analysis
using Wilcoxon signed-rank tests with Bonferroni correction for multiple pairwise comparisons showed
significant differences between the RoboCOP and Graphic conditions (Z = -2.43, p = .015), and between
RoboCOP and Voice Only conditions (Z = -2.52, p = .012), both in favor of the RoboCOP condition. There were
no significant differences between the three conditions for other measures.
Table 5. Absolute Ratings of the Three Feedback Systems (Mean (SD) and p-value of Friedman Tests)
Rating of Feedback System: Graphic Voice Only RoboCOP P R
(Scale Measures from 1-7)
1 – Not At All 7 – Very Much
How satisfied are you with the rehearsal system? 5.93 (1.14) 6.07 (.87) 6.43 (.68) .03
How engaged were you with the rehearsal system? 5.47 (1.43) 5.60 (1.16) 6.0 (1.08) .19
How much were you attending to the rehearsal system? 5.73 (1.2) 5.73 (1.17) 6.0 (1.26) .28
How much do you feel the rehearsal system helped you? 5.93 (1.2) 6.13 (1.01) 6.03 (1.19) .83
How anxious did the rehearsal system make you feel? 3.27 (2.1) 3.13 (2.03) 3.07 (1.78) .76
How much would you like to prepare future 5.73 (1.31) 5.97 (1.30) 6.1 (1.29) .25
presentations with the rehearsal systems?
How well did you understand the feedback? 6.33 (1.03) 6.57 (.77) 6.43 (1.26) .87
How much do you feel you trust the feedback? 5.73 (1.29) 6.07 (.94) 6.0 (1.17) .05
How comfortable were you with receiving feedback 6.13 (1.07) 6.43 (.77) 6.23 (1.14) .60
from the rehearsal system?
How likely were you to follow the rehearsal system 6.03 (.93) 6.28 (.84) 6.3 (1.09) .10
suggestions?
PACM Interact. Mob. Wearable Ubiquitous Technol., Vol. 1, No. 2, Article 27. Publication date: June 2017.RoboCOP: A Robotic Coach for Oral Presentations • 27:15
Fig. 5. Relative rankings of three feedback strategies (lower values are better), with p-values from Friedman tests and
indications of significance differences in pairwise comparisons (p < .01 is marked as ** and p < .05 is marked as *)
Relative Rating of Feedback System
Fig. 5 shows the results of the participants’ relative ratings of the three feedback modalities. Results of
Friedman tests showed significant effects of the feedback modality on satisfaction (χ2(2) = 7.27, p = .026),
engagement (χ2(2) = 22.87, p < .001), attending to rehearsal system (χ2(2) = 12.87, p = .002), helpfulness of
rehearsal system (χ2(2) = 6.07, p = .048), understandability of feedback (χ2(2) = 6.07, p = .048), helpfulness of
feedback (χ2(2) = 6.07, p = .048), and likelihood of following the system suggestions (χ2(2) = 6.71, p = .035). There
were no significant differences between the three conditions for other measures.
Post-hoc analysis using Wilcoxon signed-rank tests with Bonferroni correction for multiple pairwise
comparisons showed that RoboCOP was ranked significantly higher than the Voice Only condition in terms of
satisfaction (Z = -2.85, p = .004), engagement (Z = -3.05, p = .002), attending to rehearsal system (Z = -3.17, p =
.002), helpfulness of rehearsal system (Z = -2.80, p = .005), understandability of feedback (Z = -2.72, p = .006), and
likelihood of following the system suggestions (Z = -2.80, p = .005). RoboCOP was also ranked significantly
higher than the Graphic condition in terms of engagement (Z = -3.82, p < .001) and attending to rehearsal
system (Z = -2.94, p = .003). The Voice Only condition was ranked significantly higher than the Graphic
condition in terms of engagement (Z = -2.47, p = .013). No other significant differences were found in other
pairwise comparisons.
In summary, results of the absolute and relative ratings of feedback modalities demonstrated the positive
effects of the robot-based coaching approach to improve the overall rehearsal experience of presenters,
compared to both the Voice Only and Graphic conditions. On the other hand, there were no major differences
between the Voice Only and the Graphic conditions, except that participants were more engaged with the
verbal feedback than with the graphical feedback.
Self-perceived Rating of Presentation Quality
Table 6 shows the results of the participants’ self-ratings of their presentation quality for the three feedback
conditions. Results of Friedman tests showed no significant differences between the three conditions in any of
the quality measures.
PACM Interact. Mob. Wearable Ubiquitous Technol., Vol. 1, No. 2, Article 27. Publication date: June 2017.27:16 • H. Trinh et al.
Table 6. Participants’ Self-Perceived Ratings of Presentation Quality for Three Feedback Systems (Mean (SD) and p-value
of Friedman Tests)
Rating of Presentation Quality: Graphic Voice Only RoboCOP p R
(Scale Measures from 1-7)
1 – Not At All 7 – Very Much
How would you rate the overall quality of your 4.97 (1.22) 5.10 (1.03) 5.37 (1.03) .25
presentation?
How engaging was your presentation? 4.80 (1.22) 4.97 (1.27) 5.30 (1.02) .05
How understandable was your presentation 5.67 (.96) 5.63 (1.07) 5.77 (1.19) .73
How nervous were you during your presentation? 3.60 (1.83) 3.53 (1.74) 3.27 (1.51) .87
How exciting was your presentation? 4.83 (1.09) 4.97 (1.33) 4.87 (1.53) .82
How entertaining was your presentation? 4.70 (1.29) 4.87 (1.28) 5.0 (1.46) .26
How competent were you during your presentation? 5.10 (1.27) 5.37 (1.00) 5.47 (.94) .23
5.6 Qualitative Findings
Our semi-structured interviews, conducted by the first author, were transcribed and coded using thematic
analysis techniques [8]. From our analysis, we derived two main themes relating to the effects of the physical
embodiment of the automated coach and the use of verbal feedback on the overall experience of presenters.
Impact of the Physical Embodiment of the Coach
Most participants reported on the positive effects of the robot presence in creating an engaging and
interactive rehearsal environment that simulates a real-life presentation scenario with an actual audience: “I
liked the robot the most. It was more interactive than the other two. It was like getting feedback from a live
audience” [P28], and “the robot gave a sense of a person in front of you. I feel more comfortable talking to a person
because in the presentation I should be talking in front of a large audience, so it’s more comfortable for me” [P26].
The presence of the robot also encouraged presenters to pay more attention to her feedback and suggestions:
“She’s just in front of you and she’s talking to you, so you may be more interested in what she said” [P24].
Moreover, the human-like facial appearance of the robot and her attentive listening behaviors also helped
promote audience connection through eye contact: “I liked the robot the most, just because I got to look into
somebody’s eyes…I think, for me it’s more believable for her to say ‘you are not making enough eye contact’
because she also has eyes” [P21]. While the feedback on the robot was overwhelmingly positive, two
participants suggested to improve the user experience by incorporating human-robot dialogue capabilities.
Visual vs. Verbal Feedback
Participants reported mixed responses regarding the effectiveness of verbal feedback offered in the RoboCOP
and Voice Only conditions. Compared to the graphical feedback, the verbal feedback was reported to be more
“interactive and personal” [P3] as it resembles verbal human communication. The detailed, actionable
suggestions embedded in the verbal feedback were also found to be helpful: “I preferred the one with the voices,
because the third one [graphic], it didn’t really give you suggestions. It only gave you the overall ratings of the
performance. The voices actually told you how you could improve in some areas” [P27]. Participants also
appreciated the empathetic style of our verbal feedback: “She had a very kind voice too. So I felt good about
myself when she said ‘Excellent’. And then if she said ‘you need more eye contact’, I would try to harder to look
into her eyes directly” [P21]. Several participants also reported more difficulties interpreting graphical feedback
compared to verbal feedback.
On the other hand, several participants stated that they preferred the visual feedback over the verbal
feedback, mainly because it provided a quick way to access raw performance data and determine the trends of
their performance, which could be more difficult to identify through our verbal feedback: “It was easy, quick,
and I actually read every single thing. And I looked at the bars and thought okay I got a little better. I’m very
visual so the visual stuff was perfect for me” [P13].
PACM Interact. Mob. Wearable Ubiquitous Technol., Vol. 1, No. 2, Article 27. Publication date: June 2017.You can also read