Roll-out of public EV charging infrastructure in the EU - Is the chicken and egg dilemma resolved? - EurActiv
←
→
Page content transcription
If your browser does not render page correctly, please read the page content below
Roll-out of public EV charging
infrastructure in the EU
Is the chicken and egg dilemma resolved?
September 2018

                                           a study by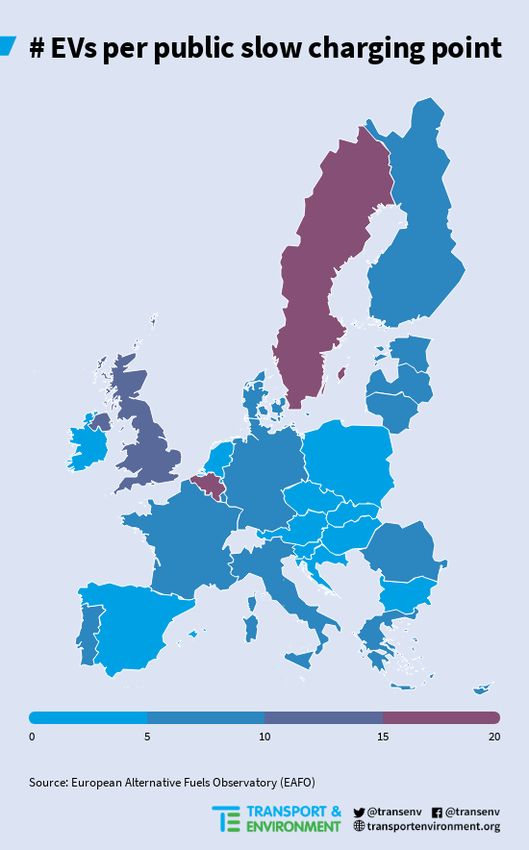
In house analysis by Transport & Environment
Published by Transport & Environment

For more information, contact:
Lucien Mathieu
Transport & E-mobility Analyst
Transport & Environment
lucien.mathieu@transportenvironment.org
Tel: +33(0)6 69 99 42 76

                                               a study by   2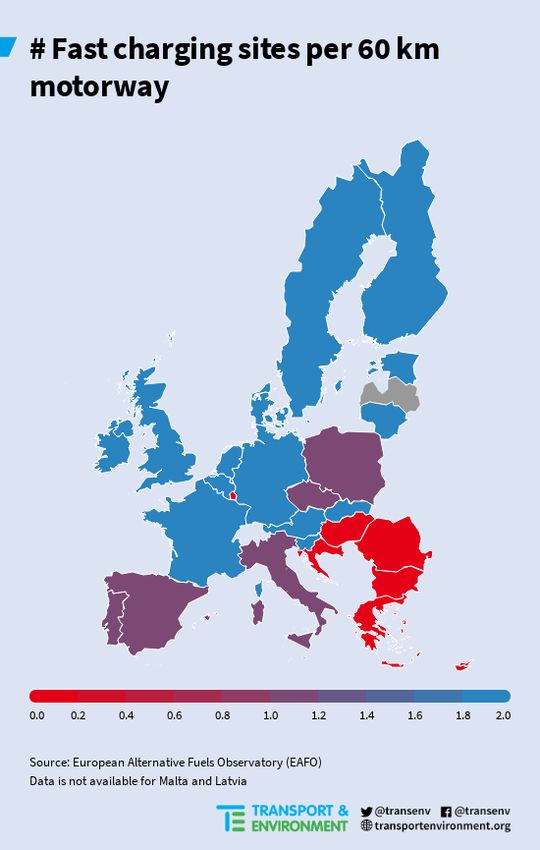
Executive Summary
Which comes first, electric cars or the recharging points? How to tackle this dilemma has been the subject
of considerable debate. This report examines the importance and availability of public charging
infrastructure and how to efficiently expand the existing network as the number of electric vehicles on the
road increases.

Despite the considerable emphasis on the importance placed on public recharging to drive EV acceptance,
the data shows that public chargers are only used for about 5% of charging events. Furthermore, as the
market matures this share is expected to decline with a preference for more fast charging over slow kerbside
sites. The visibility of public recharging may however be important in encouraging existing drivers of
conventional cars to switch to electric options although public chargers are rarely used.

In western and northern Europe a basic minimum infrastructure is, or imminently will be, available to
recharge the EVs. At present there are about 5 EVs on the road per public charging point (compared to the
Commission recommendation of 10). With growth in both vehicle and charger numbers there should be
about 220,000 chargers by 2020 and a ratio of 10:1. There will also be good coverage of fast chargers along
the European motorway network with about 1,000 ultra-fast (150-350 kW) charging sites planned for 2020.
These sites will allow drivers to replenish up to 400 km of driving range in only 15 minutes. Additional, 50
kW fast charging deployment will complement these sites with more than 2,500 sites existing today and
nearly double this set to be operational by 2020. This translates into one recharging point every 34 km along
the strategic TEN-T Core Network – more than sufficient to support the early market.

In Northern and Western Europe, where 3 in 4 new cars are sold and the chicken and egg dilemma has been
resolved, the primary bottleneck in growing the market for electric cars is not the lack of recharging but the
lack of cars to plug-in. The study estimates the initial need for public investment will gradually reduce and
in the period 2020-2025 the cumulative cost of public charging is estimated at €12 billion, a small fraction
of the €100 billion invested by the EU every year in transport infrastructures.

In Southern, Central and Eastern Europe the deployment of rechargers has been much more limited. The
market for EVs is expected to lag behind those of the front runners by 5-10 years though investment will be
available – the draft European Commission budget for 2020-7 has a commitment to spend at least 60% of
the EU’s cross-border infrastructure fund on schemes that help the fight against climate change. This
includes €30bn for transport in the Connecting Europe Facility.

The limited number of charging points today has no significant effect on the current EU market as a whole
and future support will be available. Targeting future investment appropriately will be essential and cities
in particularly should be able to access these monies. Support for grid upgrades should also be prioritized
along with support for startup SMEs.

                                                                a study by                                3
Table of Contents
1. Introduction 5
2. Availability of EV charging infrastructure today 6
2.1 Slow charging 6
2.2 Fast charging 7
2.2.1 The current situation 7
2.2.2 Planned developments of fast charging networks 9
3. Solving the chicken and the egg dilemma 9
3.1 Leaders and followers: waves of roll out of EV infrastructure 9
3.2 Costs of EV infrastructure build up 12
4. Recharging in Cities 14
5. Conclusions & policy recommendations 16
Annex: Planned European ultra-fast charging networks 19
a study by 41. Introduction
Resolving the chicken and egg dilemma of what comes first the electric vehicles (EVs) or recharging
infrastructure has been a source of considerable debate between those engaged in achieving a shift to
electromobility.
The limited availability of public recharging can undoubtedly be a psychological barrier to EV uptake for
drivers of conventional vehicles. But cheap and convenient private charging is one of the many advantages
of EV’s avoiding the need to “fill up” and breath nauseous and toxic fumes on oily forecourts. Numerous
studies have shown access to home recharging is the most important factor in encouraging consumers to
purchase EVs 1 and it is clear the market has considerable growth potential just by focusing on citizens with
access to a home charger.
This report examines the availability of recharging infrastructure for electric cars and whether it is sufficient
for the niche market to grow in the next few years. Sales are expected to increase sharply to represent 5-7%
of new car sales by 2021 in response to car CO2 regulation. 2 A study by the European Commissions Joint
Research Centre (JRC) 3 shows that early EV adopters are less reliant on the provision of public charging
infrastructure. They indicated availability of public charging becomes more important only after the share
of EVs in the vehicle fleet exceeds 5%, a level only likely to be reached around 2025 in leading markets. By
this time the business case for investment will anyway be. The report therefore asks the question have we
fixed the chicken and egg dilemma?
The first part of the report examines the availability of recharging infrastructure throughout the EU and
shows the “egg” (infrastructure) has largely come first. The second part of the paper defines a roadmap for
the next decade for the rollout of public charging infrastructure in the EU to evaluate whether roll out will
be sufficient to support the anticipated higher sales.
Whilst there has been considerable focus on and investment in public recharging infrastructure evidence
from studies shows that it is a very minor part of the way electric cars are charged and just 5% of vehicle
charging happens at public charging locations including on-street city charging, car parks and fast charging
along road corridors. 4 95% of EV charging happens home and at work. Evidence from Norway, the most
developed EV market in Europe, shows that as the EV market matures, public urban charging is used less
rather than more. A comparison of surveys from 2014 to today elaborated by IEA 5 on evolution of charging
habits indicates that relatively fewer people use publicly accessible slow chargers and that fast charging
along corridors is the only charging type that has increased in use in Norway. This could be explained by
improved coverage and power of fast charging networks and increasing driving ranges. As a consequence,
in Norway, the share of drivers relying on public slow charging on a daily basis dropped from almost 10% in
2014 to just 2% in 2017 (about 15% of drives used it on a weekly basis).
The availability of public recharging appears to have a psychological impact on the willingness of drivers to
consider buying an EV, but once the decision has been made very little use is actually made of the available
1
Bailey et al., 2015; Dunckley and Tal, 2016; Nicholas and Tal, 2017; Plotz and Funke, 2017; Skippon and Garwood, 2011
2
https://www.transportenvironment.org/sites/te/files/publications/2018_04_CO2_emissions_cars_The_facts_report
_final_0_0.pdf
3
The study has modelled the impact of different measures and their timing to help policy makers find the right balance
in the transition to EVs. Harrison and Thiel, 2017: An exploratory policy analysis of electric vehicle sales competition
and sensitivity to infrastructure in Europe. https://www.sciencedirect.com/science/article/pii/S0040162516302104
4
A review of consumer preferences of and interactions with electric vehicle charging infrastructure, Hardman et al.,
2018
5
https://webstore.iea.org/download/direct/1010?fileName=NordicEVOutlook2018.pdf
a study by 5public infrastructure. In cities in which on-street parking is the norm public recharging infrastructure will be
more important – but whether the extent to which in the future these cars will be privately owned rather
than shared remains uncertain. Whilst this report focuses on public charging infrastructure roll-out its
importance relative to private, including workplace recharging is minor.
2. Availability of EV charging infrastructure today
Analysis by the Platform for Electromobility 6 of current and planned public charging infrastructure shows
there is not lack of infrastructure today and if national charging infrastructure roll-out plans are met there
will also be sufficient EV chargers until 2020 7 to meet the anticipated surge in sales over the next few years.
The analysis is based on Member States’ submitted plans to implement the Alternative Fuels Infrastructure
Directive. The Commission has recommended (based upon expert advice) there should be 1 public
recharging point for every 10 EVs on the road. The analysis showed that in average there were about 5 EVs
on the road per public charging point and by 2020, with the growth in both vehicles and recharging points
the ratio will be around 10 EVs per public charging points in 2020 (assuming EU countries deliver on their
plans) a total of about 220,000 chargers. The analysis also shows that there will be sufficient coverage along
key EU strategic road network. Rather than the lack of infrastructure there is now solid evidence showing
that it is the limited availability of electric vehicles, the minimal marketing 8 of EVs and discouraging
salespeople 9 that are largely responsible for current low electric vehicles sales. Still, most national plans
clearly focus on electromobility for the future of passenger car transportation whereas only several
countries prioritize natural gas (Italy Hungary, Czech Republic)..
2.1 Slow charging
Slow (or “regular”) public chargers can be found in urban areas where they can be used with other charging
options primarily to address the needs of EV owners that do not have access to private off-street parking
and drivers making occasional trips into a city centre. There is no benchmark for the recommended supply
of slow charging in cities since it can vary greatly from one city to another due to many local factors as
availability of off-street parking, GDP, number of cars, etc. However, the map below shows that only 2
countries have a number of EVs per public slow charger significantly above 10 (Belgium and Sweden has
values close to 20).
6
https://www.transportenvironment.org/publications/how-eu-member-states-roll-out-electric-mobility-electric-
charging-infrastructure-2020
7
Based on the Commission's’ guideline of 10 EVs per public charging point
8
https://www.transportenvironment.org/publications/carmakers-still-failing-hit-their-own-goals-sales-electric-cars
9
A study based on 82 car dealerships across Denmark, Finland, Iceland, Norway and Sweden found that dealers were
dismissive of EVs, misinformed shoppers on vehicle specifications, omitted EVs from the sales conversation and
strongly oriented customers towards petrol and diesel vehicle options. https://electrek.co/2018/05/21/electric-car-
adoption-deceptive-car-dealerships-new-study/
a study by 6Figure 1 - The EU supply of slow charging
2.2 Fast charging
2.2.1 The current situation
Fast charging along corridors and highways is essential for drivers to complete journeys beyond the range
of their vehicle. It also acts as a psychological safety net enabling drivers to travel longer distances and
further from their usual charging location 10.
Today there are around 2,550 rapid charging sites installed on European main roads 11 with a total of about
5,000 CCS chargers. 12 This is equivalent, in average, to one site (equipped with 2 CCS chargers) placed every
60 km in average on EU motorways 13 for every direction on the highway 14. Figure 2 show the
10
Neaimeh et al., 2017
11
Element Energy’s analysis of the OpenChargeMap.org (OCM) database, June 2017 found in Fuelling Europe’s
Future II. Discounting charge points found at Nissan car dealerships, and Tesla’s supercharger network sites (this
reduces the number of sites by ca. 15%).
12
CCS Charge Map Europe, July 2018, http://ccs-map.eu/stats/
13
Total EU motorways: 76,500km (Eurostat, 2016)
14
In practice this is two sites every 60 km but EV drivers would only access one site, depending on their direction of
travel (e.g. most gas stations on motorways)
a study by 7current situation of the rollout of fast charging infrastructure in the EU 15:
Figure 2 - The existing EU fast charging network
The map on the left illustrates that most countries already have a good coverage of fast charging sites. For
comparison the European Commission’s guideline is one fast charging site every 60 km on the TEN-T Core
Network 16 by 2025, whereas here this same coverage is, in most parts, already achieved in average on EU
motorways (which are almost twice as long as the TEN-T Core network). Indeed 11 countries -representing
56% of EU’s BEVs- already have more than 2 fast charging sites per km of motorway.
The coverage of fast charging sites is not uniform. 10 Member States have less than 1 fast charging site per
60 km of motorway but only about 8% of today's EVs on the road. The lack of coverage in Hungary, Romania,
Bulgaria and Greece is notable and needs to be addressed to enable EVs to be used EU-wide.
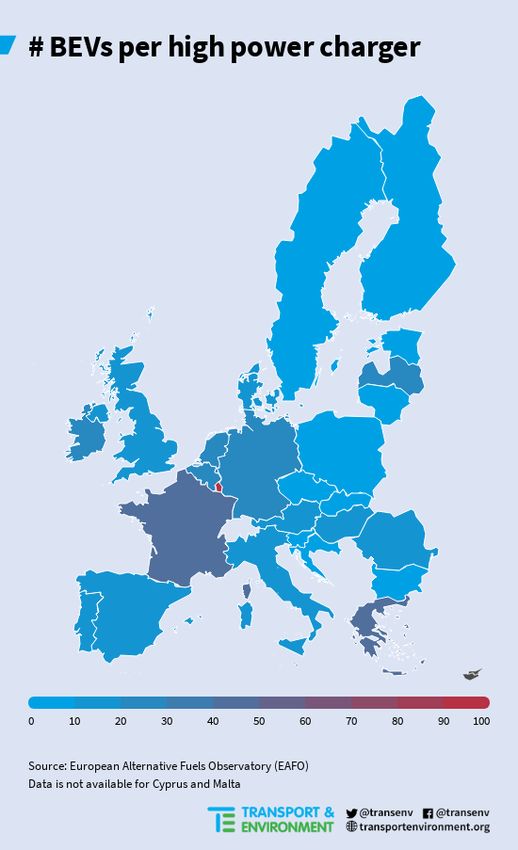
The right map shows the number of BEVs per fast charger in each country. The huge majority of Member
States have a low number of BEVs per high power charger (blue coloring). A lack of fast charging
infrastructure for the number of BEVs currently on the roads would indicate number above 100 BEVs per
fast charger. Today, only one country (Luxembourg) has more than 50 BEVs per fast charger (154).
15
Based on EAFO data: 17,000 high power chargers in the EU, July 2018. This corresponds, to the 2,550 sites equipped
with two tri-standard connectors (CCS, CHAdeMO, AC Type 2).
16
The total length of the EU28 TEN-T Core network is 34,401 km, TEN-T Comprehensive network is 136,706 km. The
comprehensive network ensure accessibility to all European regions (including peripheral and outermost regions) and
the core network is distinguished by its strategic importance for major European and global transport flows:
https://ec.europa.eu/transport/themes/infrastructure/ten-t-guidelines/maps_fr
a study by 8Coverage of fast charging infrastructure in Europe is progressing well and has already reached today a
sufficient minimum level for long distance travels in Western and Northern countries but not yet in Central
and Eastern Europe.
2.2.2 Planned developments of fast charging networks
Ultra-fast charging enables EVs to replenish for up to 400 km of range in only 15 minutes with powers
ranging from 150 kW to 350 kW. Recent announcement for deployment of ultra-fast charging networks (e.g.
Ionity, Ultra-e, Mega-e) are that there will be more than a 1,000 such sites within the next few years (see
annex for the detail on planned networks). Sites are initially planned to 150 kW, with upgrades to 350 kW
once new vehicle models capable of receiving such power are available and charging standards (CHAdeMO
and CCS) are updated to support higher powers. The planned sites are equivalent in average to one ultra-
fast charging station every 34 km on the TEN-T Core Network (for comparison Tesla has just hit 400
Supercharger sites in Europe 17). Projects like NEXT-E and Central European Ultra Charging ensure Central
and Eastern Europe will also be well covered by ultra-fast charging infrastructure.
Automakers are also involved in installing fast-charging infrastructure (e.g. FastCharge Consortium by BMW
and Porsche want to improve charge rate to 450 kW). Such investment from car makers in charging
networks increases the value of their EVs. Being able to recharge cars within the recommended driving
break time (10/15 minutes every 2 hours) is expected to be a game changer for market uptake as it should
help to address drivers remaining range anxiety.
Assuming those chargers are located in stations along the TEN-T Comprehensive network, there would be
an average of one high power charging station every 58 km in average on the TEN-T Comprehensive network
in 2020 18 or a total of 4,800 stations. This is ahead of the Commission's recommendation which covers only
the TEN-T Core network and has set 2025 as the target year. The Commission concluded that the coverage
“largely seems to be progressing well” and almost all countries will have a coverage that “seems sufficient”
by 2025. In conclusion, the EU motorways are likely to be very well covered with fast charging stations
by the early 2020’s.
3. Solving the chicken and the egg dilemma
The previous section has shown that availability of charging infrastructure (the “egg”) is currently ahead of
EV deployment and will stay so in the next couple years. Furthermore, the planned fast charging network
will be sufficiently dense to enable more recent EVs (with longer ranges) can be used for trips throughout
much of Western & Northern Europe by 2020 and throughout Europe a few years later. Access to city centre
charging points will also be within the Commissions proposed 10:1 vehicle to charging point ratio indicating
sufficient initial coverage. It is however clear that recharging is not being rolled out uniformly EU wide – a
point carmakers have been keen to highlight. This section therefore examines whether homogenous roll-
out is needed or a phased approach is more practical and cost effective?
3.1 Leaders and followers: waves of roll out of EV infrastructure
The rational approach to recharging infrastructure roll-out is for this to develop beyond the necessary
minimum as the number of EVs on the road increases. Since EV sales are focused in Western and Northern
17
Announcement from June 2018. Network is sufficient for drivers to move freely between the Northern top of Norway,
the Southern tip of Spain, the UK and Hungary or Poland
https://www.driving.co.uk/news/now-400-tesla-supercharger-stations-across-europe/
18
Sites are direction-specific, i.e. each site can only be accessed by drivers going in one direction on the motorway.
a study by 9European markets (as all new car sales are) it can be expected that the deployment of charging
infrastructure will also happen first in these countries. Accordingly, it is expected that Germany, France
and the UK will be leading the transition as the biggest new car markets.
Recently the European Automobile Manufacturers Association (ACEA) claimed 19 that the provision and
geographical distribution of current public charging infrastructure is “putting consumers off buying electric
cars” because 76% of all charging points are located in 4 countries (Netherlands, Germany, France, and UK).
This misleading claim ignores that use of EVs, like the uptake of any other new technology, will not happen
homogeneously over the continent. Rather in Europe it is likely to occur in several steps or waves, due to
differences in GDP per capita of the Member State, the renewal rate of national vehicle markets and
geographic location. The four top selling EV markets in the EU represent 76% of public charging
infrastructure but also concentrate 75% of the EVs, showing that both EV rollout and infrastructure
deployment is happening in parallel. Since these countries represent such a large share of EU’s GDP and car
sales, it is natural for these countries to be the starting point of new technology adoption20.
Mapping the number of public chargers in each Member State should always be put into perspective with
the size of the car market and the EV market, rather than the correlating the number of infrastructure and
the area of the country (see EV charging infrastructure versus area per country, same ACEA study).
ACEA points out that six countries have low number of public charging points (Cyprus, Greece, Latvia,
Bulgaria, Malta, and Romania). The five EU countries with less than 100 public charging points account for
0.26% of public charging points but only 0.17% of EVs and represent about 1% of new car registrations. 21 As
such these countries cannot be expected to progress sales at the same rate as more wealthy countries.
To better understand the expected EV and infrastructure rollout, we’ve identified groups of Member States
where e-mobility uptake will happen in successive “waves” based on factors explained above:
● Front-runners are most Western and Nordic countries: Austria, Belgium, Denmark, Finland, France,
Germany, Ireland, Luxembourg, Netherlands, Sweden and the UK
● Followers: Italy, Portugal and Spain
● Slow starters composed of EU13 and Greece: Bulgaria, Croatia, Cyprus, Czech Republic, Estonia,
Greece, Hungary, Latvia, Lithuania, Malta, Poland, Romania, Slovakia, and Slovenia.
The Front-runners group is composed of the EU’s 11 most wealthy countries (per capita), these Member
States are identified as market leaders. The region amounts for about 80% of EVs and public charging
infrastructure in 2020 and represents about 70% of the Union’s GDP and sales of cars. As technology
becomes more affordable, e-mobility will spread to the South and East. The uptake in other countries will
likely happen in two “waves”, through which the two other regions will catch up with the leading region
thanks to stronger growth rates. Eventually the share of EVs and public infrastructure will stabilise around
a ratio of 70-20-10 (i.e. same as share of GDP or car sales). Already in 2017, 91% of the registered EVs were
sold in the Front-runners group (1.9% market share) while 8% were registered in the followers group (0.5%
market share) and 2% in the Slow Starter group (0.3% market share).
19
https://www.acea.be/press-releases/article/electric-cars-unrealistic-co2-targets-proposed-by-eu-parliament-
ignore-lack
full study: https://www.acea.be/uploads/publications/Study_ECV_barriers.pdf#page=8
20
These four countries represent 56% of car sales and of the EU GDP.
21
According to updated data from EAFO, Lithuania has less public charging points than Romania and they both have
more than 100.
a study by 10Figure 3 - Comparison of planned EVs and chargers per zone
Based on current trends, the Front-runners’ group is expected to be selling 5-7% EVs by the early 2020’s in
order to comply with car CO2 regulations. Representing around 1 million sales per year this level of uptake
is expected to be sufficient to kick start business interest in deploying recharging points without subsidies.
The Follower countries are expected to reach a similar proportion of sales around 5 years later, 2025; and
the Slow-starters by 2030s.
The vehicle market in Member States from the slow starters’ region is heavily dependent on importation of
second hand cars from Western European countries like Germany. However, early indications are that EVs
are likely to be attractive second hand purchases due to their low running and maintenance costs. It is
therefore expected that initially the first generation EVs in the front-runners group will largely remain within
the country in which they are sold. There are unlikely to be large flows of second hand imports of EVs into
the countries of the slow starters group until the early 2030s. This would suggest there is little need to
develop a comprehensive network of recharging points until the end of the 2020’s.
A heterogeneous EV market uptake does not represent a market barrier as long as in each market, the
number of public infrastructures increases in line with the number of vehicles sold and cross-border
infrastructure networks are fully covered along the TEN-T network. Moreover, gradually diffusion of
technologies is natural and the economics for technology diffusion and adoption are clear; poorer countries
a study by 11catch up with richer countries through technological diffusion by the adoption of advanced technologies
produced in high-income countries 22.
3.2 Costs of EV infrastructure build up
Based upon assumptions and findings from the Fuelling Europe’s Future (FEF) II by Cambridge
Econometrics, the total cumulative costs for public charging infrastructures is estimated to be €12 billion
with about €20 billion investment needed for private charging by 2030 (62% of all infrastructure costs). A
breakdown of costs for the three zones identified previously was also analysed: 23
The charts illustrate very different investment in each of the three regions with about 83% of the cumulative
costs in the front-runners’ group, 12% for Followers and 5% for Slow-starters. 24 The total cumulative cost of
12€ billion for the public deployment of infrastructure across the EU should be put into perspective with the
100€ billion invested every year in transport infrastructures (less than 2% of annual investment until 2030) 25.
22
Microeconomics of Technology Adoption: http://www.econ.yale.edu/growth_pdf/cdp984.pdf
The Economics of Technology Diffusion: Implications for Climate Policy in Developing Countries
http://citeseerx.ist.psu.edu/viewdoc/download?doi=10.1.1.474.6305&rep=rep1&type=pdf
https://ourworldindata.org/technology-adoption
23
The study FEF II assumes that the share of new EV sales are the same for all Member states, however as seen
previously this is very unlikely to happen. As a consequence the technological deployment scenario of FEF II was
used but an earlier or delayed uptake for each region was implemented.
24
The scenario considered assumes an average EV market share of 13% in 2025 and 30% in 2030 and that the front-
runner region is approximately 5 years ahead of the Central Eastern Europe zone.
25
https://www.eea.europa.eu/data-and-maps/indicators/infrastructure-investments/assessment-3
a study by 12In the early phase, investments in charging infrastructure are paid by a mixture of public sector financing
and private investors (e.g. European Commission's funds and blend calls as CEF or Horizon 2020, OEM joint
investments, DSOs, etc..) and utilization of chargers is not (yet) high enough for private companies alone to
be profitable. Later, as the share of EVs in the total fleet increases and the market matures, charge point
operators and other charging services have viable business. Public funding will not be necessary anymore
and infrastructure is rolled-out to answer the growing demand from cars (demand-driven). Competition
among charge point operators to retain good market share pushes private companies to invest in charging
infrastructure before any financial benefit can be made (they aim at securing good locations). According to
the study FEF II, investment in infrastructure deployment will be entirely private in 2025. 26
Already today, there are some examples of public infrastructure deployed without any public money:
● Flanders (Belgium): 2,500 public charging stations will be installed and paid by Allego 27 at their own
costs by 2020 with a least one in each municipality and it is a “self-sustaining business case” according
to the Minister of Energy 28.
● Netherlands: Nuon-Heijmans will install 2,480 points in the provinces of Noord-Brabant and Limburg in
the south of Netherlands without financial contribution from the government subsidy 29.
● EV Point, a Flemish charge point operator, explains that they don’t see a need for subsidies for electric
car charging 30: “as soon as more electric cars drive, the charging stations will also become economically
viable”.
The Dutch fast charging point operator Fastned has claimed that with 50,000-100,000 BEVs (compatible with
CCS or CHAdeMO) on the roads in Netherlands they would be profitable, this represents about 0.6-1.3% of
the vehicle fleet. In Norway fast charging is commercial with as few as 115 000 BEVs, around 3% of the car
fleet. 31 We assume that above 2% of the vehicle fleet 32 then fast charging along motorways will be profitable
and not require subsidy. The rate of phase out of public subsidy depends on several factors including car
density, ratio of households with off-street parking, etc... and cannot be interpreted the same way
everywhere but according to our market modeling based on FEF II data, this 2% share would be reached in
the Front-runners’ group around 2024/5 33, 2028 for Followers and 2030/32 for Slow starters. This EV share
of the fleet marks the point at which market maturity is reached. The business case for slow urban charging
is less clear but there is evidence private operators will step in to encourage use of shops and other facilities.
In brief, we estimate that the need for public subsidy will gradually phase-out in the 2020-2025 period
in the Front-runners’ group. Then, thanks to technological acceptance and spread and economies of scale
we expect a similar development in the other countries.
26
“after 2025, installation in parkings/retail/shopping will be undertaken by the land management business that
operates them to attract higher rents and more customer and, rapid charging will be funded purely by private
investments as the number of EVs on the road will make the business model viable”
27
Allego shows in an infographic that investment in charge points is not necessary http://www.allego.nl/wp-
content/uploads/sites/2/2015/02/Open-markt-model-Allego_DEF.pdf
28
Private individuals can also request additional public charging station (about 1,000 additional chargers)
http://www.tommelein.com/publieke-netwerk-van-laadpalen-voor-elektrische-wagens-van-start/
29
https://www.heijmans.nl/nl/nieuws/nuon-heijmans-plaatst-2500-laadpunten-brabant-en-limburg/
30
https://www.hln.be/regio/wetteren/-2-500-laadpalen-tegen-2020-zonder-subsidie~aba08062/
31
Charging infrastructure experiences in Norway - the world's most advanced EV market, Lorentzen et al., 2017
32
Nearly all BEVs in the future will be compatible with regular CCS or CHAdeMO standards as Tesla cars already have
CHAdeMO adaptors at some stations and the next Renault Zoé will be able to charge in DC.
33
Western leading countries have different characteristics in terms of passenger car transport activity and density of
motorway for example but the transport activity per km of motorway, per km of TEN-T Core network or per passenger
car of countries like Germany and France was relatively similar to those of Netherlands.
a study by 134. Recharging in Cities
Cities are both the destination for many long trips and location of most off-street parking and will therefore
be the location of most public recharging infrastructure. However, as the range of EVs improves to reach
real-world ranges of 400 km, the average urban driver only needs to typically charge once a week, far less
than at present. 34 Charging solutions in cities will be composed of a mix of slow, fast and ultra-fast chargers.
Slow/regular chargers are the solution with the most limited grid impact since powers are lower and
demand can easily be directed to off-peak hours since the car is usually parked at these timers. In cities
slow charger may be found at:
1. On-street charging for drivers that leave their car during the day or the night parked in the street;
2. ‘Park & Ride’ chargers in parking lots with public transport connections that allow commuters to
enter the city center without their car.
In densely populated areas, a demand-driven approach using slow rechargers, as piloted in Amsterdam,
ensures chargers are appropriately located and used from day one and also addresses the issue of uncertain
usage forecasting that makes constructing a robust business case difficult. 50 kW fast chargers typically
charge an EV in about one hour. They are therefore most suited for facilities and amenities where people
typically stay 30 minutes to 2 hours. For example, these locations would be parking lots of stores,
supermarket or commercial zone. There is a strong incentive for owners of such properties to install
chargers to encourage customers to their facilities.
Ultra-fast charging sites near cities are ideal for tackling range anxiety and recharging for those users
without off-street parking or access to a slow charging site. They are particularly appropriate for shared
electric cars enabling these to be operative most of the time. Studies have shown how the provision of fast
charging infrastructure is a strong driver for EV uptake. For example a first study has shown that providing
charging solutions above 50 kW close to urban areas increases the annual EV kilometers traveled 35 by about
25% (even in cases where it was used for less than 5% of total charging events). A second study 36 has shown
that fast charging is a stronger driver than standard charging and confirms that access to fast chargers
increases daily electric distance travelled.
There are indications users prefer to use ultra-fast chargers for both inter- and intra-urban travel. 37 A
network of fast chargers may therefore prove to be more popular and cheaper than installing a large
number of slow chargers in cities. Fast chargers do however incur greater impact on the electricity grid and
less readily balance renewables and cannot be so smart. The optimum balance of slow and fast charging in
urban areas may therefore depend to some extent on the capacity of the local electricity grid to
accommodate fast charging and possibly differential charges.
In China, there are several examples of charging hubs serving many types of vehicles. For example, the Qian
Hai charging station can charge 60 vehicles simultaneously (maximum capacity of 3 200 kW) and is used by
taxis (50%), vans (30%), passenger cars (10%) and buses (10%). The project Mega-e, also aims to bring
multimodal charging hubs including ultra-fast chargers to metropolitan areas. Providing a mixture of
services can potentially help to balance demand throughout the day and night but may require
considerable space to park vehicles before and after charging overnight.
34
40-50 km per day in average in the EU
35
https://www.energy.gov/sites/prod/files/2017/10/f38/XFC%20Technology%20Gap%20Assessment%20Report_FINAL
_10202017.pdf
36
Neaimeh et al., 2017, based on data from 90,000 fast charge events in the UK and US
37
Blythe et al., 2015
a study by 14Costs for a network of fast chargers may be less than for slow charge systems if grid reinforcement is not
required. For example; for a city of 1 million inhabitants (e.g. Brussels or Cologne); where a high proportion
of drivers do not have access to off-street charging according to the ICCT’s benchmark, 38 there would be
85,000 BEVs in a ‘high electric vehicle market’ 39 scenario. If half of these would not have access to off-street
parking40 they would require around 300 public fast chargers; 41 or between 8,500 and 17,000 standard L2
chargers. 42 Based on the costs used by Cambridge Econometrics in FEF II study 43, the total cost to supply
infrastructure to this city would be around €45.8M with fast chargers and between €54.4M and €108.8M with
standard L2 chargers. Approximately half in the fast charging case. For consistency between the two
scenarios, this case study excludes PHEVs (that would not be using fast chargers as much), any high-
utilization vehicles (taxis, on-demand transportation, etc…) and any major grid upgrades at city level. In
conclusion, implementing fast charging hubs in urban area seems like a cheaper solution than providing
extensive coverage of regular L2 charging infrastructure on the streets.
According to ICCT, in the case were drivers do not rely exclusively on public fast charging, a city of 1 million
inhabitants would actually only need about one fast charger for 700 BEVs, which would cost €18.5M.
Access to a higher voltage power supply is essential but not usually an issue as a medium voltage grid exists
in many places within urban areas to serve industrial or commercial buildings and metro/train/tram grid
infrastructure. The charging hubs have thus to be strategically placed at these locations to eliminate high
costs of extending the high voltage power source to the desired place. Based upon the same case study
about 2,400 BEVs would neecd to be charged each day. If all the charging focused on 4 hours 44 (an extreme
worse-case scenario) peak power demand would be 45 MW at the city level. For countries that are highly
industrialized, the amount of power needed for a city of 1 million is about 1,000 - 1500 MW, 45 the demand
from fast charging would then increase total load by about 3-5%. This load is a relatively low fraction of the
total city consumption but could require some additional costs as it would likely occur during peak-times.
However, many strategies exist to mitigate fast-charging grid impacts and can be easily implemented. For
example combining fast charging with energy storage that dischargers at time of peak demand and
implementing time-of-use rates are solutions. 46
Charging EVs in cities remains the most difficult challenge but fast charging hubs undoubtedly offer part of
the solution when located appropriately.
38
ICCT, August 2018 (benchmark of fast chargers supply for given metropolitan area population sizes):
https://www.theicct.org/sites/default/files/publications/ZEV_fast_charging_white_paper_final.pdf
39
In average in Europe, there’s about one car for two inhabitants and looking at specific European cities indicate a
ratio between 0.3 and 0.5 cars per inhabitants in cities. In this situation the share of EVs in the city’ fleet is between
17% and 28%, this level of penetration might not be seen much in the next ten years.
40
Assumptions: 40% of car-owning dwellings do not have access to a garage or other off-street parking (see below for
UK), half of them can’t charge at work. Source: UK statistics (DCLG, 2010b) and the SHCS
(https://www.racfoundation.org/wp-content/uploads/2017/11/spaced_out-bates_leibling-jul12.pdf)
41
i.e. around 50 BEVs per fast charger or 300 BEVs per fast charger at city level. One charger for 300 BEVs sufficient for
all BEVs to charger during peak hours (see B. Grid impact). As the population of BEVs increases within a country, one
fast charger can support more BEVs since initial stations are likely to be under-utilized (50-300 BEVs per fast charger
for major markets in 2016-2017) and 700 BEVs per fast charge point in a ‘high electric vehicle market’, (ICCT, 2018).
42
The ratio of BEV per public charger is between 0.5 and 1.
43
Fast charger cost (150 kW): €152,750 (€20,500 for civils, €41,000 for the equipment, €5 for the installation and €86,250
for grid costs. Grid costs are likely to be conservative since in urban areas sites with ample capacity are abundant.
Standard L2 charger (11-22kW): €6,400 (€1,400 for the equipment, €5,000 for the installation, and the grid connection)
44
Assumptions: 400 km range, 0.175 kWh/km energy consumption, 30 minutes stops at 150 kW chargers to replenish
the battery. 40-50 km average daily mileage.
45
1 MW powers approximately 1,000 homes
https://www.quora.com/How-much-electricity-does-an-industrialized-city-of-1-million-people-consume
46
Lessons learned on early electric vehicle fast charging deployment, ICCT https://www.theicct.org/publications/fast-
charging-lessons-learned
a study by 155. Conclusions & policy recommendations
This study highlights the good progress being made in Western and Northern Europe to develop a basic
infrastructure to recharge electric cars. It demonstrates that by 2020 a network of fast chargers will be
available along the main motorway networks in these countries to enable EVs to be used for most journeys.
The availability of public charging in many cities in Western and Northern Europe is also sufficient for drivers
to recharge their cars but may not yet be adequate to encourage those without off-street parking to make
the shift to EVs – with the notable exception of the Netherlands where innovative policies are enabling EVs
to become practical for almost all users.
In these countries, that represent the overwhelming majority of EV sales the chicken and egg dilemma is
largely resolved. The basic infrastructure is in place and it is reasonable to anticipate business will now
provide most of the investment required as sales increase and the share of EVs grow. Some incentives may
be needed at less optimal sites – especially city centre slow charging but by the mid 2020’s the market is
expected to be self-sustaining. Current modest sales of EVs are largely the result of minimal supply, limited
marketing and discouraging salesmen all of which are within the control of the car industry to address – as
they are expected to do to ensure 2020/1 CO2 targets are met.
The availability of recharging points in southern, central and eastern Europe remains much more limited –
but still in line with the very small number of vehicle sales. However, a basic infrastructure of fast chargers
along highways is being established. The slower progress in these markets is not a barrier to the shift to
electromobility as sales are likely to lag those in western and northern Europe by five to 10 years. In
summary there is time to build the infrastructure that will be needed as the market expands in these
countries. It is nevertheless clear that some level of financial support will be needed to build the basic
infrastructure in these markets until the late 2020’s.
Beyond 2020 the European Commission has announced a commitment to spending at least 60% of the EU’s
cross-border infrastructure fund on schemes that help the fight against climate change. Under the proposed
budget, 47 the Connecting Europe Facility (CEF) will have €42.3 billion, of which €30bn will go to transport.
The proposal also says 60% of the overall €42.3bn must be used for ‘climate spending’ to assist in tackling
climate change. These funds provide the basis from which to support the shift to electromobility and build
the infrastructure needed. There does not appear to be a shortage of money. With this in mind T&E has the
following guidance for policy makers.
1. EU investment in infrastructure must be targeted. Substantial sums of private money are already
being invested in building recharging infrastructure in some locations and it is important public
money is spent in competition. It is also essential to avoid a culture of subsidy and public-private
partnership is essential. Incentives will be needed to develop a comprehensive network of
recharging to cover less heavily trafficked and populated areas – just as is necessary for the privately
owned mobile phone network. In the early 2020’s EU funds to support infrastrucuture will be
appropriate across the Union but become progressively focused in first the south and then the east
as the EV market matures.
2. The Alternative Fuels Infrastructure Directive should be updated. The AFI appears to have been
successful in implementing a basic infrastructure but the indicators (1 charging point per 10
vehicles) are crude and not appropriate. It is also clear different member states need to develop
recharging in different ways and at different times. The early experience of the AFI should be used
to develop a plan for infrastructure rollout that in particular integrates recharging with renewables
47
http://europa.eu/rapid/press-release_IP-18-4029_en.htm
a study by 16roll-out. For example; in places with a high share of wind overnight charging will be most beneficial
whilst in solar dominated areas afternoon charging is optimal. In particular the ambition on
deployment on TEN-T Core and Comprehensive networks should be raised to have full coverage of
TEN-T Core network by 2020 and TEN-T Comprehensive network by 2025 using CEF funds.
3. The EU should create a fund dedicated to urban recharging. Striking the balance between
encouraging electric car sharing; and providing slow or fast charging for cars without off-street
parking will be a challenge for cities whilst also seeking to accelerate the transition to
electromobility and funds will be crucial both for charging points and grids upgrades. European
think-tank Brugel suggests that “such a fund could be created by making better use of existing
financial resources, such as from the Connecting Europe Facility for Transport (CEF-T) or from the
Structural and Cohesion Funds. For the period 2014-20, CEF-T has a budget of €24 billion (European
Commission, 2018a), while the Cohesion Fund and the European Regional Development Fund have a
budget for transport and energy network infrastructure of €71 billion”. Similar mechanism has existed
in the past, with the successful example of Wifi4EU 48. This fund could be directed in priority to cities
with bad air quality, little resources, or in outreach/peripheral regions to reinforce EU cohesion and
preventing market or health gaps. This could be a big help for cities that often lack resources or
private investment and are currently unable to access EU funds directly. Municipalities should be
able to apply directly to these funds and bypassing ministries which would make it more accessible
since the bureaucracy of EU funding mechanisms has reportedly been a big hurdle and a
discouraging process. This fund could also be very useful for cities to upgrade their grid (see below).
4. Investment in grid upgrades is a priority. In some locations local peak loads will increase as more
EVs are charged requiring upgrading of local grids. Smart charging can reduce peak loads but in
some locations and whilst McKinsey doesn’t expect EVs to substantially increase the power demand
by 2030 some grid reinforcements and upgrades will be needed to prepare for tomorrow’s
integration of EVs in the energy system. The EU funds could provide a potential contribution to
these costs.
5. Tackling the barriers to recharging for tenants. Today, many tenants face huge administrative,
time and cost barriers to installing a private charger in multi-occupancy buildings even where they
have a parking space. 49 City underground parking must also be considered in this framework. But
strict fire safety measures often prevent installation. Similarly Governments need to put in place to
private off-street charging mentioned above, work charging if key for adoption of e-mobility.
Companies should play a leading role in the acceptance of the e-mobility ecosystem and the
adoption of new habits. More than half of the car registrations in the EU are made by companies,
this create an exceptional chance for private companies that care about the environment and public
health to drive the change. National action is needed on all these issues. 50
6. Create tailored loan and grant schemes for small and medium enterprises. Small innovative
players that are taking the initial loss and risks usually face difficulties to provide the bank
guarantees or the inspire the confidence required by investors or institutions. This is also partly due
to the uncertainty in the speed of the e-mobility market uptake and could be improved with long
48
Each Member State had a minimum of 15 “vouchers” of €15,000 for municipalities to apply directly (via simple
website) in order to build infrastructure. The Commission judges and selects the projects and each municipality is
limited to one “voucher”.
49
https://www.golem.de/news/elektromobilitaet-regierung-bremst-bei-anspruch-auf-private-ladesaeulen-1807-
135521.html
50
Only ground level and one level below ground (-1). Total power cannot exceed 500kW, fire-proof walls every 10 EVs,
etc..
a study by 17term targets and regulations. Moreover, this could also be improved if CEF money was dedicated to
risk mitigation and supporting low or zero interest rates for e-mobility. Such low-risk bank loans
would encourage private investment without being a burden on the budget.
7. A seamless e-mobility service. The user experience should be improved by adoption of open
standards, streamlined payment options and transparent and fair pricing. Some e-mobility service
providers (eMSP) providing the customer-facing service to EV drivers do not allow access to their
service to unregistered users which means that they are not able to charge. As it was done for
telecommunication roaming fees in Europe, eMSP should grant universal access to their charging
services. According to a recent survey by the ICCT, the complex and variable pricing structures
causes uncertainty to consumers seeking to fast-charging networks.
The biggest constraint on the 51shift to electromobility is the availability of vehicles to buy and as a result
carmakers are failing to achieve their own targets for sales of battery electric and plug-in hybrid models as
they do not increase the offer of these vehicles fast enough. Whilst manufacturers complain about a lack
of recharging infrastructure and incentives, there are just about 30 battery and fuel cell electric models on
sale compared to about 370 conventionally-fuelled models. But it is now clear many models are simply
not available for sale in showrooms and others have long waiting times.
The very limited choice of electric cars, long waiting times to receive these cars, limited availability and
crucially a lack of adverting investment are contributing for carmakers’ lack of sales. Data purchased from
leading marketing analytical company Ebiquity shows that carmakers are making very little effort to
market electric models. Whilst around 30% of British, French and German consumers say they would
consider buying an electric car, just 1.5% of advertisement spend was on zero emission models and 1.4%
on plug-in hybrid models in the EU’s largest car markets: Germany, France, UK, Italy and Spain.
Across the EU, advertising spend is likely to be significantly lower than this percentage as little promotion
of zero emission models is likely out of the major new car markets. In Norway (where 4 out of 10 cars sold
were battery or plug-in hybrids in 2017), OEM’s advertising spend on zero emission cars as a proportion
was much higher (10%), indicating companies tending to follow demand rather than creating a new
market. Analysis of future market growth by carmakers shows expectations are for strong growth, such
that by 2025, 26% of new cars sold are expected to be electric.
But past performance suggests without regulations they will fail to achieve their aspirations. This is why
the forthcoming car CO2 regulation is so important in defining the speed of transition to zero emission
solutions and in particular a binding sales target of 20%, either through a sales target or through a
crediting-debiting system for Zero and Low Emission Vehicles, along with CO2 reduction targets of 50-60%
in 2030, and 25% in 2025.
Many companies (e.g. charge point operators, e-mobility service providers, DSOs, etc…) have anticipated
and invested in the transition to e-mobility. However due to low number of electric cars on the road today
and thus low utilization of their services and infrastructures, their business is not yet viable. It is a market
failure regulation must address.
51
https://www.transportenvironment.org/sites/te/files/2018_06_EV_announcements_report.pdf
a study by 18Annex: Planned European ultra-fast charging networks
Name #stations Partners Location Comment
#sites
Ionity 400 / BMW, Mercedes, 24 countries By 2020
~2,400 Ford, VW Group Partner with Shell
(Porsche and Audi)
Ultra-e 25 / ~100 Allego, Audi, BMW, Netherlands (5), Completion by summer 2018.
Magna, Renault, Belgium (4), Germany Sites at average distance of 150-
Hubject (12) and Austria (4) 200 km
E-Via Flex-E 14 / ~60 Enel (coordinator), Italy (8), Spain (4),
EDF, Enedis, France (2
Verbund, Nissan,
Renault and Ibil
MEGA-E 39 / 322 Allego 20 countries (Central Focuses on metropolitan areas
Europe and with e-charging hubs
Scandinavia)
Central European 118 / N.A. Verbund Austria, Czech EU financed 20% of the total
Ultra Charing (coordinator), Republic, Italy, cost (€12M out of €61M)
CEUC, Enel X, Hungary, Romania,
Smatrics, Bulgaria and Slovakia
Greenway, OMV
NEXT-E 30 / N.A. E.ON, MOL, HEP, Czech Republic, 222 fast (50kW) chargers are
PETROL, Nissan, Slovakia, Croatia, also included
BMW Hungary, Slovenia,
and Romania
E.ON x Clever 180 / N.A. E.ON and Clever Germany, France, 2-6 chargers per station
Norway, Sweden, UK,
Italy and Denmark
Instavolt network N.A. / 200 Instavolt UK Equipement from ChargePoint
Fastned network 25 Fastned Germany, Equipement from ABB.
Netherlands, UK More sites expected
Pivot Power and 45 / 100 UK 50 MW battery storage
the National Grid
EnBW 100-1000 52 EnBW and OMV Germany 2 chargers per sites first,
/ 800 cooperation with gas provider
OMV, focus on urban areas
Porsche (private) N.A. private network, cooperation
with gas provider OMV
52
The arrangement between enBW and OMV is part of a wider strategy that will see the South German utility provide
and maintain more than 1,000 ultra-fast charging sites by 2020.
a study by 19You can also read