Romania Market Overview 2020 - 2021 Inside -Out - Real Estate Report - Knight Frank
←
→
Page content transcription
If your browser does not render page correctly, please read the page content below

Real Estate Report

Romania

                     knightfrank.com/research
Market
Overview
2020 - 2021
Inside -Out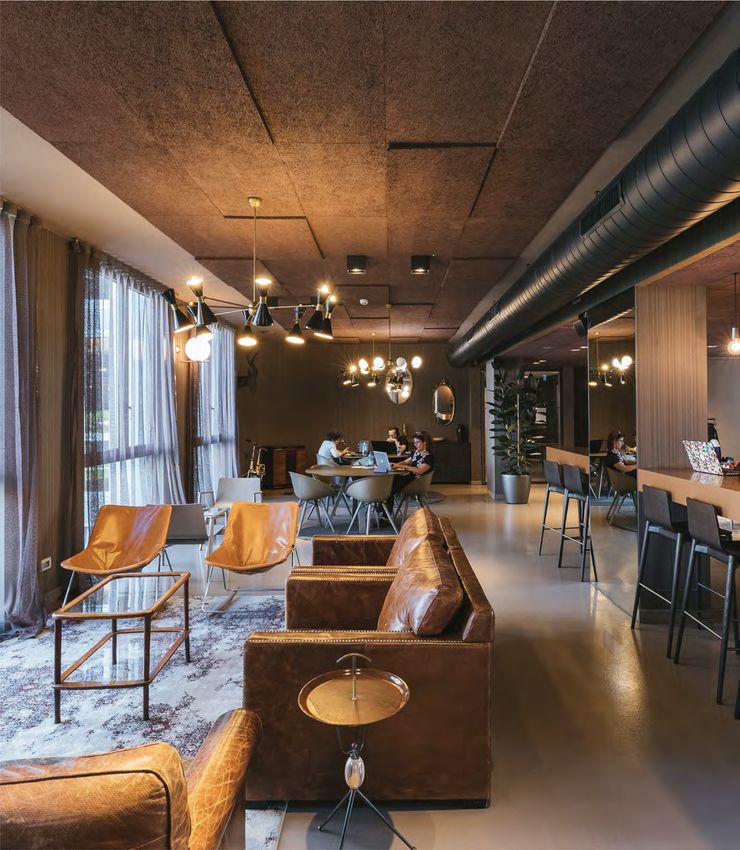
Contents
           4-9
           Economic Overview
                                    10-17
                                    Office Market

           18-19
           Capital Markets
                                    20-23
                                    Residential Overview

           24-27 28-29
           Industrial & Logistics   Land Market
           Market

           30-35 36-37
           2021: Workplace Trends   Real Estate Taxes

           38-39
           Legal Challenges
Positive                          The recent macro-financial developments (global, European,
                                  and domestic) point out the entry of the real economy into

  prospects
                                  the post-pandemic cycle, an evolution supported by the
                                  launch of the vaccination campaign and by the
                                  implementation of an unprecedented expansionary
                                  policy-mix.

                                  THE DYNAMICS OF THE                According to the PMI
                                  GLOBAL PMI INDICATORS              Composite indicator the
                                                                     world economy

for the economic
                                                                     increased for the sixth
                                                                     month in a row in
                                                                     December, as the

        year 2021
                                  Aug-16
                                                                     persistence of the
                                  Dec-16                             health crisis was
                                   Apr-17                            counterbalanced by the
                                                                     unprecedented
                                  Aug-17                             expansionary
                                  Dec-17                             policy-mix.
         dr. Andrei Radulescu
                                   Apr-18
               Director Analiza                                      There can be noticed
              Macroeconomica      Aug-18                             the advance of the
                                  Dec-18                             manufacturing (the
                                                                     engine of the economy),
                                   Apr-19
                                                                     an evolution confirming
                                   Jul-19                            the entry into a new
                                  Nov-19                             cycle. On the other
                                                                     hand, the services
                                  Mar-20
                                                                     decelerated in
                                  Jul-20                             December, due to the
                                  Nov-20                             persistence of the
                                                                     pandemic in Europe and
                                  Mar-21
                                                                     North America. The
                                   Jul-21                            recent developments of
                                  Nov-21                             the global PMI
                                                                     indicators are
                                  Mar-22                             represented in the
                                   Jul-22                            following figure.
                                  Nov-22
                                  Mar-23
                                   Jul-23
                                  Nov-23
                                                                     Sources:
                                  Mar-24                             Markit Economics
                                   Jul-24                            and Bloomberg
                                  Nov-24
                                                                         Manufacturing
                                            20 30 40 50 60               Services

                                                                                               5
Knight Frank Romania Market Overview 2020
The positive climate on the DYNAMICS THE GROSS FIXED
The USA economy (the largest of the THE YOY DYNAMICS OF THE GDP IN CHINA % international financial markets has
world) increased for the seventh Sources: Bloomberg recently consolidated (the stock
CAPITAL FORMATION AND PRIVATE
month in a row in December, with an CONSUMPTION IN ROMANIA
indices at record high levels in USA
accelerating pace, according to the 4Q 93 and Germany), evolutions that
ISM (Institute for Supply Sources: Bloomberg
4Q 94 express positive prospects for the
Management) indicators, an
dynamics of the real economy in the
evolution supported by the optimism 4Q 95
coming quarters. We underline the 50
induced by the start of the 4Q 96 fact that the volume of the IPOs hit
vaccination campaign and by the
4Q 97 record high level in 2020, as the 40
policy-mix prospects (the
incidence of the pandemic and the
implementation of additional 4Q 98
consequences of this exogenous
stimulus, as signalled by the 4Q 99 30
shock were counterbalanced by the
incoming Biden Administration).
4Q 00 implementation of an
4Q 01 unprecedented expansionary 20
On the other hand, the economy of
policy-mix.
Euroland (the main economic partner 4Q 02
60
of Romania) contracted in 4Q 03 In Romania the economy declined by
December, according to the dynamic
4Q 04 5% YoY during January-September 50
of the PMI indicators. This evolution
2020, a better evolution compared
was determined by the adjustment 4Q 05
with that of Euroland (decline by over
of the services sector, due to the 40
4Q 06 7% YoY). We underline the fact that
restrictions implemented to counter
4Q 07 Romania was the only one country of
the persistence of the pandemic.
the European Union reporting a 30
4Q 08
positive YoY pace for the gross fixed
However, there can be noticed the 4Q 09 capital formation in 1Q, 2Q and 3Q of 20
increase of the Chinese GDP (the
4Q 10 2020. This evolution expresses
Nov-20
second largest economy of the
Mar-20
Dec-18
Dec-16
Aug-18
Aug-16
Nov-19
Dec-17
Mar-21
Aug-17
Jul-20
Apr-18
positive prospects for the quick
Apr-19
Apr-17
Jul-19
Jul-21
world) by 2.3% YoY in 2020, slowing 4Q 11
transition from the post-crisis cycle
down from 6.1% YoY in 2019, the 4Q 12 towards a new cycle.
slowest pace since 1976. 4Q 13
In Romania the economic 4Q 14 According to the core macroeconomic scenario of As regards the private consumption (the main
confidence and the risk perception 4Q 15 Banca Transilvania (recently updated) the component of the GDP) we forecast an increase by
improved at the end of 2020 and at Romanian economy may increase by an average an average annual pace of 2.1% during
4Q 16
beginning of 2021, as can be noticed annual pace of 2.5% during 2020-2022. In this 2020-2022, an evolution supported by the
4Q 17 scenario the adjustment during 2020 (determined prospects for the policy-mix to maintain
from the following graph
(representing the dynamic of the 4Q 18 by the outbreak of the pandemic and its accommodative.
CDS indicator for the 5 YR maturity). 4Q 19
consequences) would be counterbalanced by the
expected strong dynamics in 2021 and 2022. For the public consumption our forecasts point to
4Q 20 an increase by an average annual pace of 4.5%
-8 -4 0 4 8 12 16 This perspective is supported by the positive during 2020-2022, given the prospects for the
5 YR CDS ROMANIA prospects for the gross fixed capital formation, implementation of the EU programs.
Sources: Bloomberg given the following factors: the favourable
development during 2020 (despite the adjustment In terms of the financial side of the economy we
of the economy in the context of the pandemic); forecast an evolution of the average annual
0 the persistence of the real financing costs at a inflation (HICP basis) within the target of the
low/affordable level; the implementation of the National Bank of Romania (NBR) in the coming
programs launched by European Union in 2020 quarters. In this context, we expect the central
-4 (including the Next Generation and the multiannual bank to maintain the accommodative approach.
financial framework 2021-2027).
Last, but not least, we forecast the convergence of
-8 We forecast the increase of the gross fixed capital the financing costs towards the levels in the
formation by an average annual pace above 6% Eurozone and the gradual appreciation of the
Sept-24
Sept-24
May-24
May-24
Dec-24
Dec-24
Dec-23
Aug-24
Aug-24
during 2020-2022, with spill-over impact for the EUR/RON from the mid-run perspective.
Nov-24
Nov-24
Feb-24
Feb-24
Mar-24
Jun-24
Jun-24
Jan-25
Jan-25
Jan-24
Jan-24
Oct-24
Oct-24
Apr-24
Apr-24
Jul-24
Jul-24
other components of the GDP.
6 7
Knight Frank                                                                     Romania Market Overview 2020

               In our view the main risks for the evolution   incidence of the pandemic and its
               of the Romanian economy in the coming          consequences.
               quarters are: the
               global/European/regional macro-financial       Last, but not least, we underline the
               climate, with impact for the allocation of     increasing probability for Romania to
               flows towards the emerging markets; the        launch the negotiations to join the OECD
               dynamics of the health crisis and the          (Organisation for Economic Cooperation
               speed of vaccination campaign; the             and Development) in 2021.
               domestic policy-mix; the geo-political
               climate.                                       We point out that Romania is the favourite
                                                              on the European continent to join the
               We underline that the outbreak of the          OECD, a process mainly dependent on the
               pandemic pointed out the development           accomplishment of several fundamental
               and transformation opportunities, at           criteria, such as: the democratic society,
               global, European, and domestic levels.         the respect of the rule of Law and of the
                                                              human rights; the market economy status,
               For instance, Romanian economy                 with a high level of openness and
               presented an evolution around potential        transparency.
               when the pandemic hit the country, but
               with twin deficits and a low manoeuvre         In this context, we underline that in 2019
               room in terms of policy-mix.                   GDP/capita in Romania represented
                                                              65.6% of the level in Eurozone and 69.5%
               On the other hand, the Romanian                of the OECD level.
               economy was endowed with domestic
               resources (human, Digital and financial)       On the other hand, we mention the
               when the pandemic hit the economy, a           challenges for the sustainable economic
               better stance compared with other              development and convergence processes
               shocks (especially endogenous).                of Romania: the incorporation of the Digital
                                                              Revolution, the increase of the R&D
               Immediately after the outbreak of the          allocations and the improvement of the
               pandemic the policymakers implemented          tertiary education indicators.
               aggressive expansionary measures, to
               counter the impact of the health crisis,
               despite the low level of the manoeuvre
               room. This was possible due to the
               change of paradigm in terms of public
               finance and to the unprecedented
               expansionary monetary policies
               implemented by the Federal Reserve in
               USA and European Central Bank in
               Euroland and the programs launched by
               the European Union in the context of the
               health crisis.

               Consequently, Romanian economy
               presented a better performance at least
               compared with the dynamics across the
               Euroland (the main economic partner).
               Furthermore, the gross fixed capital
               formation continued to increase YoY in
               2Q2020, the quarter with the toughest
               adjustment of the real economy since the
               beginning of the 1990s.

               In other words, the productive basis of the
               economy was not hardly hit by the

8                                                                                                           9
Knight Frank                                                                                                                                                        Romania Market Overview 2020

                Bucharest                                                                                                   Baneasa

                     Office
                                                                                                                                                    Pipera
                                                                                                                                                     North

                                                                                                             North - West                      Dimitrie
                                                                                                             Expozitiei                        Pompeiu
                                                                                                                                 Floreasca/

                  Market
                                                                                                                                       Barbu
                                                                                                                                 Vacarescu

                                                                                                                        Central
                                                                                                                        Business
                                                                                                                        District

                                                                                                                                                             East

Demand                                                                                                West
                                                                                                              Central
                                                                                                              West
                                                                                                                                      Center

 237,500
     sq m

2020 witnessed a total take-up for class A and B offices     Looking at transaction types,                                              South
of approximately 237,500 sq m, representing only 60%         renegotiations and renewals were
from the amount transacted the year before. 162              the most prominent drivers of tenant
transactions were signed in 2020, compared to 232 in         activity, accounting for approximately
2019.                                                        45% of the total take-up, as many
                                                             companies wanted to avoid or to
Larger transactions of over 5,000 sq m were again on         reduce the relocation risks. Although
top, accounting for a 35% share of the total take-up. This   in 2020 pre-leases accounted for a
was followed by transactions between 1,000 sq m and          smaller percentage of the total,
3,000 sq m with a 30% share. When looking at deals by        respectively 16%, it is worth
number, the most numerous were those below 1,000 sq          mentioning that the largest pre-lease
m, accounting for almost 60% of the total take-up,           transaction is in the top 5
followed by transactions between 1,000 sq m and 3,000        transactions signed in 2020, namely
sq m with 26%.                                               KPMG pre-lease of ~8,500 sqm in
                                                             Miro.

                                                                                                                                                                  Main
The most sought after submarkets in 2020 were
Center-West, which saw almost 63,000 sq m of leasing         IT & Communication sector still
activity (26% of total take up) and Dimitrie Pompeiu,        makes up the largest share of
where 37,000 sq m of space was leased (16% of total          demand, accounting for 36% of the
take up), followed closely by North-West Expozitiei area
with ~32,000 sq m (14% of total take up).
                                                             total take-up, totaling ~85,000 sqm
                                                             (200,000 sqm in 2019).                                                                            Business
                                                                                                                                                                 Hubs
10                                                                                                                                                                                             7
Knight Frank                                                                                                                                                                   Romania Market Overview 2020

                                                                                        It is not worse
                                      What a decade                                           than in the
                                                                                                  global
                                              we had!                                          financial
                                                                                                  crisis!
                                                                        3-year cycles

      200k to
        250k
               sq m
                                       250k to                                          Supply                                                              Recovery will be
                               2
                             01

                                                                                                                                                            significantly shorter as now
                                         300k
                           -2

                                                                                                                                                            we have the money!
                                                                                        155,000
                       10

                                                                                                                  sq m
                      20

                                                sq m

                                                             5
                                                            01
                                                         -2                             2020 saw class A and B supply reach approximately
                                                                                        155,000 sq m, around 50% decrease compared
                                                        13

                                                                                        to the year prior, driving the stock to 2.955 million
                                                       20

                                                                                        sq m.
                            Before
                           Covid-19                         300k to                     Among the schemes, Ana Tower is the largest
                                                                                        (~34,000 sq m), followed by Globalworth Campus III

               350k          to
                                    400k                      350k                      (~33,000 sq m), One Tower (~24,000 sq m) and The
                                                                                        Bridge III (~21,000 sq m).                                             YEARS    2008     2009      2019    2020
                                                                 sq m

                                                                                  8
                                                                                        The submarket with the highest modern office
                      After Covid-19                                            01      stock is Calea Floreasca / Barbu Vacarescu

               350k                 237k
                                                                             -2
                                                                                        (544,000 sq m), followed by Center West area
                              to                                                        (457,000 sqm) and Dimitrie Pompeiu (441,000 sq m).
                                                                           16
                                                                        20

                             sq m
                                               1
                                            02

                                                                                                                                                               DEMAND
                                                                                                                                                               (SQ M)   230k      90k      388k    237K
                                           -2

                                                                                                                                DEMAND BY

                                                                                                                         2020
                                       19

                                                                                                                                LEASED AREA                                       61%              40%
                                      20

                                                                                                                                35%
Knight Frank Romania Market Overview 2020
SUP P LY VS. DEMAND
2020
BY TENANT
D E MAN D sq m
ACTIVITY
Other
Demand Supply 5%
DEMAND BY TYPE OF
sqm
TRANSACTIONS
4% Manufacturing/Industrial/Energy
400.000
4% Retail
Relocation/
2% Transport & Cargo 46%
New Demand: 180k
Renegotiation/
45%
Pre-lease: 100k 26% Renewal: 107k
300.000
36% IT & Communication 1% Administrative
Renegotiation/ Relocating &
20% 32% New Demand: 76k
Renewal: 76k
14% Finance/Banking/Insurance 1% Consumer Services & Leisure
Expansion: 31k 8% 16% Prelease: 38.5k
13% Professional services 1% Media & Marketing Total: 388k Expansion: 15.5k
7%
200.000
2020
9% FMCG 1% Construction & Real Estate Total: 237k
2019
9% Medical & Pharma 1% Agriculture
100.000
DEMAND
0
2020
2010
2014
2018
2016
2015
2019
BY SUBMARKET
2012
2013
2017
2011
2020
Rents
The year of
45%
7% Baneasa - Otopeni
Renegociations/
The headline rents are rather at or slightly
below pre-COVID levels. The incentive 26% Center West 7% Central Business District
packages have improved slightly in favour of
renewals
the tenants, especially in case of properties
with high vacancy rates where landlords are 16% Dimitrie Pompeiu 4% South
more flexible and really want to attract new
tenants. Incentive packages are roughly
3% Pipera North
estimated to be ~10-20% higher on 14% North-West (Expozitiei)
short-term, depending on the vacancy in
the respective property, on the size and 11% Floreasca/Barbu Vacarescu 2% West
length of the transaction. In many cases the
increase in incentives was/will be
corroborated with a longer lease term. 9% Center 1% East
14 7
Knight Frank Romania Market Overview 2020
DEMAND BY
COVID-19
2020
NUMBER OF
12%
TRANSACTIONS Many leasing requirements have been
postponed or slowed down given the
Vacancy
uncertainty associated with the medical
61% 5,000 sqm with the one from 2015. Additional their office space.
to this available space, numerous
tenants have expressed the desire Some of the companies have returned to
to sub-lease parts of their office
MODERN
their offices since the end of the lockdown
space, part of their strategy to in the second half of May, with employees
adapt to the new way of work. As a coming mainly to the office in shifts (e.g.
OFFICE STOCK sq m result somewhere around 50,000
sqm are estimated to be
every other day/ week). Companies with a
large number of employees are more
ANNUAL EVOLUTION available in sub-lease offers. reluctant to return to the office given the
increased complexity of the returning plan
and process, the higher risks (e.g. to have a
COVID outbreak within the company) and
STOCK BY costs for supplies (e.g. disinfectants,
masks). In order to respect the social
2010 distancing the preferred approach seems
SUBMARKET to be the rotation of the employees
coming to the office.
2011
For projects under construction, the
2012 owners have started to adapt the
installations and equipment to reduce the
risks of covid: provide more fresh air
2013
through the ventilation system and install
better quality filters, more opening
2014 windows, smarter lifts, etc.
2015
Forecast
255,000
2016
Floreasca/
2017 18% Barbu Vacarescu 7% Pipera North
15% Center-West 5% Baneasa
2018 in the next
sqm
15%
Dimitrie
Pompeiu 5% West 12 months
2019
12% Center 2% East Including schemes such as by: J8
Central Business
Office Park (~45,000 sq m), @Expo
2020 11% District 2% South Campus I (~22,000 sq m), Miro Offices
North-West (~21,000 sq m), Tiriac Tower (~16.500
8%
0 750k 1.5m 2.25m 3m (Expozitiei) sq m), Dacia One (~12,500 sq m), etc.
16 17
Knight Frank Romania Market Overview 2020
Capital
Transaction 8.25%
distribution by
property type 7%
2020
7%
Office
Markets
Prime
Yields
Retail
Industrial
Hotel
Office
100%
50%
25%
75%
Retail
Industrial
0 250 500 750 1000 Investment
volume
881 m
EUR Stable outlook
2010 662
2020 started with a clear downward pressure on
2011 267 yields however following the post-lockdown period
the yields stabilized and the overall sentiment
2012 244 remains stable for the moment. Consequently, the
In 2020 we witnessed a total of EUR 881
yields on the local market remain at very
million in transactions on the local market a
2013 303 competitive levels compared with other similar
level which is above the volume that was
markets in the region and it is expected that these
reported previous year and also above the
2014 964 levels will continue to further attract both local
expectations from mid 2020. The record
and foreign capital.
transaction that was reported on the
2015 608 market is the NEPI office portfolio which
was sold to AFI for an amount in excess
Forecast
2016 705 of EUR 290 million. Despite the fact that
the pandemic and associated uncertainty
0.9bn
2017 905 led to a significant delay, the closing of this
transaction and several other significant in 2021
2018 973 transactions confirmed the maturity and
EUR
attractiveness of the local market.
2019 650
Following to the trend from previous years,
2020 881 the office segment was the most Judging by the existing pipeline of projects that
attractive in terms of transaction volumes, are currently on sale on the market it is expected
generating more than 80% of the total that in 2021 we will have at least the same volume
market volume. The industrial/logistics of transactions with an upside potential to get
ROMANIA INVESTMENT segment was the second most active in closer to the EUR 1 billion threshold. The maturity
terms of volume generating roughly 10%
m. EUR
TRANSACTION VOLUMES of the total volume, followed by the retail
of the market and the competitive prices make it a
viable destination for the significant amounts of
segment which accounted for almost 5% capital that have been raised globally and are
ANNUAL EVOLUTION of the total volume. expected to be deployed in 2021.
18 19Knight Frank Romania Market Overview 2020
Resi-
dential
Market Overview
Demand
27,021 84,000
Forecast
75%
transactions transactions
in April in October
apartments
In 2020, 602,805 properties were sold nationwide,
with 12% more than the previous year, according to sold before
ANCPI. The transactions include also land for
development, which indicate a constant demand in delivery in 2021
2020 for residential properties, despite the pandemic.
In April however, at the peak of lockdown, the number of
transactions decreased by 34%, followed by an 4% average price increase in 2021 and a decreased
ascendant trend towards the end of the year. take up for homes in new residential projects: 85%
sold before delivery in 2020 vs. 75% in 2021.
Prices +40
eur / square meters
average residential price Rising the maximum pricing threshold for the reduced VAT rate of 5% on
in 2020/Bucharest residential properties from 450,000 RON to 140,000 EUR was postponed
by emergency ordinance up to 1st of January 2022. The delayed measure not
In Q1 2020, prior to lockdown, selling prices
+4.1%
only surprised few thousand buyers with signed pre-contracts in Q4 2020,
prices for residential properties in Romania, but it is expected to slow down the interest in larger apartments for 2021.
registered a 8.1% increase, compared to the
same period of 2019. This growth margin was Despite the difficult economic context, the residential market registered a
above the European Union recorded average (+ average residential price positive trajectory with mild prices increase in 2020. With a cap on the
5.5%), but also above the Euro zone (+5%). in 2020/Romania wage increases in public sector amid fiscal consolidation and postponed 5%
VAT law, in 2021 we are looking at moderate start, followed by increases.
20 21Knight Frank Romania Market Overview 2020
MEDIUM PRICE 0 eur 1k eur 2k eur 3k eur 4k eur 5k eur
/BUILT sq m
Unirii 2,190
Timpuri Noi 1,740
Tei 1,715
Stefan Cel Mare 1,600
Razoare 2,090
Pipera 1,290
Piata 1 Mai 2,040
Obor 1,500
Mosilor 1,990
Kiseleff 4,500
Iancu Nicolae 1,800
Herastrau 2,500
Corporate
Lettings
Grozavesti 1,700
Gara de Nord 1,700
Rent values maintained stable on the premium and luxury
Floreasca 2,900
market, where properties such as luxurious penthouses and
historic villas are in high demand among top executives and
Domenii & Expozitiei 1,700
diplomatic personnel. On the other hand, the prices for the
affordable properties decreased due to higher supply
Delea Veche 1,700
versus demand. A lot of young professionals decided to
move back to their home town or rent houses in the rural /
Bucurestii Noi 1,350
mountain areas for the teleworking period.
Batistei 2,900
Barbu Vacarescu 1,750
Baneasa Sisesti 1,350
Baneasa Jandarmeriei 1,500
Baneasa North 1,100
Baneasa Aviatiei 1,700
Primaverii/Aviatorilor 4,100
Aviatiei 1,800
13 Septembrie 1,760
22 7Knight Frank Romania Market Overview 2020
BUCHAREST MODERN
INDUSTRIAL STOCK
ANNUAL EVOLUTION
sq m
3m
2.25m
1.5m
Industrial
750k
and Logistics
0
Market
2004
2008
2006
2005
2009
2020
2003
2007
2010
2014
2018
2016
2015
2019
2012
2013
2017
2011
TAKE-UP TYPE OF
TRANSACTION 2020
53%
Supply Demand
23%
New Demand 9%
530,000 722,000
Renewal/renegocization 8%
sq m
sq m
Expansion 3%
Pre-lease 3%
The level of deliveries in 2020 was In Bucharest, total take up in 2020 was ~498,000
around 530,000 sq m, bringing the sq m, while nationwide the take up reached Relocation
nationwide stock to 4.7 million. Around approx. 722,000 sq m, a 67% increase Short term lease
65% of the new supply was in Bucharest. compared to the previous year.
24 25Knight Frank Romania Market Overview 2020
BUCHAREST
MODERN TAKE-UP
35% FMCG 5% Others
TAKE-UP BY
2020
24% Retail 3% Distribution
ANNUAL EVOLUTION TENANT
sq m
16% Logistics 2% Manufacturing
ACTIVITY
8% Production 1% Storage
SECTOR
Medical & Pharma 0% Automotive
500 6%
k
375
k
250 Forecast
k
Vacancy ~400,000
sq m
125
k 5%
As a result of the
Almost 50% of them being
in the Bucharest area.
However the vacancy rate
2004
2008
2006
2005
2009
2020
2003
2007
2010
2014
2018
2016
2015
2019
developer’s tendency
2012
2013
2017
is estimated to remain at
2011
towards built-to-suit low level as most of the
projects the vacancy rate future spaces being already
remain at a low level which pre-leased in BTS
is estimated around 5%. transactions.
TAKE-UP
2020
A total of 90 leasing transactions
were recorded nationwide in BY REGION
2020 out of which 22 were
larger than 10,000 sq m.
69% Bucharest 2% Roman
4
Although Bucharest accounted for
13% Timisoara 1% Constanta
69% of total take-up, Timisoara
(~98,000 sqm) and Craiova
Rents
8% Craiova 1% Cluj
(~57,000 sqm) were the most 5.00
sought-after regional locations Arad 1% Brasov
3% 4.75
accounting for a further 13% and
respectively 8%of the total 2% Ploiesti 0% Iasi
EUR/sqm/month 4.50
volume. 4.25
The largest volume of demand came 4.00
from FMCG & Retail companies, Because of the restrictions imposed by the covdi-19 3.75
which rented together ~60% of pandemic, the retail segment turned mostly to the online
3.50
the total volume recorded in 2020 environment, which led to an increased activity on the Rental levels for prime industrial
(~422,000 sqm), companies with warehousing and logistics market. Maybe we are even and logistics space remained 3.25
activities in the field of logistics talking about a pandemic winner considering the figures unchanged in 2020, both in
3.00
(16% and 118,000 sqm, respectively) recorded at the highest level ever, far exceeding the Bucharest and in the other regions
and production (8%, ~58,000 mp) maximum previously reached. across the country. Bucharest Timisoara Cluj-Napoca Ploiesti
26 27Romania Market Overview 2020
Land
PRICES Overview
EUR/sqm
LAND PLOT After a few very positive years,
post crisis, 2015-2019, 2020
PRICES BY USE came, more exactly March 2020
which blocked our everyday life
and also the transactions that we
were discussing at the beginning
Market Overview
of the year. Almost all of them
Barbu Vacarescu/ stayed in stand-by for the whole
2,000
Floreasca year, due to the uncertainty of the
OFFICE times.
Center-West 700-900
Though the pandemic has
challenged certain sectors such
as hospitality and retail, it has also
proven the resilience of core
Prime areas 2,000 - 2,500 assets, driven a surge in online
retail (and by association,
Central benefited the logistics sector), and
RESIDENTIAL (Unirii-Piata 850–1,250 accelerated existing trends
Victoriei) such as high-end residential.
Periphery 250-300
Demand
Office developers backed-off from
Bucharest 350-500 the plans we were having and the
RETAIL residential developers decided to
stay in a waiting mode, because
Country side 150-300
they could compare 2018-2019
when they were selling with
50-60% more apartments/month,
Forecast
compared to pandemic times.
However, at the end of 2020, we
saw the biggest land
2021 started well and full of hope, due to the vaccine transaction ever signed in
of course, especially for the residential business, Bucharest, for a mixed-use
the houses/villas sector, which became attractive destination. SIF Banat-Crisana
in the lockdown periods when people wanted out in bought the IMGB industrial
nature. Investors are looking to buy, but everyone is platform 540,000 sq m from
still waiting to see if there are going to be price drops Doosan, for approximately 40
and opportunities, however we don’t expect big million euros, which was a very
changes in this sense. There is no big pressure on good price opportunity.
the costs, even when we watch the way the stock
markets react. Land for industrial sites was in
focus in 2020, due to the
Compared to recessions, this time investors and conversion to online shopping of
developers were caught in a strong position, the majority, which we expect to
however sitting on cash is not healthy for the continue to grow, both in
long-term, which is why we are looking ahead for a Bucharest and other big cities in
more dynamic second year in 2021. Romania (including surroundings).
12 29
7Knight Frank Romania Market Overview 2020
Flexible working
Office space will
"The future of work will
be flexible – there’s no
continue to be crucial
one-size-fits-all model
Undeniably, despite our newfound
for businesses or
acceptance of remote working, there is a
employees. Autonomy
growing need for businesses to provide
and variety will drive
office space for their employees to develop
business performance."
their skills, collaborate and learn from one
another.
The ‘death of the office’ narrative that
murmured through 2020 wasn’t silenced by
2021
academic rhetoric, it was silenced by
Many of the trends will continue people sincerely missing their office
to shape our world of work, but environments – and everything that came
with them.
the pandemic has also
accelerated several others. Businesses still want a central hub. In fact,
Here are our predictions for only 8% of employees want to work from
2021 workplace trends – both home five days a week, and 53% of UK
Workplace
accelerated and new. businesses surveyed by Knight Frank said
they wanted their offices to feature more
collaboration space. So, while the demand
Working from home for flexibility continues, social capital
Trends:
remains critical.
will continue
Health and wellbeing
It’s safe to say that Covid-19 has
Predictions for the year ahead accelerated the adoption of flexible working.
Several lockdowns have forced many
For most forward-thinking companies,
health and wellbeing were firmly embedded
companies to work from home – even those into corporate agendas, but Covid-19 has
that were reluctant to work anywhere but the catalysed efforts across the board.
office. We believe working from home, as
well as other types of flexible working, such Covid-secure
as staggered hours and working closer to workplaces will prevail
home, will continue to form a part of our
working lives in 2021. As the first lockdown was lifted, flexible
office space providers went to great lengths
While this partly comes down to our ongoing to create Covid-secure workplaces in order
efforts to contain the pandemic, it’s also a to comply with government guidelines and
consequence of our newfound focus on lower health risks.
flexibility as a whole. We’re beginning to see
the extent to which different people, roles They enhanced their cleaning regimes,
and tasks require different parameters for increased airflow, added hand sanitizer
optimal performance. stations throughout all spaces, displayed
safety signage, organised one-way systems
To boost employee productivity, and redesigned furniture layouts to enable
engagement and happiness, our world of social distancing.
work will feature a strategic blend of
different environments, places, working For all workplaces, this safety-first approach
hours and even agile working setups – such will prevail in 2021 and beyond as we
as sit-stand desks, active sitting chairs and continue to mitigate the dangers of
even exercise balls. Covid-19.
30 31Knight Frank Romania Market Overview 2020
Active commuting will rise The demand for
In the months we were encouraged to
return to our workplaces, active
flexible office space
commuting became a popular way to both
avoid public transport and break up a
will grow
sedentary working day.
A focus on the office experience is also
It’s likely this trend will continue, and as a likely to boost the demand for flexible
result, employers will look for offices fit for office space – which has already
a cycling commute, which neighbour witnessed a surge (as monthly rolling
cycleways and feature showers and contracts acted as a tonic for uncertainty
secure bike racks. amid lockdowns.
Businesses will try to prevent Sustainable commutes will trend
remote working loneliness We’ve already witnessed the rise of active
commuting – and in particular – cycling to
For some, remote working came with a work, but 2021 is likely to see the
sense of loneliness and isolation – our sustainability trend reach new heights.
innate need for social interaction was
barely being met. But for others, it was a
Green, sustainable offices will
dream come true.
win the war for talent
Ultimately, 2021 wellbeing strategies will
There is a growing recognition that younger
come down to personal choice, flexibility,
generations of talent are seeking out
and an additional integrity in remote
businesses that increasingly align with their
environments. What’s important is that the
moral values across environmental, social
conversation continues.
and governance initiatives. These include
efforts to reduce corporate carbon
The office experience footprints, improve employee wellbeing, and
ensure diversity and inclusion.
As businesses continue to view real estate
Though dull, drab and cubicle-clad offices as a strategic device and an investment,
have been a thing of the past for some choosing to base their teams in green,
time, we’re likely to see an increased focus sustainable offices is a clear way to
on the office experience in 2021. demonstrate a commitment to the cause
(for both employees, clients and
Quality and collaboration competitors).
will centre stage
The office won’t be what it’s always been.
Workplace strategies will feature a flight to
quality, a focus on design and an emphasis
on collaboration – especially as we try to
rebuild our depleted levels of social capital.
The office will be a destination that provides
experience, connection and choice – with
insta-worthy cafés, curated meet-ups that
instil a sense of community and belonging,
biophilic office design that boosts wellbeing, We’re experts in finding you the
agile working strategies that encourage perfect office space at the best price.
mobility and technology that streamlines Ask us to start your search today – it
workflows. won’t cost you a penny.
32 33Knight Frank Romania Market Overview 2020
WORKPLACE HEPA FILTERS
Capturing up to 99.995% of NEW
RADICAL CHANGE microscopic contaminants.
BUILD
VEHICLE LICENSE
PLATE RECOGNITION
Avoiding direct contact with any
surface (access cards, buttons etc.)
INGS.Knight Frank Romania Market Overview 2020
What’s new for real estate in
Romania
Once upon a time … when people started
preparing for winter holidays, the lawmakers
issued the long-expected law (Law
296/2020) to amend the Fiscal Code by
introducing some of the business
environment’s requirements.
And they lived happily ever after … well, not Authors:
quite, because the Government Emergency
Ordinance (GEO 226/2020) was issued right Inge Abdulcair,
before New Year’s Eve whereby certain Director PwC Romania;
measures provisions of the Law 296/2020 Claudiu Simionescu,
were amended or postponed. Senior Manager
As these new amendments made to the
Fiscal Code are of impact also for the real
Real Estate
estate sector, we briefly present some of
Taxes
them in the next paragraphs.
Corporate income tax
consolidation – finally also in
Romania
Romanian corporate income taxpayers
(exclusively) which are part of the same
group (at least 75% directly or indirectly
ownership) can form a tax group. One of the
members is designated as the responsible
legal entity that will calculate, declare and provision was introduced, it was not possible to 5% on the sale of dwellings Impairment of receivables
pay the corporate income tax for the group, adjust the taxable base in the case of uncollected
Further to the new rules, the threshold for the sale Full deductibility granted for adjustments
with the tax determined by summing the receivables from individual debtors, but only for
of apartments under the social policy (i.e. the regarding the impairment of receivables that
individual calculations of each member - receivables against legal entities.
current threshold is of 450,000 RON – approx. are uncollected in a period exceeding 270
thus giving the opportunity to offset the tax 100,000 Euro) has been raised to 140,000 Euro. days from the due date, are not guaranteed
profits of companies within the group with Further to the new introduced rule, if the total or
However, the application of such rule has been and are owed by a non-affiliated person (and
the tax losses of others. partial value of the goods delivered or services
postponed to January 1st, 2022. not only 30% deductible as in the past).
provided was not collected from the beneficiaries
However, GEO 226/2020 postponed this
Thus, the real estate developers with more represented by individuals within 12 months from the
payment deadline set by the parties / from the Tax amnesty provision for 2022.
entities into their portfolio may consider this
facility as to decrease the tax burden at the invoice date of issue, the taxable VAT base may be The Emergency Ordinance no. 229/2020 extended
level of their group. adjusted. Therefore, the supplier will be in the posi- the period until which taxpayers that had Local taxes
tion to recover from the state budget the amounts outstanding tax liabilities at March 31st, 2020 can In the case of legal entities, the taxable value
However, the period of application of the paid with its own resources and without being cashed benefit from the tax amnesty for the annulment of of the building will be updated every five years
system is five fiscal years, while tax losses in from its customers. interest and late payment / non-declaration on the basis of an evaluation report prepared
recorded by a member of the group before penalties related to such main tax liabilities. by an authorised valuator (that term was
the application of the system cannot be The adjustment is allowed only if it is proved that
previously three years).
compensated for at group level. commercial measures have been taken for the Initially, the Emergency Ordinance no. 69/2020 And there are also other pieces of legislation
recovery of claims up to RON 1,000 and that legal established as the deadline for submitting the issued in the last 12 months which impacts the
Adjustment of the VAT proceedings have been undertaken for the recovery application for annulment of ancillary tax liabilities business environment in a positive way: e.g.
of claims higher than RON 1,000. the date of December 15, 2020, many taxpayers
taxable base capitalization incentives, tax amnesty, COVID
being in a rush to submit documentation by this related facilities etc… but that’s another story
The local rules have been amended to align Such provision will be applicable for invoices that date, however, the Emergency Ordinance for another time.
with the principles of the VAT Directive and have a payment deadline / date of invoice issuance published at the end of 2020 extends this
recent European case law. Before such after the entry into force of the said Ordinance. deadline until March 31 2021.
36 37Knight Frank Romania Market Overview 2020
The COVID-19 pandemic has severely
impacted several fields and industries,
including the real estate sector. Many
office buildings have been vacated as a
How to
precaution or because the companies
went out of business. Given that the
pandemic has triggered a recession on
the real estate market and that
employers have discovered remote work
turn office
to be an efficient solution, the demand
for office buildings will likely decline.
Property owners should therefore look for
new ways their buildings can be used to
space into
improve rentability.
One of the most appealing options is to
convert office buildings into residential
residential
units. The rules in this regard are
provided mainly by Law No. 50/1991, on
the authorisation of construction works,
as amended.
units
According to Law No. 50/1991, owners
must first obtain a new town planning
certificate for their property indicating all
the documents needed to change the
building's designation.
As a rule, the conversion of commercial
Legal challenges
spaces into residential units will require a
planning permit. Nevertheless, it may be Authors:
possible to convert office or commercial
space into residential premises even Simona Chirică, PhD, Partner;
without obtaining a building permit, but Mădălina Mitan, Managing Attorney at Law;
only if the construction works do not alter Steliana Garofil, Attorney at Law –
the structure of the building and/or its Schoenherr și Asociații SCA
architectural character. Obviously, if
structural partitions are needed, applying
for a new building permit will be a must.
Before obtaining the building permit to
change the use of a building, the local Finally, once conversion works are completed and a
public authorities may also require the reception protocol has been issued, the change of use
owner to prepare a regional urban plan from commercial to residential must be registered with
(PUZ) or a detailed urban plan (PUD), if the Land Book Office, based on a new cadastral
the new designation of the building is documentation drawn up for the building.
incompatible with that provided by the
urban local regulations. Besides the funds required to reconvert an office building
into residential spaces, the reconversion may also entail a
Moreover, the use of a building may be lengthy bureaucratic process. However, given the change
changed by obtaining a new building from offline to online office work, reconversion will
permit, but without needing to prepare certainly be a viable alternative in some cases. This new
technical documentation if the new use business model will create the need for many additional
of the building is in line with the local services, such as construction work, technical and
urban regulations set by the applicable professional services, real estate consultancy, brokerage
PUG or PUZ. services and others.
20 39Your partners
in property
for 125 years.
15KNIGHT FRANK Romania
Horatiu Florescu
Chairman & CEO
+40 21 380 85 85
horatiu.florescu@ro.knightfrank.com
Roxana Bencze
COO
+40 21 380 85 85
roxana.bencze@ro.knightfrank.com
Natalia Gross
Head of Marketing and Communications
+40 21 380 85 85
natalia.gross@ro.knightfrank.com
Ileana Stanciu-Necea
Head of Research
+40 21 380 85 85
ileana.necea@ro.knightfrank.com
RECENT MARKET-LEADING RESEARCH PUBLICATIONS:
The Wealth Report 2021
Active Capital 2020
CSEE H1 2020
T H E G L O B A L P E R S P E C T I V E O N P R I M E P RO P E RT Y & I N V E ST M E N T
2021 — 15TH EDITION
Knight Frank Research
Reports are available at
knightfrank.com/research
This report is published for general information only and not to be relied upon in any way. Although high
standards have been used in the preparation of the information, analysis, views and projections presented
in this report, no responsibility or liability whatsoever can be accepted by Knight Frank LLP or Knight Frank
Romania SRL for any loss or damage resultant from any use of, reliance on or reference to the contents of
this document. As a general report, this material does not necessarily represent the view of Knight Frank
LLP and Knight Frank Romania SRL in relation to particular properties or projects. Reproduction of this
report in whole or in part is not allowed without prior written approval of Knight Frank LLP and Knight Frank
Romania SRL to the form and content within which it appears. Knight Frank LLP is a limited liability
partnership registered in England with registered number OC305934. Our registered office is 55 Baker
Street, London, W1U 8AN, where you may look at a list of members’ names.You can also read