Ross Stores, Inc.
  Investor Overview
  May 2019
←
→
Page content transcription
If your browser does not render page correctly, please read the page content below
Ross Stores, Inc. Investor Overview May 2019
Disclosure of Risk Factors
Forward-Looking Statements: This presentation contains forward-looking statements regarding expected sales, earnings levels, new
store growth opportunity, and other financial results in future periods that are subject to risks and uncertainties which could cause our
actual results to differ materially from management’s current expectations. The words “plan,” “expect,” “target,” “anticipate,” “estimate,”
“believe,” “forecast,” “projected,” “guidance,” “outlook,” “looking ahead,” and similar expressions identify forward-looking statements.

Risk factors for Ross Dress for Less® (“Ross”) and dd’s DISCOUNTS® include without limitation, competitive pressures in the apparel or
home-related merchandise retailing industry; changes in the level of consumer spending on or preferences for apparel and home-related
merchandise; market availability, quantity, and quality of attractive brand name merchandise at desirable discounts and our buyers’ ability
to purchase merchandise that enables us to offer customers a wide assortment of merchandise at competitive prices; impacts from the
macro-economic environment, financial and credit markets, and geopolitical conditions that affect consumer confidence and consumer
disposable income; our ability to continually attract, train, and retain associates to execute our off-price strategies; unseasonable weather
that may affect shopping patterns and consumer demand for seasonal apparel and other merchandise, and may result in temporary store
closures and disruptions in deliveries of merchandise to our stores; potential information or data security breaches, including cyber-
attacks on our transaction processing and computer information systems, which could result in theft or unauthorized disclosure of
customer, credit card, employee, or other private and valuable information that we handle in the ordinary course of our business, disrupt
our operations, damage our reputation with customers, and increase our costs; potential disruptions in our supply chain or information
systems; issues involving the quality, safety, or authenticity of products we sell, which could harm our reputation, result in lost sales,
and/or increase our costs; our ability to effectively manage our inventories, markdowns, and inventory shortage to achieve planned gross
margin; changes in U.S. tax or trade policy regarding apparel and home-related merchandise produced in other countries that could
adversely affect our business; volatility in revenues and earnings; an adverse outcome in various legal, regulatory, or tax matters that
could damage our reputation or brand and increase our costs; a natural or man-made disaster in California or in another region where we
have a concentration of stores, offices, or a distribution center; unexpected issues or costs from expanding in existing markets and
entering new geographic markets; obtaining acceptable new store sites with favorable consumer demographics; damage to our corporate
reputation or brands; effectively advertising and marketing our brands; issues from selling and importing merchandise produced in other
countries; and maintaining sufficient liquidity to support our continuing operations, new store and distribution center growth plans, and
stock repurchase and dividend programs.

Other risk factors are set forth in our SEC filings including without limitation, the Form 10-K for fiscal 2018, and Form 10-Q and Form 8-Ks
for fiscal 2019. The factors underlying our forecasts are dynamic and subject to change. As a result, our forecasts speak only as of the
date they are given and do not necessarily reflect our outlook at any other point in time. We do not undertake to update or revise these
forward-looking statements.

                                                                May 2019                                                                      2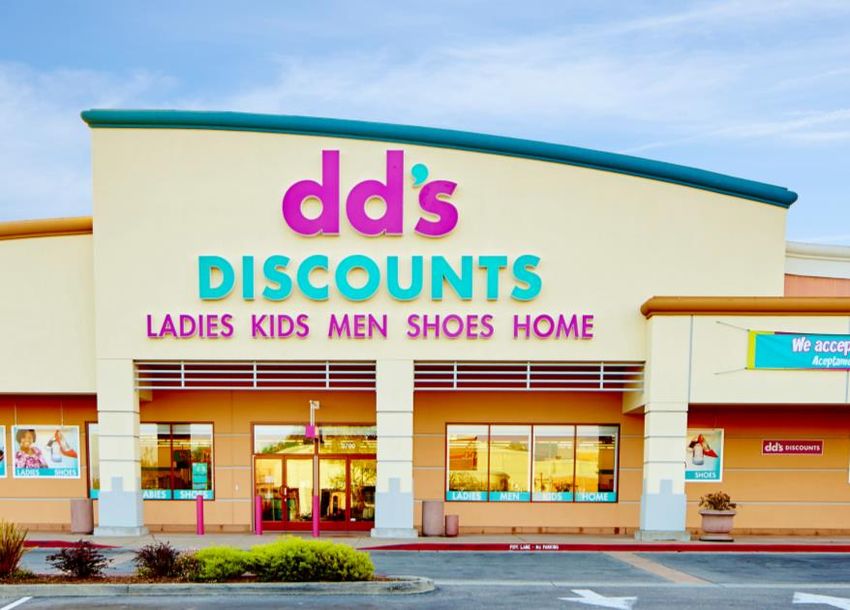
Ross Stores, Inc. Overview
▪   S&P 500, Fortune 500 and Nasdaq                               Sales                         EPS
    100 company with fiscal 2018
    revenues of $15.0 billion
▪   Ross Dress for Less® is the largest
    off-price apparel and home fashion
    chain in the U.S. with 1,502 stores in
    38 states, the District of Columbia,
    and Guam
▪   Also operates 243 dd’s DISCOUNTS®
    in 18 states
▪   Consistent long-term growth in both
    sales and EPS
▪   Fortune 500 Statistics
    ▪   Ranked #209 in 2017, up from #219 in
        2016 and #237 in 2015
    ▪   In 2017, ranked #5 out of 500
        companies for total return to
        stockholders on a 10-year basis (~30%)
    ▪   Ranked #22 out of 500 companies on
        10-year annual EPS growth rate (~22%)

                         * 2017 was a 53-week year; all other years were 52-week years.
                         EPS adjusted to reflect two-for-one stock split effective June 2015.

                                                        May 2019                                 3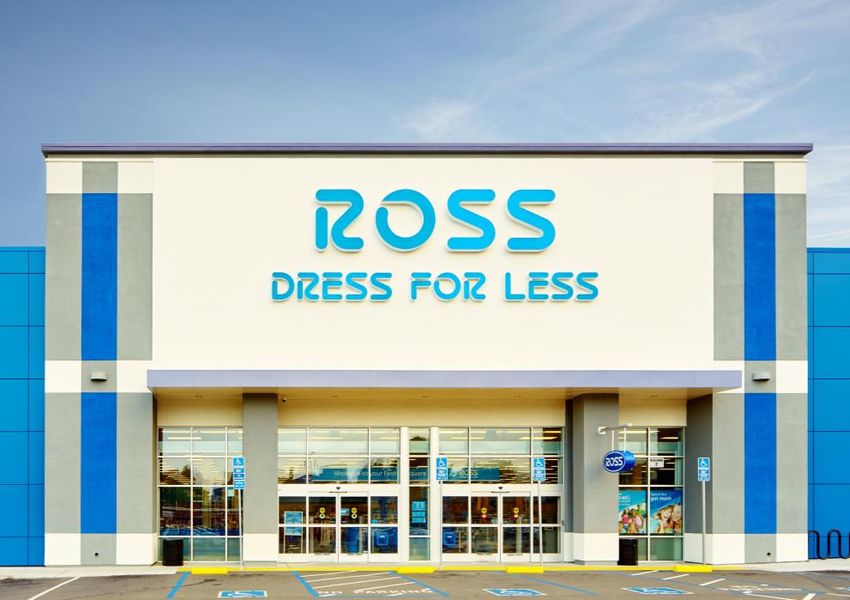
1,745 Stores in 38 States (as of 5/4/19)

                              Ross   dd’s                 Ross   dd’s                    Ross   dd’s                Ross    dd’s
       Alabama                  24          Idaho           12          Nebraska            3          Tennessee      32      2
       Arizona                  67    13    Illinois        73     8    Nevada             31     8    Texas         197     51
       Arkansas                  8          Indiana         18          New Jersey         13     1    Utah           21
       California              310    97    Iowa             6          New Mexico         13     3    Virginia       39
       Colorado                 33     4    Kansas          12          North Carolina     45     2    Washington     43
       Delaware                  2     1    Kentucky        11          North Dakota        2          Wisconsin      19
       District of Columbia      2          Louisiana       15     3    Oklahoma           25     2    Wyoming         3
       Florida                 174    33    Maryland        24     2    Oregon             31
       Georgia                  55     9    Mississippi      9          Pennsylvania       47     2
       Guam                      2          Missouri        26          South Carolina     25     2    TOTAL        1,502   243
       Hawaii                   22          Montana          6          South Dakota        2

                                                            May 2019                                                               4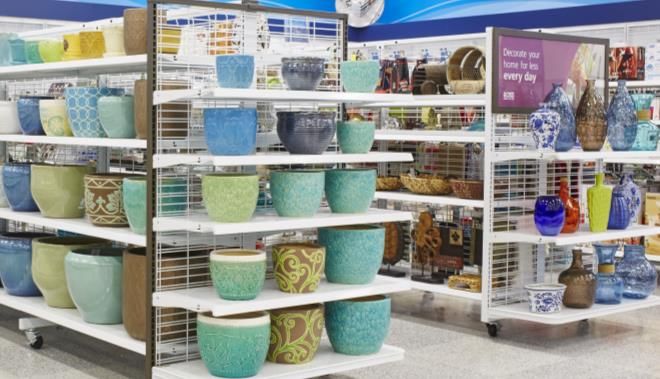
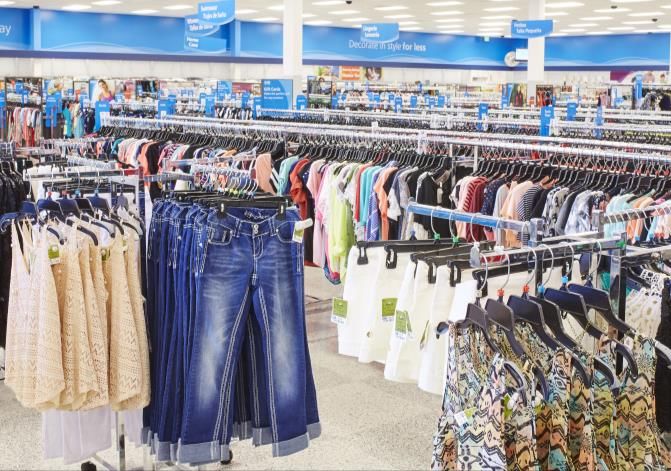
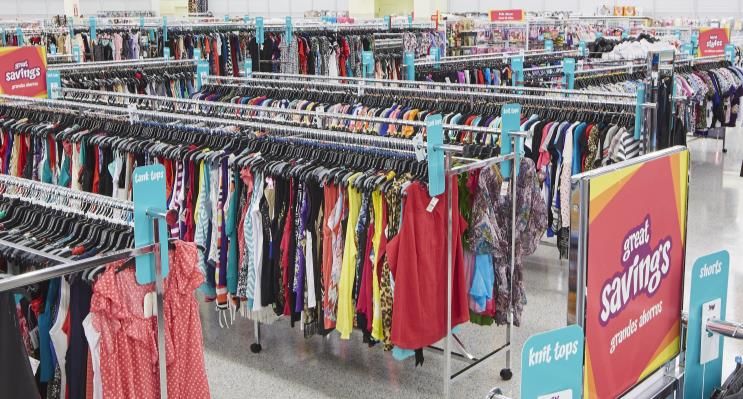
Delivering Bargains

▪ Department store brands

▪ Significant discounts off comparable prices
   ▪ Great savings every day

▪ Wide assortment of styles and fashions
  (e.g., “treasure hunt”)
▪ Constant flow of fresh merchandise

                            May 2019            5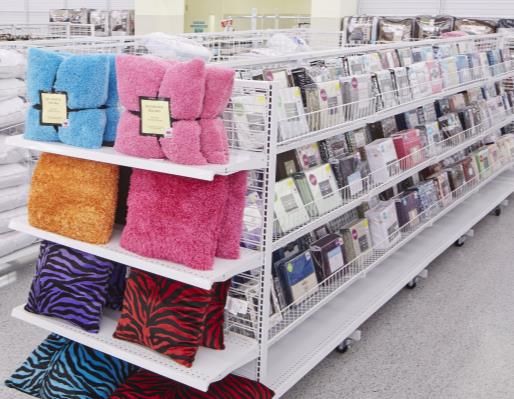
Merchandise Mix*

                        Children's
                            8%
                                      Ladies
            Shoes                      26%
             13%

Accessories,
Lingerie, Fine
   Jewelry,
 Fragrances
     13%

                                        Home
                      Men's          Accents, Bed
                       14%             and Bath
                                         26%

      * Fiscal 2018

                                      March 2019    6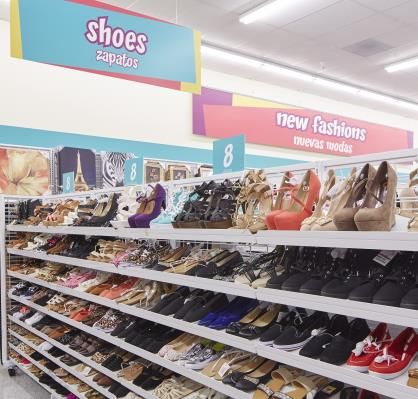
Key Value Drivers
▪   Opportunistic buying supported by a large and growing off-price
    buying organization
      ▪   Hundreds of merchants sourcing product from thousands of
          manufacturers and vendors
▪   Broad market coverage and strong vendor relationships
    enhanced by strategic location of buying offices in New York City
    and Los Angeles
▪   Effective management of inventory and liquidity
▪   Planning and allocating at a local vs. regional level
      ▪   Systems and processes allow us to understand customer
          preferences and allocate the right item to the right store at
          the right time

                                    May 2019                              7
Typical Ross Customer
Demographic How We Reach Her
▪ About 70-75% female, shopping for ▪ Marketing reflects the business
herself / other family members strategy – bargains on a wide
assortment of brands and styles
▪ Wide range of household incomes –
“want a bargain” vs. “need a bargain” ▪ Television is an effective medium to
reach customers with a strong value
▪ Price and value matter most – great
message
deals on brands she loves is a key
way of showing her that value ▪ Creates and sustains
awareness
▪ Embraces the “treasure hunt” format
and spends time shopping for ▪ Encourages frequent shopping
bargains ▪ Cost effective vehicle
▪ Core customer averages about two- ▪ Also engaging customers through
to-three store visits a month social media (Facebook,
Instagram) and other digital
channels
May 2019 8Ross Dress for Less Store Prototype
▪ Efficient, low-cost format
▪ Opening stores with average
approximate size of 22,000 –
30,000 gross square feet
▪ Convenient self-service format
▪ Strong co-tenancy
▪ Visible and accessible retail
locations
▪ Located in markets with a large
proportion of broad income
levels
▪ High traffic intersections
May 2019 9dd’s DISCOUNTS
▪ Concept launched in California in 2004
▪ Opening stores with average
approximate size of 18,000 – 22,000
gross square feet
▪ Established shopping centers
▪ Stores located in California, Texas,
Florida, Arizona, Georgia, Illinois,
Nevada, Colorado, Louisiana, New
Mexico, Maryland, North Carolina,
Oklahoma, Pennsylvania, South
Carolina, Tennessee, Delaware, and
New Jersey
▪ Target customer is typically younger,
more ethnically diverse, and from
lower-to-moderate income households
▪ Assortments feature more moderate
brands and fashions for the family and
home at lower average price points
than Ross
May 2019 10dd’s DISCOUNTS Update
▪ As it has for some time now, dd’s
posted better-than-expected gains
in both sales and operating profits
for the first quarter of 2019
▪ dd’s DISCOUNTS has benefited by
delivering a faster flow of fresh and
exciting product to our stores while
operating on lower inventory levels
▪ Its solid performance reflects that
dd’s DISCOUNTS’ value-focused
merchandise offerings continue to
resonate well with its target
customer
▪ During the quarter, we added six
new locations. In 2018 and 2017,
we added 24 and 20 net new
locations, respectively; potential for
about 600 locations over the long
term
May 2019 11Commitment to Value
▪ Our top priority is ensuring access to terrific brands at great
savings every day
▪ Reflected in ongoing investments in people and processes in our
merchant organization
▪ Our highly skilled merchants purchase product from thousands of
vendors and manufacturers, enabling consistent access to quality
name brand bargains that our customers value
▪ Believe consumers will continue to seek out bargains
▪ More value-focused shopping behavior is enabling Ross and
dd’s DISCOUNTS to attract customers
▪ Offering the best bargains available retains these customers
▪ Also capturing market share from retailers who have closed stores
and/or gone out of business
May 2019 12Significant Growth Opportunities
▪ Over the long-term, we believe we can operate a total
of 3,000 stores
▪ Significant opportunity to expand in both existing and
newer markets, such as the Midwest
▪ Today, we only operate in 38 states with plans to
become a national retailer over time
▪ Long-term, we project Ross Dress for Less can grow to
approximately 2,400 locations.
▪ dd’s DISCOUNTS can become a chain of about 600
stores.
May 2019 13Financial Results
May 2019 14Flexible and Resilient Off-Price Model
▪ Long history of consistent sales and earnings growth in both
healthy and challenging retail and macro-economic environments
▪ Benefiting from our ability to offer terrific bargains
▪ Taking advantage of close-out opportunities in the marketplace
▪ Continued investment in our merchandising organization
▪ Operating the business on lean in-store inventories
▪ Increases the percentage of fresh product in front of the customer
and promotes faster inventory turns
▪ Enhances cash flow by reducing working capital needs
▪ Tightly managing expenses across the Company
▪ Overall, we remain very focused on diligent execution of our
strategies, which is always the key to maximizing our prospects for
sales and earnings growth in any type of economic or retail climate
May 2019 15Fiscal 2018 Results
▪ FY 2018 sales increased 6% to $15.0 billion, with
comparable store sales up 4% over fiscal 2017
▪ Men’s was the best performing category
▪ Midwest was the strongest region
▪ Added 95 net new locations in FY 2018
▪ Ended the year with 1,480 Ross and 237 dd’s DISCOUNTS
stores
▪ FY 2018 operating margin decreased 85 basis points to
13.6%, due in part to last year’s 20 basis point benefit from
the 53rd week
▪ Earnings per share for the 52-week fiscal 2018 year grew to
$4.26, up from $3.55 in the prior 53-week year
May 2019 16First Quarter 2019 Results
▪ First quarter 2019 sales increased 6% to $3.8 billion, with
comparable store sales up 2% over the same period last year
▪ Men’s was the best performing category
▪ The Midwest was our strongest geographic region
▪ Added 28 net new locations in Q1 2019
▪ Ended Q1 with 1,502 Ross and 243 dd’s DISCOUNTS stores
▪ Operating margin for the period was down from the prior year to
14.1%, though better than expected, mainly due to above plan
merchandise margin and favorable timing of expenses
▪ Earnings per share for the first quarter of 2019 was $1.15, up from
$1.11 in the prior year. These results include an approximate $.02
per share benefit from the favorable timing of expenses that are
expected to reverse over the balance of the year
May 2018 17Targeting Sustainable Profit Margins
▪ Over the long term, we believe annual EBIT margins can be flat to
slightly up on comparable store sales growth in line with our historical
averages
▪ Record levels of merchandise gross margin have been driven by
better buying and faster inventory turns from our sizeable reduction of
selling store inventories by more than 40% over the last decade
▪ Merchandising remains our top priority, and we plan to further strengthen
the organization through continued investments in people, processes, and
technology. This enables us to maximize access to the best bargains
available in the marketplace and get the right goods to the right store at
the right time
▪ We remain focused on tight inventory management, which allows us to
remain nimble and take advantage of opportunities in the marketplace
▪ Numerous productivity enhancements and efficiencies throughout the
Company have helped us to strictly manage expenses in our
distribution centers, stores organization, and back office functions
May 2019 18Higher Levels of Cash Returned to Stockholders
▪ In March 2019, our Board of Directors
approved a new two-year share
repurchase program to be completed in Share repurchases and
the next two fiscal years for $2.55 billion
dividend payments
▪ Represents an increase from the
previous $1.95 billion authorization ($ millions)
▪ Company has repurchased shares 2,000 1,646
in-line with plan every year since 1,412
1993 1,600 1,123
▪ Our Board of Directors also approved an 915
increase in the quarterly cash dividend 1,200 892
by 13% to $.255 per share, on top of
41% growth in the prior year (25th 800
consecutive annual increase)
▪ Stock repurchase and dividend 400
programs reflect our ongoing confidence
in the Company’s future growth 0
prospects and continued commitment to 2015 2016 2017 2018 2019F *
enhancing stockholder value
▪ Combination of existing cash balances, Share Repurchases Dividends
ongoing cash generation, and current * 2019 is forecasted.
credit facilities gives Ross flexibility for
both the short- and long-term
May 2019 19Capital Expenditures
▪ FY 2019 capital expenditures are projected to be about $600 million, up from $414
million last year.
▪ The increased level of capital expenditures in 2019 is driven by initial investments for
our next distribution center.
2018 Actual 2019 Forecast
New stores $ 135 million $ 145 million
Existing stores 130 million 125 million
Distribution, Transportation 64 million 200 million
Information Systems, Corporate, Other 85 million 130 million
Total $ 414 million $ 600 million
May 2019 20Investment Highlights
▪ Favorably positioned as a leader in the off-price industry, which continues to
gain market share
▪ Ross Dress for Less is the largest off-price apparel and home fashion chain in
the U.S. with 1,502 locations in 38 states, the District of Columbia, and Guam
▪ dd’s DISCOUNTS operates 243 locations across 18 states
▪ Significant growth opportunities ahead with the potential to grow our store base
to approximately 3,000 locations in the U.S. over the long-term
▪ Proven strategies have driven growth for over 35 years
▪ Strong balance sheet with minimal debt and high returns
▪ Consistent generation of excess cash that is returned to stockholders
▪ Core focus on delivering competitive bargains continues to resonate with today’s
value-driven consumer
▪ Ongoing diligent execution of our off-price strategies is expected to:
▪ Enhance ability to manage through any type of economic or retail climate
▪ Maximize prospects for sales and earnings growth
▪ Optimize stockholder returns over both the short- and long-term
May 2019 21You can also read


