RUSSIA'S INVASION OF UKRAINE - Implications for Energy Markets and Activity SPECIAL FOCUS 2
←
→
Page content transcription
If your browser does not render page correctly, please read the page content below
SPECIAL FOCUS 2

  RUSSIA'S INVASION
        OF UKRAINE
           Implications for
Energy Markets and Activity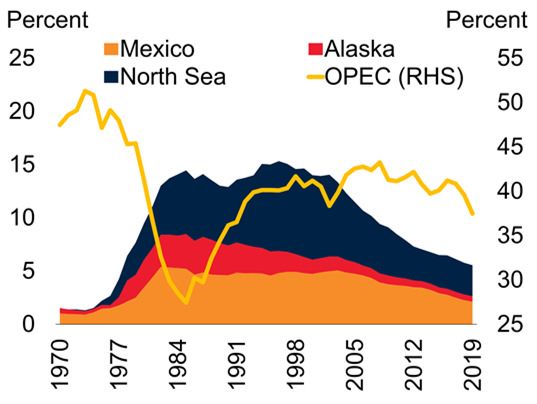
G LO BAL EC O NO MIC P ROS P EC TS | J U NE 2022                                                                  S P EC IAL FO CU S 2   81

The Russian Federation’s invasion of Ukraine has disrupted global energy markets and damaged the global
economy. Compared to what took place in the 1970s, the shock has led to a surge in prices across a broader set of
energy-related commodities. In energy-importing economies, higher prices will reduce real disposable incomes,
raise production costs, tighten financial conditions, and constrain policy space. Some energy exporters may bene-
fit from improved terms of trade and higher commodities production. However, on net, model-based estimates
suggest that the war-driven surge in energy prices could reduce global output by 0.8 percent after two years. The
experience of previous oil price shocks has shown that these shocks can provide an important catalyst for policies
to encourage demand reduction, substitution to other fuels, and development of new sources of energy supply.

Introduction                                                  percent increase between January 2020 and
                                                              December 2021 (figures SF2.1.B-D). Based on
Volatility in energy markets, driven by a strong              current projections, energy prices are expected to
demand recovery from the pandemic and                         rise by 50 percent in 2022, reflecting an 81
numerous pandemic-related supply constraints, is              percent increase in coal prices, a 74 percent rise in
being exacerbated by Russia’s invasion of Ukraine.            natural gas prices (average of the European, Japan,
The invasion has led to significant disruptions to            and U.S. benchmarks), and a 42 percent increase
the trade and production of energy commodities                in the price of oil. Relative to January projections,
as Russia is the world’s largest exporter of natural          the prices of energy commodities are now
gas and accounts for a significant share of global             expected to be 46 percent higher on average in
coal and crude oil exports (figure SF2.1.A).                  2023.1
However, the ultimate impact of these disruptions
                                                              Supply disruptions of key energy commodities
will depend on their magnitude, the availability of
                                                              could severely affect a wide range of industries,
inventories, the development of other supplies or a
                                                              including food, construction, petrochemicals,
ramping up of production in other countries, and
                                                              transport, and firm-level effects (Lafrogne-Joussier
the extent to which demand can be reduced.
                                                              et al. 2022). Concerns about energy security have
Already, the United States and the European                   already prompted public policies aimed at
Union (EU) have announced plans to ban or                     bolstering national self-sufficiency and reducing
phase out fossil fuel imports from Russia, and                energy prices for consumers; however, lessons
Russia has cut off direct natural gas exports to              from previous energy price shocks show that these
Bulgaria, Finland, the Netherlands, and Poland                policies are often costly and ineffective, compared
(World Bank 2022a). The United States and other               with steps to encourage consumers to reduce
International Energy Agency members announced                 demand, to substitute for other forms of energy,
the release of 180 million and 60 million barrels of          and to develop alternative energy sources.
oil, respectively, from April to October 2022. And            The increase in energy prices is likely to weigh on
in any event, tighter financial conditions, reduced            global economic activity. Higher energy prices will
investment, and restricted access to technology are           reduce activity in energy-importing economies by
likely to have a longer-term impact on Russia’s               lowering real incomes, raising production costs,
energy production.                                            tightening financial conditions, and constraining
                                                              macroeconomic policy. Stronger activity in some
Reflecting these developments, coal and oil prices
                                                              energy-exporting emerging market and developing
have risen sharply, European natural gas prices
                                                              economies—supported by more favorable terms of
have reached record highs, and the World Bank’s
                                                              trade, expanded production, and stronger
energy price index increased by 34 percent
                                                              investment—will only provide a partial offset to
between January and March 2022, on top of a 50
                                                              the drag on global growth.

    Note: This Special Focus was prepared by Justin-Damien        1 On average over 2022-23, oil, natural gas, and coal prices are

Guénette and Jeetendra Khadan with contributions from Peter   now expected to be 87 percent, 40 percent, and 69 percent higher
Stephen Oliver Nagle, John Baffes, and Garima Vasishtha.      than in January.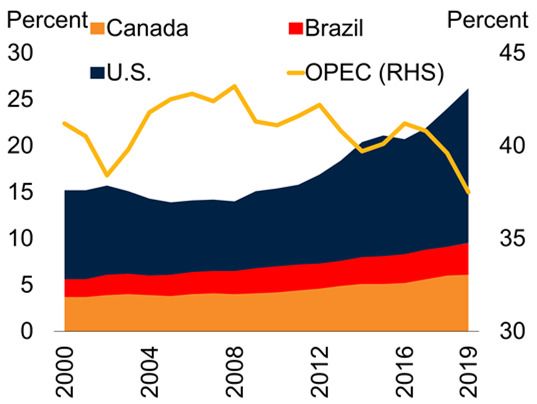
82 S P EC IAL FO CU S 2 G LO BAL EC O NO MIC P ROS P EC TS | J U NE 2022
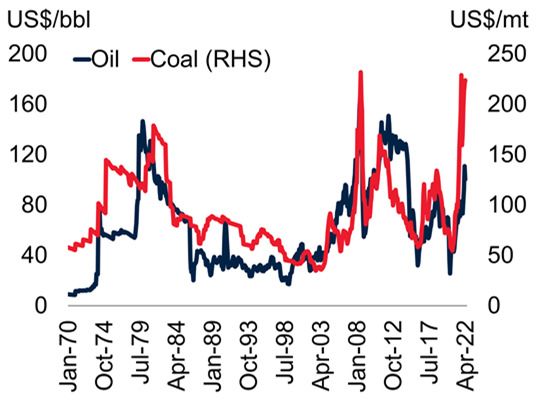
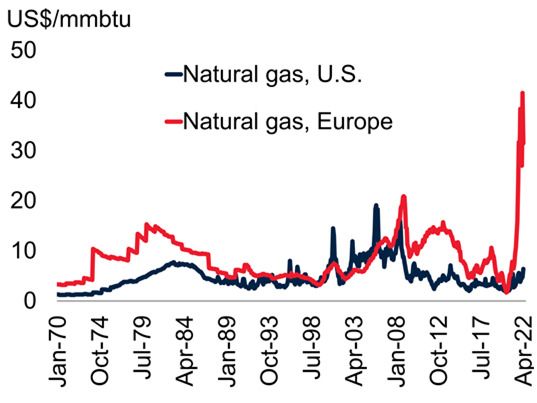
FIGURE SF2.1 Commodity dependence and energy implying less opportunity for substitution toward
prices cheaper fuels. At the same time, however, the
The Russian Federation is a major exporter of energy commodities. All coal energy intensity of GDP now is much lower than
and natural gas prices have reached historic highs in nominal terms. in the 1970s, so consumers may be less sensitive to
However, in real terms, only the European natural gas price has reached
an all-time high, and it is substantially above its previous peak in 2008.
relative price changes, at least in the short term.
Real coal prices are close to their 2008 peak, while real oil prices remain And in the current episode, policy responses have
some distance below. tended to focus on adjustments to fuel subsidies
and taxes to mitigate the effects on consumer
A. The Russian Federation’s share of B. Commodity price changes in 2022
global energy exports prices, rather than on measures to address
underlying supply/demand imbalances.
Prices. Crude oil prices have increased by 350
percent (in nominal terms) from their pandemic
low in April 2020 to April 2022, making it the
largest increase for any equivalent two-year period
since the 1970s.2 Also, all energy prices rose
sharply in 2022, in contrast to earlier episodes
where oil prices rose much more sharply than
C. Coal and oil prices (real) D. Natural gas prices (real) those for coal and gas. In nominal terms, coal and
gas prices have all reached historic highs.
However, in real terms, only the European natural
gas price has reached an all-time high (and it is
substantially above its previous peak in 2008).
Coal prices are close to their 2008 peak, while oil
prices remain some way below. With all energy
prices elevated, there is less opportunity to
substitute for cheaper fuel in the current energy
shock. In addition, the increase in prices of some
Sources: BP Statistical Review; Eurostat; Haver Analytics; Comtrade (database); World Bank.
A. Data for energy are trade volumes. Data are for 2020.
energy commodities is also driving up prices of
B. Three-month change in commodity prices through end-March 2022. LNG stands for liquefied other commodities. For example, higher natural
natural gas.
C.-D. Monthly data from 1970 to April 2022. Prices deflated by the U.S. Consumer Price Index. gas prices have already pushed fertilizer prices to
their highest level since 2010.
Smaller energy intensity of GDP. The oil
Against this background, this Special Focus intensity of GDP has fallen considerably since the
addresses the following questions: 1970s. Similarly, prior to the price shock,
consumer spending on energy as a share of total
• How does the latest energy price shock
spending is also lower, especially in advanced
compare with previous major shocks?
economies, which means that consumers may
• What are the lessons from previous energy respond less to energy price changes, at least in the
price shocks? short term, than in the 1970s.
• What are the likely implications of the current Different policy focus. Many countries have
energy price shock for global activity? responded to the current shock by prioritizing
energy subsidies and tax breaks with fewer policies
Comparison with previous
energy shocks
2 Another shock took place during the early 2000s in a more
The current energy shock differs from previous oil gradual fashion as a result of strong demand growth in emerging
market and developing economies, especially in China and India
price spikes to the extent that the current episode (Baffes et al. 2018). At their peak, in July 2008, nominal oil prices
has had a broader impact on energy commodities, exceeded $130/bbl (or $172/bbl in inflation-adjusted 2022 terms).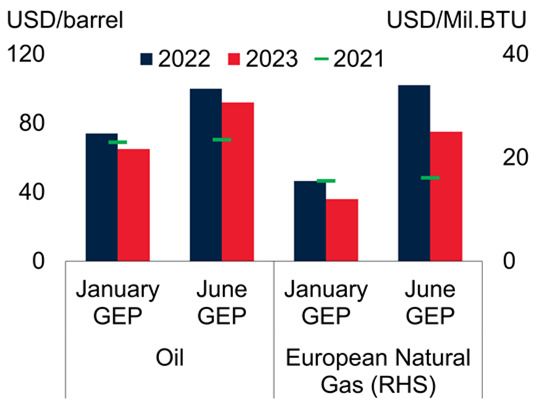
G LO BAL EC O NO MIC P ROS P EC TS | J U NE 2022                                              S P EC IAL FO CU S 2   83

designed to tackle the underlying imbalance           oil-importing countries contributed to a
between supply and demand. However, several           permanent reduction in underlying demand.
countries have announced plans to increase            Changes in consumer preferences in response to
production of fossil fuels (coal and LNG), while      higher prices also played a role in reducing
others have announced faster increases in fuel        demand, for example, the shift toward more fuel-
efficiency requirements to reduce energy demand.      efficient vehicles in the United States (Cole 1981).
                                                      In the 2000s, there was less substitution to other
By comparison, policy responses to previous oil       fuels as a much smaller amount of crude oil was
price shocks were focused on establishing             being used in electricity generation. After reaching
institutions, such as the creation of the             its peak in 2005, oil consumption in advanced
International Energy Agency in 1974, to safeguard     economies steadily declined and was 14 percent
oil supplies and promote common policy making.        lower by 2014. The decline in oil consumption
Key policy decisions included the requirement to      was largely due to a shift toward more fuel-
create national oil reserves equal to 60 days of      efficient automobiles, including hybrid electrics
imports (later expanded to 90 days) and a ban on      (Hamilton 2009). Among EMDEs, oil demand
building new oil-powered electricity plants with a    also decelerated in the 2010s.
directive to switch to coal (enacted in 1977; Scott
1994). Measures were also implemented to address      Substitution. In the five years after the 1979 oil
the underlying demand and supply imbalance            price shock, the share of crude oil in the energy
(Ilkenberry 1988; Shibata 1982; U.S. Congress         mix in advanced economies fell by more than 7
1975). For example, the United States adopted         percentage points, owing to the prohibition of the
policies to reduce demand and boost production        construction of new oil-fired power stations and
after the steady increase in prices in the 2000s      their gradual replacement with nuclear and coal-
(EPA 2007). Demand-side measures included             powered stations. Among EMDEs, the share of oil
fiscal incentives to improve energy efficiency in     in the energy mix fell by 4 percentage points and
vehicles and housing. Supply-side measures            was largely replaced by natural gas. In the years
included a mandate to sharply increase the use of     following the 2008 oil price increase, the share of
biofuels; establishing renewable fuel standards;      natural gas and renewables in the energy mix rose,
providing energy-related tax incentives for fossil    reflecting the U.S. shale boom for natural gas, as
fuels, nuclear, and renewable energy sources; and     well as mandates and technological improvements
providing loan guarantees for zero-carbon             for renewables. However, substituting other
technologies. The EU and many EMDEs adopted           energy commodities for oil in its main current
similar policies.                                     uses—transport and petrochemicals—has proved
                                                      to be more difficult.
Lessons from previous
                                                      New sources of production. High oil prices in the
energy shocks                                         1970s induced investment in oil production by
                                                      non-OPEC countries, particularly for reserves
The experience of the past 50 years suggests that     with a higher cost of production. These included
there are three channels through which market         Prudhoe Bay in Alaska, the North Sea offshore
mechanisms respond to energy price shocks and         fields of the United Kingdom and Norway, the
associated    policies:   demand      reduction,      Cantarell offshore field of Mexico, and oil sands in
substitution, and supply responses (Baffes and        Canada (figure SF2.2.A). High and stable prices in
Nagle 2022).                                          the 2000s also facilitated the development of
                                                      alternative sources of crude oil. The most notable
Demand reduction. Between 1979 and 1983,              of these was the development of U.S. shale oil
global oil demand fell by 11 percent, or 6 million    deposits, output from which rose from 0.6 mb/d
barrels per day (mb/d). While the drop in oil         in 2008 to 7.8 mb/d in 2019, resulting in a
demand was partly a result of the global recession    sustained expansion in total U.S. production
in 1982, energy efficiency and policies to            (figure SF2.2.B).
encourage a substitution from oil implemented by
84 S P EC IAL FO CU S 2 G LO BAL EC O NO MIC P ROS P EC TS | J U NE 2022
FIGURE SF2.2 Market responses to price shocks cussions—even absent discretionary policy
The oil price increases in the 1970s led to increased oil production from responses—on fiscal and external balances.
non-OPEC countries, notably in the North Sea and Alaska in the 1970s-
80s. Similarly, high and stable prices in the 2000s induced investment in Shifts in national incomes and activity.
the development of alternative sources of crude oil, the most notable being
U.S. shale and Canadian tar sands in the 2000s.
Developments in global oil and energy markets are
accompanied by significant real income shifts
A. Oil production since 1970 B. Oil production since 2000
from energy-importing countries, where the
propensity to spend tends to be higher, to energy-
exporting countries, which tend to have higher
average saving rates. This generally results in
weaker global demand over the medium term. Yet,
the ultimate impact of higher energy prices on
individual countries depends on a wide range of
factors, including the share of oil and other energy
inputs in their exports or imports, their reliance
on the oil sector for tax revenues, their cyclical
Sources: BP Statistical Review; International Energy Agency; World Bank.
Note: OPEC = Organization of the Petroleum Exporting Countries.
positions, and their amount of monetary and fiscal
policy room to react. While the positive impact on
exporters is immediate and, in some cases,
accentuated by financial market easing, the
The lessons from previous energy shocks will be negative impact on energy importers could be
key to inform a long-term solution to the current more diffuse and take some time to materialize.
price hike, especially one that could make
achieving climate change goals less challenging. Higher costs. For consumers, higher energy costs
Measures to promote energy efficiency and decrease real disposable income and reduce
changes in consumer preferences have proven to consumption. This effect is particularly prominent
be instrumental in significantly reducing oil in commodity-importing low-income countries
demand after the 1970s oil shocks. On the other for which fuel constitutes a large fraction of
hand, policies that encouraged the use of coal for consumption (World Bank 2022b). For firms,
electricity generation and price controls have led rising energy prices often imply a sizeable increase
to environmental problems and market in input costs. For energy and oil-intensive sectors,
distortions, respectively (World Bank 2022a). including transportation, petrochemicals, and
These lessons would suggest that countries should agriculture, this would worsen conditions for
focus their policies on promoting energy investment and employment. Agriculture, for
efficiency, investing in renewable energy sources, instance, is 4–5 times more energy intensive than
and pursuing policies to encourage consumers to manufacturing (Baffes et al. 2015).
shift toward low carbon technologies.
Procyclical policy responses. In energy exporters,
rising energy prices can trigger procyclical
Implications for the global increases in public spending (Arezki, Hamilton,
economy and Kazimov 2011; Frankel, Végh, and Vuletin
2013; World Bank 2022b). This procyclicality is
Channels particularly acute in commodity exporting
countries, where governments have tended to raise
Energy prices affect growth and inflation through spending in response to an increase in government
various channels: direct effects on prices and revenues during booms (Frankel 2017). Fiscal
activity for both importers and exporters; indirect policy thus often accentuates the impact of the
effects via trade and other commodity markets; commodity price cycle on economic growth and
monetary and fiscal policy responses; and increases the amplitude of cycles in economic
investment uncertainty. Through these channels, activity (Mendes and Pennings 2020; Riera
energy prices can also have immediate reper- Crichton, Végh, and Vuletin 2015). In contrast,G LO BAL EC O NO MIC P ROS P EC TS | J U NE 2022 S P EC IAL FO CU S 2 85
oil importing countries may see their fiscal Andrle et al. 2015; Blagrave et al. 2020; Dieppe et
positions deteriorate as domestic economic activity al. 2017).3
weakens and the cost of providing fuel subsidies
rises. The results of these previous studies are confirmed
here using simulations of a global semi-structural
Procyclical financial flows. The economic impact model, which suggest that global output would
of rising energy prices can also be magnified by decline by a cumulative 0.3 percent in the second
the financial channel. In energy exporters, higher year of the shock (figure SF2.3.B).4 The impact on
energy prices can trigger increases in domestic the global economy could be even bigger as oil
credit creation and compression of country risk price increases generally appear to have larger
premia, leading to large capital inflows and output effects on oil importing economies than oil
currency appreciation (World Bank 2022b). A price decreases (Hoffman 2012; Jimenez-
surge in capital inflows can be particularly Rodriguez and Sanchez 2005). This asymmetry
problematic if not properly invested, as evidenced could be caused by uncertainty, frictions such as
by the Latin American debt crises of the 1980s wage rigidities, and varying monetary policy
(Eberhardt and Presbitero 2021; Kose et al. 2021; responses to different types of movements in oil
Reinhart, Reinhart, and Trebesch 2016). In prices (Bachmeier and Keen 2018; Kilian and
contrast, energy importers may experience a Lewis 2011; Rahman and Serletis 2011).
tightening of domestic financial conditions,
including as a result of lenders pulling back in the Oil importers. Activity in oil importers should
face of weaker credit quality. This may be further deteriorate in response to higher oil prices since
exacerbated if monetary policy is tightened to these reduce household and corporate real
resist inflation pressures (Baffes et al. 2015). incomes. Past research suggests that a 40 percent
increase in oil prices could lower growth in oil-
Uncertainty. Abrupt changes in energy prices, by importing economies by some 0.4–2.0 percentage
increasing uncertainty, can also have an outsized points, depending on the share of oil imports in
adverse impact on investment and durable goods GDP (Rasmussen and Roitman 2011; World
consumption. For instance, uncertainty generated Bank 2013). Broadly in line with these estimates
by sharp movements in oil prices can hinder the from the literature, simulations of the global
consumption of durable goods (Kilian 2014). model suggest that this shock would lower output
Rising uncertainty of future oil prices can also lead growth in oil-importing advanced economies and
to more precautionary demand of crude oil, with EMDEs by 0.25 percentage point in the first year.
second-order impacts on activity (Anzuini,
Patrizio and Pisani 2014). Oil exporters. In addition to an expansion of the
oil sector, rising oil prices can have a number of
Impact on global activity indirect effects on oil-exporting economies. In
many, government finances rely heavily on taxing
Impact of higher oil prices
Global economy. Oil price movements driven by
3 The literature offers a range of estimates of the impact of a
supply shocks in oil markets are often associated
sustained, supply-driven oil price increase (Baffes et al. 2015; IMF
with significant changes in global output and 2014; OECD 2014). More recent studies report smaller estimates
income shifts between oil exporters and importers primarily because of the recent expansion of oil production in the
United States which has reduced the economy’s overall sensitivity to
(Cashin, Mohaddes, and Raissi 2014; Kilian 2009; oil prices (Gervais 2019).
Peersman and Van Robays 2012). Recent studies 4 These simulations are conducted using the Oxford Economics
using large-scale macroeconomic models indicate Global Economic Model (OEM). The OEM is a global semi-
structural macro projection model which includes 81 individual
that a supply-driven increase in oil prices country blocks, most of which are available at a quarterly frequency,
averaging about 40 percent over two years—the with behavioral equations governing domestic economic activity,
size of the upward revision to World Bank monetary and fiscal policy, global trade, and energy prices (Oxford
Economics 2019). The simulations assume that agents have adaptive
projections—would lower global activity by about expectations, monetary policy is endogenous, and fiscal policy is
0.2-0.6 percent after two years (figure SF2.3.A; largely exogenous.86 S P EC IAL FO CU S 2 G LO BAL EC O NO MIC P ROS P EC TS | J U NE 2022
FIGURE SF2.3 Implications for global economic activity EMDEs by about 1 percent over the same time
The World Bank has significantly increased its projections for oil and horizon.
natural gas prices over the near term. According to a large-scale global
macroeconomic model, the upward revision to oil prices included in
baseline forecasts, if driven by supply shocks, would lower global output
Impact of higher natural gas prices
by about 0.3 percent after two years. The much larger upward revision to
baseline natural gas price forecasts over 2022 and 2023 would be In addition to the drag from elevated oil prices,
expected to lower global output by a similar magnitude. Combined,
supply-driven upward revisions to the prices of oil, natural gas, and coal
several countries are likely to face significant
could lower global output by a cumulative 0.8 percent in 2023. headwinds from sharply higher natural gas prices,
and to a lesser extent, higher coal prices.
A. Energy price projections: June B. Impact on activity of higher Simulations of the global model indicate that a
2022 vs January 2022 baseline oil prices
supply-driven 70 percent increase in natural gas
prices—equivalent to the average upward revision
to World Bank forecasts over 2022-23—would
lower global output by 0.4 percent after two years
(figure SF2.3.C).5 The impact of the gas supply
shock would be greatest for continental Europe
owing to its outsized dependence on Russian
supplies (Bachmann et al. 2022). The larger
incidence on global output of the natural gas price
C. Impact on activity of higher D. Impact on activity of higher shock compared to that of oil is a function of the
baseline natural gas prices baseline energy prices size of the shock—the projected revision to
natural gas prices is nearly double that for oil.
Impact of combined energy price shocks
On net, model simulations suggest that the
upward revisions to energy prices, including to oil,
natural gas and coal, could reduce global growth
by 0.5 percentage point in 2022 and a further 0.3
Sources: Oxford Economics; JP Morgan; World Bank.
percentage point in 2023, lowering global output
Note: BTU = British Thermal Unit; EMDEs = emerging market and developing economies; Mil. =
million; USD = U.S. dollar.
by a cumulative 0.8 percent by 2023 (figure
A. GEP refers to the Global Economic Prospects report. Oil price is the simple average of Brent, SF2.3.D).6 The estimated impact on global growth
Dubai, and West Texas Intermediate prices.
B.D. These scenarios are produced using the Oxford Economics Global Economic Model. for the first year is in line with the results of a
B. Simulation is for supply-driven increases in Brent oil prices averaging 40 percent above baseline
for two years.
similar exercise conducted by the OECD (OECD
C. Simulation is for supply-driven increases in natural gas prices averaging 70 percent above 2022). Advanced economies would experience a
baseline for two years.
D. Chart combines the impacts on global output of the supply-driven increases in Brent oil prices, cumulative reduction in output of 0.9 percent by
natural gas prices, and coal prices. Coal price shock is a supply driven increase in coal prices
averaging 87 percent above baseline for two years.
2023 compared to a 0.6 percent output reduction
in oil-importing EMDEs. The outsized impact on
advanced economies would reflect a particularly
the oil sector, so that higher oil prices tend to
boost revenues and may trigger a fiscal expansion.
In addition, an increase in oil prices generally 5 The impact of the natural gas price shock, which is not well
improves their current account and precipitates explored in the literature, is nonetheless broadly in line with model-
based estimates for a gas-importing advanced economy (Millard
currency appreciation. Previous research suggests 2011).
that output in oil-exporting countries could 6 OEM simulations suggest that an 87 percent rise in global coal
increase by about 0.6–4.8 percent in the year prices—equivalent to the average upward revision to World Bank
forecasts over 2022-23—would only reduce global activity by about
following a 40 percent rise in the annual average 0.1 percent cumulatively after two years. This negligible impact may
oil price (Feldkircher and Korhonen 2012; World reflect the peripheral role of coal in the current version of the model.
Historically, adverse coal supply shocks are estimated to have caused
Bank 2013). A similar shock in the global model marked but short-lived declines in output (van de Ven and Fouquet
would raise the aggregate output of oil-exporting 2017).G LO BAL EC O NO MIC P ROS P EC TS | J U NE 2022 S P EC IAL FO CU S 2 87
large drag in Europe from surging natural gas and 1.1 percentage points in 2023, resulting in a 2
prices as a result of Russia’s invasion of Ukraine percent reduction in global output by 2023.
(Federle et al, 2022; Guénette, Kenworthy and
Wheeler 2022). This is broadly in line with other Policy implications
model-based studies (Ferrara, Mogliani and Sahuc
2022; Mahlstein et al. 2022).7 The adverse impact Policy responses to previous energy shocks have
on EMDEs would be blunted by the positive shown that some polices can be highly effective
impact on EMDE oil exporters, who would see and beneficial (such as increasing energy efficiency
their level of output rise by a net 0.5 percent in and renewable energy mandates), while others can
2023.8 lead to market distortions and environmental
problems (such as price controls and the
These model-based estimates could, however, promotion of coal use for electricity generation in
underestimate the combined drag of higher oil, the 1970s). Given these lessons, policy makers
natural gas, and coal prices on global growth. For today can prioritize policies that encourage greater
instance, the model may underestimate the drag energy efficiency and accelerate the transition
on global activity caused by a near doubling of towards low-carbon energy sources. To cushion
global coal prices. It could also fail to appreciate the adverse effects of households, temporary
how elevated prices for all hydrocarbon energy targeted support to vulnerable groups can be
sources could limit the ability of countries to prioritized over energy subsidies, which in the
substitute for lower-cost energy sources in the near current context, could delay the transition to a
term. zero-carbon economy (World Bank 2022a).
Lastly, an even more severe scenario for energy
prices could be envisioned, such as a Russian
embargo on energy exports to the EU and the References
imposition by the EU and the U.S. of sanctions
targeting shipping companies or third parties Andrle, M., P. Blagrave, P. Espaillat, M. K. Honjo, M.
B. Hunt, M. Kortelainen, R. Lalonde, et al. 2015. “The
purchasing Russian oil, possibilities that are
Flexible System of Global Models – FSGM.” IMF
explored in the risk section of chapter 1. This Working Paper 15/64, International Monetary Fund,
scenario would include further unanticipated Washington, DC.
shocks to energy markets and a material
deterioration of confidence in the euro area, Anzuini, A., P. Pagano, and M. Pisani. 2014.
resulting in an additional drag on global growth of “Macroeconomic Effects of Precautionary Demand for
0.4 percentage point in 2022 and 0.8 percentage Oil.” Journal of Applied Econometrics 30 (6): 968-86.
point in 2023. Thus, when combined, energy Arezki, R., K. Hamilton, and K. Kazimov. 2011.
supply-related shocks in the baseline and in the “Resource Windfalls, Macroeconomic Stability and
energy price spike scenario could reduce global Growth: The Role of Political Institutions.” IMF
output growth by 0.9 percentage point in 2022 Working Paper 11/142, International Monetary Fund,
Washington, DC.
7 Several other studies have quantified the global growth impacts
Bachmann, R., D. Baqaee, C. Bayer, M. Kuhn, A.
of scenarios related to a worsening of disruptions to Russia’s energy Löschel, B. Moll, A. Peichl, et al. 2022. “What If
exports. IMF (2022) finds that more severe disruptions to European Germany Is Cut Off From Russian Energy?”
imports of Russian energy, combined with global supply disruptions VoxEU.org, CEPR Policy Portal, March 25. https://
and adverse confidence shocks would lower global output by about voxeu.org/article/what-if-germany-cut-russian-energy.
0.5 percent in 2022 and 1 percent in 2023—over and above
downward revisions to the baseline outlook. Similarly, McFee (2022)
presents an alternative baseline featuring a worsening of the war in
Bachmeier, L., and B. D. Keen. 2018. “Modeling the
Ukraine accompanied by sharply higher oil and natural gas prices. In Asymmetric Effects of an Oil Price Shock.” Kansas
this scenario, global output would be lower by 0.6 percent in 2022 State University, New York.
and 1.1 percent in 2023.
8 Growth in oil-exporting EMDEs would be 0.8 percentage point
Baffes, J., M. A. Kose, F. Ohnsorge, and M. Stocker.
higher in 2022 and 0.3 percentage point lower in 2023 as a result of 2015. “The Great Plunge in Oil Prices: Causes,
the upward revision to oil prices.88 S P EC IAL FO CU S 2 G LO BAL EC O NO MIC P ROS P EC TS | J U NE 2022
Consequences, and Policy Responses.” Policy Research Proximity Penalty.” VoxEU.org, CEPR Policy Portal,
Note 15/01, World Bank, Washington, DC. 18 April. https://voxeu.org/article/economic-spillovers-
war-ukraine-proximity-penalty.
Baffes, J., A. Kabundi, P. Nagle, and F. Ohnsorge.
2018. “The Role of Major Emerging Markets in Global Feldkircher, M. and I. Korhonen. 2012. “The Rise of
Commodity Demand.” Policy Research Paper 8495, China and its Implications for Emerging Markets -
World Bank, Washington, DC. Evidence from a GVAR Model.” Institute for
Economies in Transition Discussion Papers 2012-20,
Baffes, J., and P. Nagle. 2022. Commodity Markets: Bank of Finland.
Evolution, Challenges, and Policies. Washington, DC:
World Bank. Ferrara, L., M. Mogliani, and J.-G. Sahuc. 2022.
“High-Frequency Macroeconomic Risk Measures in
Blagrave, P., C. Godbout, J.D. Guénette, R. Lalonde, the Wake of the War in Ukraine.” VoxEU.org, CEPR
and N. Perevalov. 2020. “Impact: The Bank of Policy Portal, April 7. https://voxeu.org/article/war-
Canada’s International Model for Projecting Activity.” ukraine-and-high-frequency-macroeconomic-risk-
Technical report, Canadian Economic Analysis measures.
Department, Bank of Canada, Ottawa.
Frankel, J. A. 2017. “How to Cope with Volatile
Cashin, P., K. Mohaddes, and M. Raissi. 2014. “The Commodity Export Prices: Four Proposals.” CID
Differential Effects of Oil Demand and Supply Shocks Faculty Working Paper 335, Center for International
on the Global Economy.” Energy Economics 44 (July): Development, Harvard University, Cambridge, MA.
113-134.
Frankel, J. A., C. A. Végh, and G. Vuletin. 2013. “On
Cole, R. 1981. “The Japanese Automotive Industry. Graduation from Fiscal Procyclicality.” Journal of
Model and Challenge for the Future?” Center for Development Economics 100 (1): 32-47.
Japanese Studies, University of Michigan, Ann Arbor,
Michigan. Gervais, O. 2019. “How Oil Supply Shocks Affect the
Global Economy: Evidence from Local Projections.”
Comtrade (database). United Nations. Accessed on
Bank of Canada Staff Discussion Paper 2019-6, Bank
April 20, 2022. https://comtrade.un.org.
of Canada, Ottawa.
Dieppe, A., G. Georgiadis, M. Ricci, I. Van Robays,
Guénette, J. D., P. Kenworthy, and C. Wheeler. 2022.
and B. van Roye. 2017. “ECB-Global: Introducing
“Implications of the War in Ukraine for the Global
ECB’s Global Macroeconomic Model for Spillover
Economy.” Equitable Growth, Finance, And
Analysis.” Working Paper 2045, European Central
Institutions Policy Note, World Bank, Washington,
Bank, Frankfurt.
DC.
Eberhardt, M., and A. Presbitero. 2021. “Commodity
Prices and Banking Crisis.” CEPR Discussion Paper Hamilton, J. 2009. “Causes and Consequences of the
15959, Center for Economic Policy Research, London. Oil Shock of 2007-08.” NBER Working Paper, 15002,
National Bureau of Economic Research, Cambridge,
EC (European Commission). 2022. “Communication MA.
from the Commission to the European Parliament, the
European Council, the Council, the European Hoffman, R. 2012. “Estimates of Oil Price Elasticities.”
Economic and Social Committee and the Committee IAEE Energy Forum Newsletter, 1st Quarter 2012,
of the Regions.” European Commission, Brussels. International Association for Energy Economics,
Cleveland, Ohio.
EIA (Energy Information Administration). 2022.
“Short-Term Energy Outlook.” U.S. Energy Ilkenberry, G. 1988. Reasons of State: Oil Politics and
Information, Administration, Washington, DC. the Capacities of American Government. Ithaca, NY:
Cornell University Press.
EPA (Environmental Protection Agency). 2007.
“Summary of the Energy Independence and Security IMF (International Monetary Fund). 2014. “2014
Act, Public Law 110-140.” U.S. Environmental Spillover Report.” International Monetary Fund,
Protection Agency, Washington, DC. Washington, DC.
Federle J., A. Meier, G. Müller, and V. Sehn. 2022. Jimenez-Rodriguez, R., and M. Sanchez. 2005. “Oil
“Economic Spillovers from the War in Ukraine: The Price Shocks and Real GDP Growth: EmpiricalG LO BAL EC O NO MIC P ROS P EC TS | J U NE 2022 S P EC IAL FO CU S 2 89
Evidence for Some OECD Countries.” Applied Oxford Economics. 2019. “Global Economic Model.”
Economics 37 (2): 201-228. July. Oxford Economics, Oxford, U.K.
Kilian, L. 2009. “Not All Oil Price Shocks Are Alike: Peersman, G., and I. Van Robays. 2012. “Cross-
Disentangling Demand and Supply Shocks in the Country Differences in the Effects of Oil Shocks.”
Crude Oil Market.” American Economic Review 99 (3): Energy Economics 34 (5): 1532-1547.
1053-69.
Rahman, S., and A. Serletis. 2011. “The Asymmetric
Kilian, L. 2014. “Oil Price Shocks: Causes and Effects of Oil Price Shocks.” Macroeconomic
Consequences.” Annual Review of Resource Economics 6 Dynamics 15 (S3): 437-471.
(1): 133-154.
Rasmussen, T. N., and A. Roitman. 2011. “Oil Shocks
Kilian, L., and L. T. Lewis. 2011. “Does the FED in a Global Perspective: Are they Really that Bad?” IMF
Respond to Oil Price Shocks?” The Economic Journal Working Paper 11/194, International Monetary Fund,
121 (555): 1047–72. Washington, DC.
Kose, M. A., P. Nagle, F. Ohnsorge, and N. Sugawara. Reinhart, C. M., V. Reinhart, and C. Trebesch. 2016.
2021. Global Waves of Debt: Causes and “Global Cycles: Capital Flows, Commodities, and
Consequences. Washington, DC: World Bank. Sovereign Defaults.” American Economic Review 106
(5): 574-580.
Lafrogne-Joussier, R., A. Levchenko, J. Martin, I.
Mejean. 2022. “Beyond Macro: Firm-Level Effects of Riera-Crichton, D., C. Végh, and G. Vuletin. 2015.
Cutting Off Russian Energy.” VoxEU.org, CEPR “Procyclical and Countercyclical Fiscal Multipliers:
Policy Portal, April 24. https://voxeu.org/article/firm- Evidence from OECD Countries.” Journal of
level-effects-cutting-russian-energy. International Money and Finance 52 (C): 15-31.
Mahlstein, K., C. McDaniel, S. Schropp, and M. Scott, R. 1994. “The History of the International
Tsigas. 2022. “Potential Economic Effects of Sanctions Energy Agency. Volume Two. Major Policies and
on Russia: An Allied Trade Embargo.” VoxEU.org, Actions.” International Energy Agency, Paris.
CEPR Policy Portal, May 6. https://voxeu.org/article/
potential-economic-effects-allied-trade-embargo-russia. Shibata, H. 1982. “The Energy Crises and Japanese
Response.” Resources and Energy 5 (2): 129-154.
McFee, I. 2022. “A Darker Economic Scenario from
Russia’s War.” Global Research Briefing, Oxford U.S. Congress. 1975. “Public Law 94-163.” Energy
Economics, Oxford, U.K. Policy and Conservation Act, 42 USC 6201 Note.
Mendes, A., and S. Pennings. 2020. “One Rule Fits van de Ven, D. J. and R. Fouquet. 2017. “Historical
All? Heterogenous Fiscal Rules for Commodity Energy Price Shocks and Their Changing Effects on the
Exporters when Price Shocks Can be Persistent: Theory Economy.” Energy Economics 62 (February): 204–16.
and Evidence.” Policy Research Working Paper 9400,
World Bank, Washington, DC. World Bank. 2013. Global Economic Prospects: Less
Volatile, but Slower Growth. June. Washington, DC:
Millard, S. 2011. “An Estimated DSGE Model of World Bank.
Energy, Costs and Inflation in the United Kingdom.”
Working Paper 432, Bank of England, London. World Bank. 2021. Commodity Markets Outlook:
Urbanization and Commodity Demand. October.
OECD (Organisation for Economic Co-operation and Washington, DC: World Bank.
Development). 2014. OECD Economic Outlook:
Volume 2014/2. Paris: OECD. World Bank. 2022a. Commodity Markets Outlook—The
Impact of the War in Ukraine on Commodity Markets .
OECD (Organisation for Economic Co-operation and April. Washington, DC: World Bank.
Development). 2022. “Economic and Social Impacts
and Policy Implications of the War in Ukraine.” OECD World Bank. 2022b. Global Economic Prospects.
Economic Outlook, Interim Report, Paris. January. Washington, DC: World Bank.You can also read