SABAF: the total cooking company for a quality life - Sabaf Group
←
→
Page content transcription
If your browser does not render page correctly, please read the page content below
SABAF: the total cooking company for a quality life

www.sabafgroup.com
FINANCIAL PRESENTATION

                    Investors meeting

8th June 2022
Table of contents

 I.     COMPANY PROFILE

 II.    I QUARTER 2022 RESULTS

 III.   2022 OUTLOOK

 IV.    SABAF INDUCTION

 V.     SUSTAINABILITY

 VI.    BUSINESS PLAN 2021 - 2023

                                    3
COMPANY PROFILE

                  4
Sabaf Group: evolution

                         SABAF BRAZIL                            OKIDA
                         GREENFIELD                              ACQUISITION               SABAF INDIA
                         Gas components                          Electronics               GREENFIELD
                                                                                           Gas components
                                             SABAF CHINA
     THE LISTING                             GREENFIELD
                                             Gas components
                                                                                                                        TECHNOLOGICAL

                                                                                                                        SMART
  1950            2000                2012                2016                     2019                        SABAF
                                                                                                             GROUP IN   DIVERSIFIED
                                                                                                                THE
                                                                                                              FUTURE    INTERNATIONAL
         1998               2001              2015                   2018                       2022

                                                                                                                        SUSTAINABLE

   THE                                 SABAF TURKEY                               C.M.I.
FOUNDATION                             GREENFIELD                                 ACQUISITION
                                       Gas components                             Hinges

                                                           A.R.C.
             FARINGOSI-HINGES                              ACQUISITION                          SABAF MEXICO
             ACQUISITION                                   Professional burners                 GREENFIELD
             Hinges                                                                             Burners and Hinges
                                                                                                                                        5
Sabaf Group: product range

               GAS                             HINGES         ELECTRONIC COMPONENTS
 •   Standard Burners                                         •   Cooker Hoods
                                   •   Ovens
 •   Special Burners                                          •   Ovens
                                   •   Dishwashers
 •   Professional Burners                                     •   Cookers and hobs
                                   •   Washing machines
 •   Oven and Grill Burners                                   •   Vitroceramic hobs control cards
                                   •   Special applications
 •   Gas Valves                                               •   Air Curtain
                                   •   Small compartments
 •   Gas Oven Thermostats                                     •   Refrigerators/freezers
                                   •   Catering appliances
 •   Microswitches & Accessories                              •   Other products

                                                                                                    6
▪ 2021: 10 production plants
Sabaf Group: industrial footprint                  ▪ By 2022: 13 production plants
                                                     (5 in Italy and 8 abroad)
SABAF S.P.A.              CMI POLAND               ▪ 1,510 employees
Valves and thermostats    Dishwasher hinges
Standard burners
Special burners                                                       SABAF TURKEY
                                                                      Burners, valves, hinges
ARC S.R.L.
                                                                      and Electronics
Professional burners
                                                                      OKIDA ELEKTRONIK
FARINGOSI-HINGES S.R.L.                                               Electronics for household
Oven hinges                                                           appliances
Dishwasher hinges

CMI ITALY                                                           SABAF APPLIANCE
Oven hinges
                                                                    COMPONENTS (KUNSHAN)
Dishwasher hinges
                                                                    Wok burners

                                                                    NEW
                                                                    SABAF INDIA
NEW                                                                 Valves and burners
SABAF MEXICO                    SABAF BRASIL                       SOP - H1 2022
Burners and hinges              Standard burners
SOP - Q4 2022                   Special burners
                                                                                                  7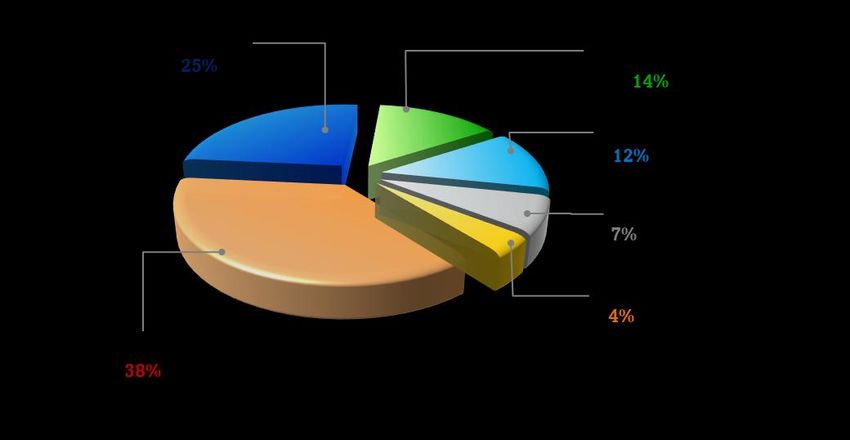
Sabaf Group: business diversification

                           SALES by division                                             GAS
   WIDENING PRODUCT
        RANGE

                                                                                        HINGES

                            2018   2019   2020   2021   IQ2022   2023   2024   2025
  DIVERSIFICATION

                           EBITDA by division
                                                                                      ELECTRONICS

  DIVERSIFICATION OF
    PROFITABILITY
                            2018   2019   2020   2021   IQ2022

                                                                                                    8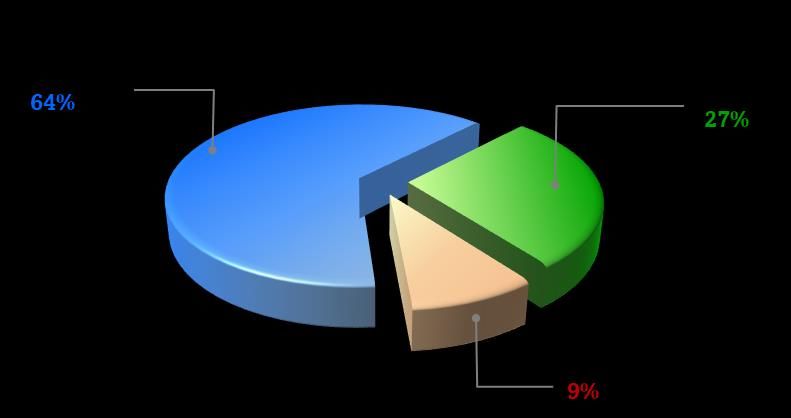
Sabaf Group
Market

  Global leader in the segment of
  components for domestic
                                           No customer represents more than
  appliances with 400 customers in 58
                                           8% of total Group sales
  different countries:
  ▪ Gas components - a strong
      leadership in Europe (market share
      above 40%), estimated market
      share worldwide of about 10%

  ▪   Hinges - Top Player. Market share
      above 30% worldwide.
                                           Long-term agreements and strong
  ▪   Electronics- New player, strong      relationships with all the main
      growth                               players in the household appliances
                                           business, based on mutual trust,
                                           technical cooperation, co-engineering
                                           and tailor-made products

      Weight of top 10 customers on
      total Group sales is 47%

                                                                                   9
Sabaf Group
Product & technology

                Product Innovation:                                              Strong operational
                88 active patents                                                leverage: great flexibility in
                                                                                 production volumes growth,
                                                                                 ready to satisfy customers
                                                        Intellectual capital:    requests
                                                        highly specialized and
                                                        qualified staff
                                                        (70+ R&D engineers)

                       Know-how:

                       ➢ Mechanical: forefront
                         process technology -
                         internal development of
                         special machinery, high
                         performance molds for
                         robotic die-casting, high
                         speed and high precision
                         tools not available on the
                         market

                       ➢ Electronic: strong skills in
                         new product development
                                                                                                                  10
Sabaf Group
Main Shareholders
% OF SHARE CAPITAL % OF VOTING RIGHTS
20.94 % Cinzia Saleri S.a.p.a. 30.45 % Quaestio SGR
20.00 % Quaestio SGR 15.94 % Cinzia Saleri S.a.p.a.
7.66 % Fintel S.r.l. 11.44% Fintel
4.95 % Paloma Rheem Investments 6.81 % Paloma Rheem Investments
3,03% Treasury Shares 35.36 % Market
43.42 % Market
Pietro Iotti, CEO of Sabaf,
owns 1.6%
11Sabaf Group
Stock price
Stock price evolution – 1 year
Dividends
Payout year 2021 2022
€ per share 0,55 0,60
Stock price at
Total amount € 6,1 mn € 6,7 mn
May 31st,
2022: €25.50 Dividend yield 2,4% 2,4%
Payout ratio 45,4% 30,2%
May-21 Jul-21 Sept-21 Nov-21 Jan-22 Mar-11 May-22
Market cap.: € 294.1 mn at June 1st, 2022
Performance SABAF FTSE MIB FTSE Italia All- Consensus Overview FY 2022E FY 2023E
(change) Share
Price/EPS 11.32 10.35
1-month (%) + 4.29% + 1.04% + 0.94%
EV/EBITDA 7.11 6.65
6-month (%) + 11.35% - 5.07% - 5.47%
EV/EBIT 10.67 9.93
12-month (%) - 6.59% - 2.64% - 3.08%
Source: Bloomberg Consensus June 1st, 2022
YTD (%) + 6.25% - 10.39% - 10.62%
12I QUARTER 2022 RESULTS
13Performance data
Income statement - I quarter 2022 vs. I quarter 2021
Δ%
€ x 000 IQ 2022 IQ 2021 12 MONTHS 2021
22 - 21
Revenue 70,852 100.0% 64,825 100.0% +9.3% 263,259 100.0%
Other income 2,585 3.6% 1,888 2.9% 8,661 3.3%
Total operatig revenue and income 73,437 66,713 271,920
Materials (39,336) (55.5%) (36,947) (57.0%) (142,355) (54.1%)
Personnel costs (13,462) (19.0%) (13,886) (21.4%) (53,964) (20.5%)
Change in inventories 5,943 8.4% 11,535 17.8% 29,922 11.4%
Other operating costs (13,558) (19.1%) (12,307) (19.0%) (51,383) (19.5%)
EBITDA 13,024 18.4% 15,108 23.3% -13.8% 54,140 20.6%
Depreciation (4,068) (5.7%) (4,132) (6.4%) (16,869) (6.4%)
Gains/losses on fixed assets 129 0.2% 44 0.1% 237 0.1%
Write-downs/write-backs of non-current assets - 0.0% - 0.0% - 0.0%
EBIT 9,085 12.8% 11,020 17.0% -17.6% 37,508 14.2%
Net financial expense 238 0.3% 289 0.4% (429) (0.2%)
Exchange rate gains and losses (126) (0.2%) (849) (1.3%) (7,399) (2.8%)
Profits and losses from equity investments (48) (0.1%) (46) (0.1%) - 0.0%
EBT 9,149 12.9% 10,414 16.1% -12.1% 29,680 11.3%
Income taxes (1,695) (2.4%) (1,646) (2.5%) (4,997) (1.9%)
PROFIT FOR THE YEAR 7,454 10.5% 8,768 13.5% -15.0% 24,683 9.4%
Minority interests - 0.0% 312 0.5% 780 0.3%
PROFIT ATTRIBUTABLE TO THE GROUP 7,454 10.5% 8,456 13.0% -11.8% 23,903 9.1%
14Performance data
Income statement - I quarter 2022 vs. IV quarter 2021
Δ%
€ x 000 IQ 2022 IVQ 2021 12 MONTHS 2021
22 - 21
Revenue 70,852 100.0% 62,487 100.0% +13.4% 263,259 100.0%
Other income 2,585 3.6% 2,682 4.3% 8,661 3.3%
Total operatig revenue and income 73,437 65,169 271,920
Materials (39,336) (55.5%) (33,168) (53.1%) (142,355) (54.1%)
Personnel costs (13,462) (19.0%) (13,042) (20.9%) (53,964) (20.5%)
Change in inventories 5,943 8.4% 4,794 7.7% 29,922 11.4%
Other operating costs (13,558) (19.1%) (13,782) (22.1%) (51,383) (19.5%)
EBITDA 13,024 18.4% 9,971 16.0% +30.6% 54,140 20.6%
Depreciation (4,068) (5.7%) (4,151) (6.6%) (16,869) (6.4%)
Gains/losses on fixed assets 129 0.2% 111 0.2% 237 0.1%
Write-downs/write-backs of non-current assets - 0.0% - 0.0% - 0.0%
EBIT 9,085 12.8% 5,931 9.5% +53.2% 37,508 14.2%
Net financial expense 238 0.3% (340) (0.5%) (429) (0.2%)
Exchange rate gains and losses (126) (0.2%) (6,132) (9.8%) (7,399) (2.8%)
Profits and losses from equity investments (48) (0.1%) 38 0.1% - 0.0%
EBT 9,149 12.9% (503) -0.8% +1918.9% 29,680 11.3%
Income taxes (1,695) (2.4%) 1,129 1.8% (4,997) (1.9%)
PROFIT FOR THE YEAR 7,454 10.5% 626 1.0% +1090.7% 24,683 9.4%
Minority interests - 0.0% (14) (0.0%) 780 0.3%
PROFIT ATTRIBUTABLE TO THE GROUP 7,454 10.5% 640 1.0% +1064.7% 23,903 9.1%
15Performance data
Sales - Quarter Analysis
Figures in euro million
16Performance data
Sales by market
€ x 000 IQ 2022 IQ 2021
Europe (excluding Turkey) 26,467 24,052 +10.0%
Turkey 17,747 16,276 +9.0%
North America 10,145 7,301 +39.0%
South America 8,743 9,890 -11.6%
Africa and Middle East 5,086 3,908 +30.1%
Asia and Oceania 2,664 3,398 -21.6%
Total 70,852 64,825 +9.3%
17Performance data
Sales by product
€ x 000 IQ 2022 IQ 2021
Gas 45,032 44,589 +1.0%
Hinges 19,496 14,319 +36.2%
Electronics 6,324 5,917 +6.9%
Total 70,852 64,825 +9.3%
18Performance data
Balance Sheet
31/03/2022 31/12/2021 31/03/2021
€ x 000
Fixed assets 132,414 130,093 132,244
Inventories 70,395 64,153 50,081
Trade receivables 78,780 68,040 73,020
Tax receivables 6,926 6,165 2,980
Other current receivables 4,396 3,136 2,865
Trade payables (58,765) (54,837) (51,883)
Tax payables (6,559) (4,951) (4,487)
Other payables (12,493) (13,075) (12,030)
Net working capital 82,680 68,631 60,546
Provisions for risks and severance
(8,177) (8,681) (9,271)
indemnity
Capital Employed 206,917 190,043 183,519
Equity 131,463 122,436 123,886
Net debt 75,454 67,607 59,633
Sources of finance 206,917 190,043 183,519
19Performance data
Cash flow statement
€ x 000 IQ 2022 12 MONTHS 2021 IQ 2021
Working capital
Cash at the beginning of the period 43,649 13,318 13,318 • The growth in working capital reflects higher
Net profit 7,454 24,683 8,768 levels of activity; and the need to temporarily
Depreciation 4,068 16,869 4,132 increase stock levels to ensure continuity of
Other income statement adjustments 1,808 5,810 1,087 production and deliveries
• At 31 March 2022, the impact of the NWC on
Change in net working capital revenue was 29.2% compared to 26.1% at 31
- Change in inventories (6,254) (24,929) (10,857) December 2021
- Change in receivables (10,742) (4,604) (9,584)
- Change in payables 3,945 13,064 10,110
(13,051) (16,469) (10,331)
Other changes in operating items (3,110) (7,677) 324
Operating cash flow (2,831) 23,216 3,980
Financial Debt
Investments, net of disposals (5,812) (23,752) (6,718)
• In December 2021 Sabaf issued a € 30 mn 10-
Free Cash Flow (8,643) (536) (2,738) year bond, fully subscribed by PRICOA Private
Cash flow from financial activity (4,876) 47,405 1,637 Capital
• Such placement allows us to diversify our sources
Own shares buyback - - -
of funding and support our organic and external
Dividends - (6,172) -
growth
CMI and ARC acquisitions - (6,393) -
Deconsolidation / consolidation ARC Handan (97) 97 -
Forex 816 (4,070) (374)
Net financial flow (12,800) 30,331 (1,475)
Cash at the end of the period 30,849 43,649 11,843
20Performance data
Financial Indicators
IQ 2022 IQ 2021 12 MONTHS 2021
Change in turnover
+9.3% +47.8% +42.4%
(vs. previous year)
vs. IQ 21 vs. IQ 20 vs. 12M 20
ROCE (return on capital employed) 17.6% 24.0% 19.7%
Net debt/EBITDA 1.45 0.99 1.25
Net working capital/Turnover 29.2% 23.3% 26.1%
Net debt/equity 57.4% 48.1% 55.2%
Days of Sales Outstanding 100 101 101
Days of Payables Outstanding 99 95 96
Days of Inventory Outstanding 105 87 99
212022 OUTLOOK
22Outlook 2022
SALES 2022 TOTAL SALES: € 275 - 280 mn
• +5% / 6% on 2021
EBITDA PROFITABILITY in line with historical averages
The increase in sales from new projects is continuing in line with forecasts, although the uncertainty
caused by the prolongation of the conflict between Russia and Ukraine.
23Outlook 2022 - Previous forecasts confirmed
SALES
The Group has non-significant
direct exposure to these markets
RUSSIA - UKRAINE
CONFLICT IMPACTS
PROFITABILITY MITIGATION of Global industrial footprint
impacts on profitability
Increase in energy costs Further sales prices
adjustments
Increase in raw material prices
Energy prices partly hedged
Global logistics constraints
24SABAF INDUCTION
25Extract form Business Plan 2021-2023 released in March 2021
GAS
▪ Premium flame valves
▪ High performances burners for better combustion efficiency
▪ New burners for North America market
▪ New models of professional burners
RESEARCH
AND
DEVELOPMENT HINGES
▪ Hinges for top load washers
▪ Customized hinges for specific markets and customers
▪ Motorized hinges
ELECTRONICS
▪ Development of new oven controls
R&D activities will focus on ad hoc ▪ Vitroceramic hobs control cards
solutions to meet the needs ▪ Completion of product range for cooker hood controls
of individual markets and on the design of ▪ Feasibility study of induction cooking
customized products ▪ Development of products for new business sectors like medical appliances,
dishwashers, dryers, heaters, etc.
100+ R&D engineers
26Sabaf Induction
The Sabaf Group enters the 2022
Induction cooking sector
and
becomes a global manufacturer in
all cooking technologies:
SABAF
INDUCTION
▪ Gas
▪ Traditional electric (radiant)
▪ Induction
IS BORN
CLICK HERE to watch the video
27Diversification in 4 divisions
Gas Hinges Electronics Induction
+
28Sabaf Induction: business strategy
1 The Sabaf Group aims to become a key player in the large induction cooking market
Through this strategic investment Sabaf intends to turn out as leader and innovator not only in
2 the mechanical sector, but also in electronics and new technologies
The inclusion of induction technology will lead the Group to be one of the few players able to
3 fully cover the cooking surface technologies
4 Sabaf aims to carry on along the sustainable growth path in the respect of the environment
5 This project will push Sabaf to a further evolution and deep transformation in the next few years
29Sabaf Induction: business strategy
The European market of induction cooking components, estimated at around €500 million
MARKET ▪ Steady growth for several years at a rate of over 10%
▪ Highly concentrated market with few players (Technology complexity)
Investment plan
PROJECT ▪ About €5 million in R&D in the period 2021 – 2023
▪ Setting up of a dedicated project team in Italy
Research and development activities
▪ Sabaf has developed its own project know-how internally by filing proprietary patents, software and hardware
▪ Creation of innovative products which better meet manufacturers' needs and new consumer trends
▪ The Group benefits from the expertise gained from the acquisition of Okida – the Turkish company of Sabaf Group already designated
to electronics and where part of the induction cooking components will be produced
▪ Team of more than 50 electronic engineers
The project technological flexibility will enable Sabaf to offer to its clients customised products
30Sabaf Induction: business strategy
Research Development Pre-series Mass Production
4Q 4Q 2Q 2Q 4Q
2020 2021 2022 2023 2024
▪ 5 product platforms which cover the whole market with customisation opportunities
▪ The first prototypes will be released from June 2022
▪ Production will start by the first half of 2023
▪ Sabaf network for sales and distribution
▪ Very positive customer feedback (agreements with some important players have been already signed)
▪ Objective: at least 5% of the non-captive European market by 2025, further expansion in the following
years
31Sabaf Induction: business strategy
Cross-selling: Sabaf sales network with more than 380 customers in the household appliances
field. Sabaf holds long-standing relationships based on reliability and mutual trust
Purchase of electronic components:
▪ Okida
▪ Purchasing department in China with specialised technical buyers
GROUP
SYNERGIES
Access to Okida’s electronical know-how
Design and development in Italy, components manufactured in Sabaf Italy and
Okida (Turkey)
32Sabaf Group: technological evolution and widening of the industrial footprint
The starting point is our history, a solid and strong base, mainly in metalworking,
which continues with an electronical evolution:
▪ 2018: Electronics (Okida acquisition)
▪ 2020: production of radiant cooktops components (vitroceramic)
Sabaf Group ▪ 2022: design, development and sale of induction cooktops components
designs its
FUTURE through
the technological Investments and projects to become a global company, able to offer cooking
evolution and the systems for every market
widening of the ▪ Emerging countries: gas cooking (evolution of the industrial footprint: after
industrial Turkey and Brazil also China, India and Mexico)
footprint ▪ Western countries (mainly Europe): electric cooking (radiant and induction)
Next steps: hydrogen
Hy4Heat trial project (UK) which is going on with the
starting of Phase 2
33SUSTAINABILITY
34Sustainability
Business Model
«We believe in a world in which all people’s basic needs, such as home, food and reliable energy, are
VISION fulfilled in an environmentally sustainable way. We promote a company that improves the
quality of the environment and the communities where we live and work»
«Consolidate the technological and market leadership in the design, production and distribution of
a wide range of components for household appliances through constant attention to innovation,
MISSION safety and the enhancement of internal expertise.
Associate business growth with social and environmental sustainability, promoting an open
dialogue with the legitimate expectations of stakeholders»
SUSTAINABILITY
• Innovation • Widening the range of components through
STRATEGIC • Eco-efficiency by improving burners efficiency acquisitions
PILLARS • Safety (gas components) • Enhancement of intangible assets and
• Partnerships with multinational groups intellectual capital
BUSINESS HR Costs
OBJECTIVES SPECIFIC
Investments
PLAN Benefits/returns
PROJECTS
HSE QUARTERLY
MONITORING
LTIP
35Sustainability
Business plan 2021 – 2023 KPI
“the
The Sabaf Group has always considered sustainability to be an integral part of its Business Model. With the Business Plan 2021 - 2023,
Group promotes the improvement of the quality of the environment and the community in which it operates so that the basic needs
“
of all are met in an environmentally sustainable way.
2021 TARGET
AREA KPI PLANNED ACHIEVED
Development of resources Hours of training per
1 and skills capita
11 YES 20,4
Accident frequency rate
2 Health and safety 140 NO 327
Accident severity rate
Eco-efficiency and Emissions tCO2eq emissions on
3 into the atmosphere sales
126 YES 111
36Sustainability
CDP rewards Sabaf’s commitment
In its In its second
second year of year of participation,
participation, Sabafareceived
Sabaf received a B-inrating
B- rating CDP's in CDP'sChange
Climate Climate
section,
on a scale ranging from Change
A to F.section, on a scale ranging from A to F.
"This excellent rating is an important acknowledgement of the Sabaf Group's ongoing commitment to
In its second year of participation, Sabaf received a B- rating in CDP's Climate Change
the challenge of combating climate change: priority in the management of environmental issues, also
through product and processsection, on isa an
innovation, scale ranging
integral part offrom A to F.
our strategy."
CDP is the world's leading environmental performance reporting programme: more
than 13,000 companies, representing 64% of global market capitalization, published
their environmental data through CDP in 2021. CDP requires companies to report
information on environmental governance, related risks and opportunities
performance in terms of energy consumption and emissions and reduction targets.
37Sustainability
Hydrogen: Sabaf Group partner in the Hy4Heat project
TheInSABAF
its second
Groupyear of participation,
is one Sabaf suppliers
of the key strategic received atoB-the
rating in CDP's
British Climate Change
Government’s hydrogen
feasibility project Hy4Heat. section, on a scale ranging from A to F.
The project aims to establish whether it is technically possible, safe and convenient to replace natural gas with
100% hydrogen in residential and commercial buildings and gas appliances. The project is financed by BEIS, (UK
governments Department for Business, Energy, and Industrial Strategy) and involves ten separate work packages.
The Sabaf Group, through its subsidiary ARC, is involved in the Work Package 4, which covers cooking and
heating appliances. ARC has developed and produced the burners that are included in the world's first ranges of
100% hydrogen powered hobs and cookers.
These were installed on Glen Dimpex cooking appliances at HyHome, two houses featuring hydrogen appliances in a
"real life" scenario in Low Thornley, near Gateshead, Northern England.
Immediately following the Hy4Heat project, the cooking appliances with ARC burners will be specified for the
Community Trial involving 300 homes commencing in 2022. Beyond the Community Trial, the UK Government
intends to commission a ‘Village Trial’ with around 2,500 homes in 2025 and a ‘Town Trial’ (10,000 homes) in
the latter part of the decade prior to potentially converting the whole UK gas grid to hydrogen over future years
ARC is involved also in Work Package 5B (Development of hydrogen commercial appliances, which includes
catering equipment) and has developed burners for Falcon Foodservice Equipment Ltd.
CLICK
to watch the video of the Hy4Heat project!
HERE
38BUSINESS PLAN 2021 - 2023
39Business plan 2021 – 2023 (released in March 2021 and overcome by 2021 actual results)
TOTAL SALES by 2023
around INVESTMENTS in 3 years
+62% vs. 2020 CAGR > 17.5%
€ 300 mn • Organic CAGR >10%:
€ 130 mn • Organic: € 58 mn capex,
of which € 46 mn for growth and
SALES around € 250 mn sales by 2023 € 12 mn in maintenance
• M&A: € 50 mn sales by 2023 • M&A: up to € 72 mn investment
KEY POINTS
DIVIDENDS in 3 years
€ 57 mn EBITDA • Total amount higher than previous years
EBITDA at least 19% on sales € 20 mn (2018 - 2020: € 16 mn)
by 2023 • Lower payout to support future growth
at least ROI 12.5%
+100 bps Compared to 11.5% in 2020 FINANCED with:
• OPERATING CASH FLOW € 85 mn in 3 years
• NEW FINANCIAL DEBT up to € 65 mn by 2023
FINANCIAL LEVARAGE
~ 2.0 Net debt/EBITDA around 2.0
40Business plan 2021 - 2023
Organic growth (released in March 2021 and overcome by 2021 actual results)
CAGR: +10.6%
Figures in euro million 41Business plan 2021 - 2023
Organic growth - Market development (released in March 2021 and overcome by 2021 actual results)
Var %
MARKET 2020 2021 2022 2023 2023 vs. 2020
CAGR
EUROPE (excl. Turkey) 69.6 76.3 80.3 86.6 +24.5% 7.6%
TURKEY 44.8 51.6 55.6 56.6 +26.3% 8.1%
NORTH AMERICA 22.7 27.5 32.2 37.2 +63.6% 17.8%
SOUTH AMERICA 27.6 29.0 30.4 32.9 +18.9% 5.9%
AFRICA AND MIDDLE EAST 12.2 14.1 14.1 16.1 +32.5% 9.8%
CHINA AND FAR EAST 6.8 10.3 11.5 14.2 +101.1% 28.1%
INDIA 1.2 1.7 4.3 6.9 +468.0% 78.4%
TOTAL 184.9 210.5 228.4 250.5 +35.5% 10.6%
Growth vs. previous year +13.9% +8.5% +9.7%
Figures in euro million 42Business plan 2021 - 2023
Organic growth – Sales By division
HUGE NEW
PROJECTS PIPELINE
PROJECTS GAS HINGES ELECTRONICS TOTAL CAGR
€ 26.3 mn € 10.6 mn € 8.5 mn € 45.4 mn
ADDITIONAL NEW +7.6%
SALES IN 3 ORGANIC
No. 11 projects No. 5 projects No. 25 projects No. 41 projects
YEARS GROWTH
COMPARED TO
+35.5% on 2020
2020 EXISTING € 7.6 mn € 8.6 mn € 4.0 mn € 20.2 mn +3%
TOTAL € 33.9 mn € 19.2 mn € 12.5 mn € 65.6 mn +10.6%
STRONG
RELATIONSHIPS WITH
GLOBAL PLAYERS
43Business plan 2021 - 2023
Organic growth – Investments
(Amounts in mn Eur)
New Manisa
Production Capacity Increase Electronic Plant
India Plant 5.2 unvealed in May
Turkey Plant 6.0 2021
Mexico Plant 5.0
Tot New Plants 16.2
Total investments in organic growth
Maintenance 12.5
€ 58.8 mn in 3 years
New Projects
Electronics 5.3
Other Projects 6.0
Hinges 5.0
Gas 13.8
Tot new projects 30.1
44Business plan 2021 - 2023
Organic growth - New facilities
▪ Production: hinges and electronic components
▪ Investments: € 6 mn in 3 years
3 NEW ▪ Expected capacity: € 11 mn
TURKEY
PRODUCTION ▪ Start of production: May 2021 Electronics
FACILITIES Q1 2022 Hinges
▪ Production: valves and burners for local market and
potential export
INDIA ▪ Investments: € 5.2 mn in 3 years
Total capacity increase: ▪ Expected capacity: € 6 mn
€ 28 mn by 2023 ▪ Start of production: first half of 2022
Countries with strong ▪ Production: burners and hinges for North and Central
prospective growth America markets
MEXICO ▪ Investments: € 5 mn in 3 years
▪ Expected capacity: € 11 mn
▪ Start of production: Q4 2022
45Business plan 2021 - 2023 •
•
14 Companies
10 Production plants as of 2020
Organic growth - Industrial footprint • 13 Production plants by 2022
(5 in Italy and 8 abroad)
3 new production plants by 2022
(Turkey, Mexico and India)
SABAF TURKEY
HINGES
GAS
ELECTRONICS
46Business plan 2021 - 2023
Organic growth - Sustainability
“ Sabaf's strategy and governance model are aimed towards ensuring long-term sustainable growth.
For Sabaf, sustainability is primarily based on sharing values with its stakeholders; compliance with common
“
values increases mutual trust and encourages knowledge development.
BUSINESS PLAN KPI
Area KPI 2023
SABAF GROUP VISION
TARGETS
(VS.2020) SDGs
Development Hours of training
«We believe in a world in which all 1 of resources per capita +40%
people’s basic needs, such as home, and skills
food and reliable energy, are fulfilled in
an environmentally sustainable way. Accident
We promote a company that improves Health and frequency rate
2 safety -44%
the quality of the environment and the Accident severity
rate
communities where we live and work»
Eco-efficiency tCO2eq emissions
and Emissions on sales
3 into the -14%
atmosphere
47Business plan 2021 - 2023
Growth by acquisitions - M&A Strategy
M&A as a tool for achieving long- Preservation of the identity of acquired
term targets through: companies, which maintain their brand,
local supply chain and workforce
• the acquisition of know-how and
technologies INVESTMENT SECTORS
• the expansion of the product offer Retention of talents and soft skills
• the opening to new markets COMPONENTS FOR
• the risk diversification 1
Achievement of significant HOUSEHOLD APPLIANCES
• the ability to scale the business
commercial and industrial synergies
quickly
2 ELECTRONICS
From an entrepreneurial to an
Growth of the competitive industrial approach 3 HEATING
advantage by differentiating the
Sabaf value proposition from Joint effort for growth and
competitors positives influence on margins 4 PROFESSIONAL COOKING
Preferably seller is taken onboard
as a director and/or minority
shareholder
48Business plan 2021 - 2023
Growth by acquisitions - Target profile
TARGET PARAMETERS
TURNOVER € 5 - 70 mn sales
Steady positive results over past years
EBITDA No turnarounds
SHAREHOLDING Preference for entrepreneurial ownership
EBITDA MULTIPLES Non-dilutive
Dedicated to scouting and development of business contacts, creation of an internal
M&A TEAM Data Base, analysis and evaluation of opportunities, management of negotiations
49Business plan 2021 - 2023
Summary - Targets
Around € 300 mn sales
Total growth: 62% by 2023 vs. 2020 (Organic and by acquisitions growth) HIGH PROFITABILITY
(EBITDA AT LEAST 19%)
(CAGR 17.5%)
Total investments € 130 mn of which:
✓ € 58 mn organic growth
✓ € 72 mn growth by acquisitions ROI > 12.5%
COMPARED TO 11.5% IN 2020
✓ Dividends: € 20 mn
Investments and dividends, for a total amount of € 150 mn
financed with:
NET DEBT/EBITDA
✓ Operating cash flow: € 85 mn
✓ New financial debt: € 65 mn ~ 2.0
Sustainability targets:
✓ Hours of training per capita
✓ Accident frequency and severity rates
✓ CO2 emissions reduction
50DISCLAIMER Certain information included in this document is forward looking and is subject to important risks and uncertainties that could cause actual results to differ materially. The Company’s business is in the domestic appliance industry, with special reference to the gas cooking sector, and its outlook is predominantly based on its interpretation of what it considers to be the key economic factors affecting this business. Forward- looking statements with regard to the Group’s business involve a number of important factors that are subject to change, including: the many interrelated factors that affect consumer confidence and worldwide demand for durable goods; general economic conditions in the Group’s markets; actions of competitors; commodity prices; interest rates and currency exchange rates; political and civil unrest; and other risks and uncertainties. Pursuant to Article 154/2, paragraph 2 of the Italian Consolidated Finance Act (Testo Unico della Finanza), the company’s Financial Reporting Officer Gianluca Beschi declares that the financial disclosure contained in this financial presentation corresponds to the company's records, books and accounting entries. For further information, please contact Gianluca Beschi - +39.030.6843236 gianluca.beschi@sabaf.it
You can also read