Sales are up +26.0% month-over-month. The year- over-year comparison is down
←
→
Page content transcription
If your browser does not render page correctly, please read the page content below
Permission is granted only to ARMLS® Subscribers for reproduction with attribution on to “ARMLS® COPYRIGHT 2022. For questions regarding this publication contact Brand@ARMLS.com.

    DATA FOR            MARCH 2022                                         Published April 18, 2022

                                                                                                                                                         Sales are up
                                                                                                                                                         +26.0% month-over-
                                                                                                                                                         month. The year-
                                                                                                                                                         over-year
                                                                                                                                                         comparison is down
                                                                                                                                                         -2.8%.

Closed MLS sales with a close of escrow date from 3/1/22 to 3/31/22, 0 day DOM sales removed

1                                                                                                                                     ARMLS STAT                  MARCH 2022
New inventory
                                                                                                                      has a month-over-
                                                                                                                      month increase
                                                                                                                      of 22.1% while
                                                                                                                      the year-over-
                                                                                                                      year comparison
                                                                                                                      decreased by
                                                                                                                      -0.3%.

    New MLS listings that were active for at least one day from 3/1/22 to 3/31/22, 0 day DOM sales removed

                                                                                                                      Total inventory
                                                                                                                      has a month-over-
                                                                                                                      month decrease of
                                                                                                                      -1.2% while year-
                                                                                                                      over-year reflects a
                                                                                                                      decrease of -6.1%.

    Snapshot of statuses on 3/31/22

2                                                                                                            ARMLS STAT    MARCH 2022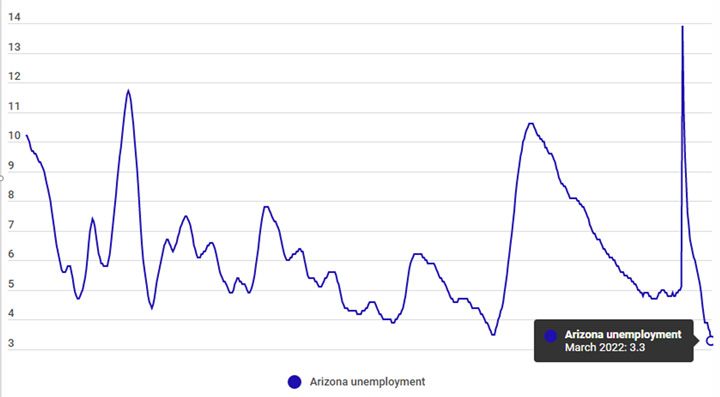
March UCB listings
                                                                                                                               percent of total
                                                                                                                               inventory was
                                                                                                                               40.6% with March
                                                                                                                               CCBS listings
                                                                                                                               at 3.6% of total
                                                                                                                               inventory.

    Snapshot of statuses on 3/31/22

                                                                                                                               Months supply
                                                                                                                               of inventory for
                                                                                                                               February was 1.14
                                                                                                                               with March at 0.89.

    Current inventory of Active/UCB/CCBS divided by the monthly sales volume of MARCH 2022, 0 day DOM sales removed

3                                                                                                                     ARMLS STAT    MARCH 2022
Average new
                                                                                                                                list prices are up
                                                                                                                                +21.2% year-over-
                                                                                                                                year. The year-
                                                                                                                                over-year median
                                                                                                                                is up +25.3%.

    List prices of new listings with list dates from 3/1/22 to 3/31/22, 0 day DOM sales removed

                                                                                                                                The average sales
                                                                                                                                price is up +21.2%
                                                                                                                                year-over-year
                                                                                                                                while the year-
                                                                                                                                over-year median
                                                                                                                                sales price is also
                                                                                                                                up +28.0%.

    MLS sales prices for closed listings with a close of escrow date from 3/1/22 to 3/31/22, 0 day DOM sales removed

4                                                                                                                      ARMLS STAT    MARCH 2022
An increase is
forecasted in April
for both average
sale prices and
median sale prices.
ARMLS proprietary predictive model forecast, 0 day DOM sales removed
Foreclosures
pending month-
over-month
showed an
increase of +20.6%
while the year-
over-year figure
was up +4.7%.
Snapshot of public records data on 3/31/22 active residential notices and residential REO properties.
5 ARMLS STAT MARCH 2022Distressed sales
accounted for
0.1% of total sales,
the same as the
previous month.
Short sales went
down -100.0%
year-over-year.
Lender-owned sales
dropped -59.3%
year- over-year.
New MLS listings that were active for at least one day from 3/1/22 to 3/31/22, 0 day DOM sales removed
Days on market
were down -5 days
year-over-year
while month-over-
month went down
-4 days.
MLS sales prices for closed listings with a close of escrow date from 3/1/22 to 3/31/22, 0 day DOM sales removed
6 ARMLS STAT MARCH 2022COMMENTARY
BY TOM RUFF
When presenting STAT each month, we make it a point not to make predictions. It may appear we’re
forecasting when we say the median sales price will hit $475,000 by mid-May and the reported median sales price
for homes closed in March was $460,000, but we’re not. We’re simply cumulating the newly reported pending
contract prices and their anticipated closing dates, and voila. We count, observe and report. We don’t predict until
now. It’s time to get out over my skis, swing for the fences and call my shot. By no later than June 19, I predict that
we will see an event that has never occurred but has been anticipated for over 50 years. My call, the Phoenix
Suns will win the NBA championship. It’s time to, Rally the Valley, and deliver the Larry O’Brien Championship
Trophy to Phoenix. Now, let’s put Nostradamus back in the bottle for a moment and report our current housing and
economic data.
In this month’s STAT, we’re going to present a series of bullet points, any one of which, standing on their
own merit, could make for an entire STAT report. Some of the metrics suggest tailwinds to the housing market,
others suggest headwinds, all together, they tell us it is windy, very windy. As you read each individual metric,
consider for yourself, what the aggregate effect will be both in the short term as well as the long-term on our
housing market. Let’s get started.
• US consumer prices in March rose 8.5% from the same month last year, marking a 40-year high—and up 1.2%
from February.
• S&P 500 stock index down 8.42% since January 1st.
7 ARMLS STAT MARCH 2022COMMENTARY
BY TOM RUFF
• Arizona’s unemployment rate fell to 3.3% in March, the lowest rate in almost a half-century, according to just
released numbers by the Bureau of Labor Statistics.
Arizona Unemployment via Bureau of Labor Statistics
The chart above shows data from January 1976 forward. For the interactive link click here.
8 ARMLS STAT MARCH 2022COMMENTARY
BY TOM RUFF
• Intel is building new chip factories in Chandler, with the new project costing $20 billion.
• Taiwan Semiconductor Manufacturing Company $12 billion 5-nanometer chip fabrication plant is being built in
northern Phoenix.
• There were 3,918 newly built homes sold in the first quarter compared to 4,444 in the same time frame last year.
Newly built home sales in Maricopa County are down 11.87% year over year.
• In the first quarter of this year, Institutional Buyers purchased 1,854 homes in Maricopa County compared to 833
for the same time in 2021, a 123% increase.
• According to the Equity Action Plan just released, HUD’s Strategic Plan for fiscal year 2022-2026 identifies
additional undertakings to promote equity, such as improving rental assistance to address the need for affordable
housing.
• The average priced home in March, as reported by ARMLS, was $569,752. The gross dollar sales volume in the
first quarter, as reported by ARMLS, was $13.3 billion, the highest first quarter total in ARMLS history.
• According to public records data for the first quarter of the year for the past 3 years, cash purchases by traditional
buyers (Single Male, Single Female, Husband/Wife) have remained flat, accounting for 18.5% of all purchases.
• According to public records data for the first quarter of the year for the past 3 years, cash purchases for all home
sold has risen from 25% in 2020 and 2021 to 30% in 2022.
9 ARMLS STAT MARCH 2022COMMENTARY
BY TOM RUFF
• In the first quarter of 2022 I-buyers purchased 1,160 homes and sold 2,549 in Maricopa County. Approximately
20% of the homes sold by I-buyers were transferred to institutional buyers.
• The median mortgage as reported in public records in Maricopa County for the first quarter of 2021 was
$310,266. The 30-year fixed rate mortgage during this period as reported by Freddie Mac centered around
3.04%. Interest payments for a median priced mortgage during this time was $786.01 per month.
• The median mortgage as reported in public records in Maricopa County for the first quarter of 2022 was
$388,266, the 30-year fixed rate mortgage during this time as reported by Freddie Mac centered around 3.50%.
Interest payments for a median priced mortgage during this time was $1,131.67 per month.
• The median mortgage as reported by public records in Maricopa County for the March of 2022 was $396,537, the
30-year fixed rate mortgage as reported by Freddie Mac today is 5.00%. The monthly interest cost for a $396,537
with a 5% mortgage rate would be $1,652.23, a 110% increase over the first quarter of 2021. This would apply for
owners locking in rates today.
“This week, mortgage rates averaged five percent for the first time in over a decade,” said Sam Khater,
Freddie Mac’s Chief Economist. “As American contend with the historically high inflation, the combination of rising
mortgage rates, elevated home prices and tight inventory are making the pursuit of homeownership the most
expensive in a generation.”
10 ARMLS STAT MARCH 2022COMMENTARY
BY TOM RUFF
Primary Mortgage Market Summary
11 ARMLS STAT MARCH 2022COMMENTARY
BY TOM RUFF
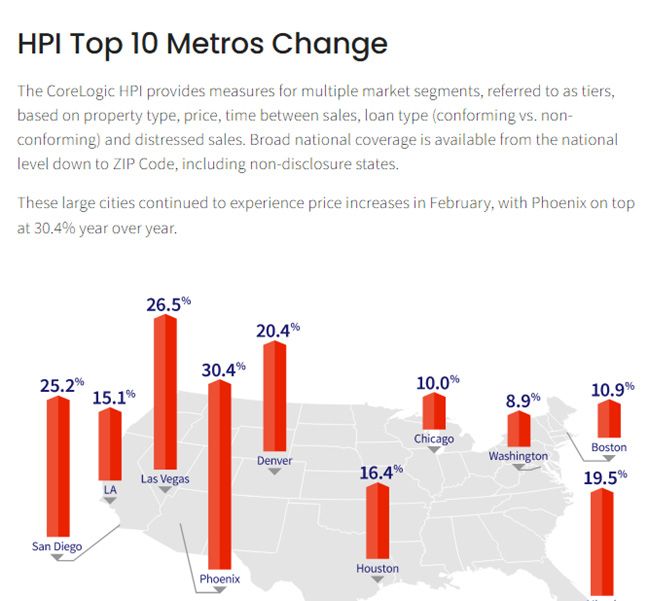
HPI Top 10 Metros Change
12 ARMLS STAT MARCH 2022COMMENTARY
BY TOM RUFF
In STAT over the last year, we’ve discussed institutional buyers and how they’ve impacted affordability as they
compete with the traditional buyers. Rising mortgage rates will most likely lead to a pullback in demand by traditional
buyers. The question then becomes, if traditional buyers do pull back, will this open a running lane for institutional
buyers to increase their footprint? In September, it was reported Pretium, one of the larger players in our market, the
owner of about 70,000 single-family rental homes nationwide had just launched a joint venture to invest $1 billion
in the construction of new homes to rent nationwide, and every time a new project is launched, Phoenix has been
one of the main markets mentioned. Just last week this headline appeared in the WSJ, “Home Builders Bypassing
Individual Home Buyers for Deep-Pocketed Investors.” A story again which prominently focused on Phoenix. I
wanted to share with you Pretium’s strategy, this comes from data garnered from their website. In their own words,
“As a leading alternative investment manager, Pretium looks for disruptions in markets, demographics, technology,
or public policy that create real estate and credit market opportunities with long-term tailwinds. Then develop
adjacent businesses to capitalize.”
In a white paper Pretium published last September they stated their strategy on single-family rentals and
build-to-rent, ”As the shortage of single-family homes and rising home prices both help to put ownership further out
of reach, suburban demand will increasingly shift to single-family rentals. However, this demand has fewer places to
go. Construction activity, too, has been running below trend for single-family homes whereas multi-family starts have
been running near multi-decade highs. The robust demand for homeownership has been taking such rentals off the
market, decreasing the single-family rental stock by nearly 700,000 units in the years leading up to the pandemic.
Affordable housing is in particularly short supply. Cumulative underinvestment in US housing has created the most
acute supply-demand imbalance in affordable housing. Prior to the pandemic, nearly one-third of US households
were financially burdened by housing costs and this proportion has likely risen because of the pandemic. As a result
of supply constraints, new housing construction no longer serves affordable housing needs – therefore, the burden
of meeting affordable housing needs largely falls on existing housing stock.”
13 ARMLS STAT MARCH 2022COMMENTARY
BY TOM RUFF
In February Pretium announced the appointment of Jocelyn Moore as a Senior Managing Director to lead
corporate affairs. Her initial public statement gives further insights as to how the institutional buyers think and how
they might well market themselves, “Access to quality, affordable housing is a key pillar of economic opportunity
and income equality, I am excited to join Pretium during this incredibly dynamic time as we lead the effort to deploy
private capital for public good. Together, we will work to help solve one of society’s greatest challenges and drive
positive community impact for individuals and families.”
In Conclusion
As always, we have more questions than answers, what we do know, prices will continue to rise, at least
through June, as supply remains scarce. Over the next few months, we’ll be closely monitoring demand, both its
strength and makeup, as well as the impact of the recent rise in mortgage rates if any. As Nostradamus once said,
“Nothing in the world can one imagine beforehand, not the least thing, everything is made up of so many unique
particulars that cannot be foreseen.” While Nostradamus’s words might apply well to our housing market, I can
without equivocation tell you, he never ever saw this Sun’s team play.
14 ARMLS STAT MARCH 2022COMMENTARY
BY TOM RUFF
The ARMLS Pending Price Index (PPI)
Last month STAT’s mathematical model projected the median sales price for March at $455,000, the actual
number was $460,000. Looking ahead to April, the ARMLS Pending Price Index is projecting median sales price of
$469,500. If April’s median sales price projection is correct, we will see a year over year gain of 25.2%. The last few
months our estimates have been slightly lower than the actual median. I suspect this might very well be the case
again when April’s data is reported.
We began April with 7,419 pending contracts, 3,447 UCB listings and 303 CCBS giving us a total of 11,169
residential listings practically under contract. This compares to 11,839 of the same type of listings one year ago.
At the beginning of April, the “pending” contracts are 5.66% lower than last year. There were 22 business days in
April 2021 and 21 this year. ARMLS reported 9,476 sales in April 2021. The highest sales volume ever in April
occurred in 2005 with 9,600. STAT is projecting similar sales volume this April in comparison to last April.
15 ARMLS STAT MARCH 2022You can also read