Salience in a social landscape: electrophysiological effects of task-irrelevant and infrequent vocal change
←
→
Page content transcription
If your browser does not render page correctly, please read the page content below

Social Cognitive and Affective Neuroscience, 2016, 127–139

                                                                              doi: 10.1093/scan/nsv103
                                                                              Advance Access Publication Date: 13 October 2015
                                                                              Original Article

Salience in a social landscape: electrophysiological
effects of task-irrelevant and infrequent vocal change

                                                                                                                                                       Downloaded from https://academic.oup.com/scan/article/11/1/127/2375193 by guest on 04 December 2020
Ana P. Pinheiro, Carla Barros, and João Pedrosa
Neuropsychophysiology Laboratory, School of Psychology, University of Minho, Braga, Portugal
Correspondence should be addressed to Ana P. Pinheiro, Neuropsychophysiology Laboratory, CIPsi, School of Psychology, University of Minho, Campus de
Gualtar, 4710-957 Braga, Portugal. E-mail: ana.pinheiro@psi.uminho.pt.

Abstract
In a dynamically changing social environment, humans have to face the challenge of prioritizing stimuli that compete for at-
tention. In the context of social communication, the voice is the most important sound category. However, the existing studies
do not directly address whether and how the salience of an unexpected vocal change in an auditory sequence influences the
orientation of attention. In this study, frequent tones were interspersed with task-relevant infrequent tones and task-
irrelevant infrequent vocal sounds (neutral, happy and angry vocalizations). Eighteen healthy college students were asked to
count infrequent tones. A combined event-related potential (ERP) and EEG time–frequency approach was used, with the focus
on the P3 component and on the early auditory evoked gamma band response, respectively. A spatial-temporal principal com-
ponent analysis was used to disentangle potentially overlapping ERP components. Although no condition differences were
observed in the 210–310 ms window, larger positive responses were observed for emotional than neutral vocalizations in the
310–410 ms window. Furthermore, the phase synchronization of the early auditory evoked gamma oscillation was enhanced
for happy vocalizations. These findings support the idea that the brain prioritizes the processing of emotional stimuli, by
devoting more attentional resources to salient social signals even when they are not task-relevant.

Key words: salience; attention; voice; event-related potentials; neural oscillations

Introduction
                                                                              reason, it is not surprising that human beings are tuned to
The ability to extract regularities and to rapidly detect change in           quickly discriminate between emotionally salient and neutral
a dynamically changing environment is critical for survival.                  stimuli. Picture a speaker who is describing a life event and sud-
Surprise and uncertainty represent a cost in terms of energy                  denly starts shouting out loud angrily. The listener needs to
and processing resources (Kveraga et al., 2007). In the context of            quickly detect the change in voice intonation and to accurately
social communication, this capacity involves predicting what is               identify if that same change signals any sort of danger in the
going to happen next in the social scene based on memory-                     environment. Alternatively, if the speaker starts jumping and
driven regularity representations, detecting frequently unex-                 using a vibrant and enthusiastic tone of voice, this change may
pected changes that might signal an alteration in the emotional               represent a positive event and it is well known that positive so-
state of the speaker, as well as quickly reacting to those unex-              cial events play a critical role in promoting social bonding (e.g.
pected events (e.g. Jessen and Kotz, 2013).                                   Johnstone et al., 2006). These examples demonstrate that
    The voice is plausibly the most important sound category in               attending to changes in the acoustic environment is necessary
a social environment (e.g. Belin et al., 2004). By representing a             to evaluate and modify behavior based on perceived threats or
dynamically changing auditory stimulus, the listener needs to                 opportunities.
rapidly integrate multiple cues, such as pitch, intensity and dur-                Event-related potential (ERP) studies suggest that the differ-
ation (e.g. Schirmer and Kotz, 2006). Vocal emotional cues repre-             entiation between neutral and emotional vocal cues occurs
sent biologically relevant signals that require rapid detection,              already at early processing stages (e.g. Paulmann and Kotz,
evaluation and response (e.g. Schirmer and Kotz, 2006). For that              2008; Pinheiro et al., 2013, 2014). Furthermore, there is a

Received: 25 March 2015; Revised: 9 July 2015; Accepted: 30 July 2015
C The Author (2015). Published by Oxford University Press. For Permissions, please email: journals.permissions@oup.com
V

                                                                                                                                            127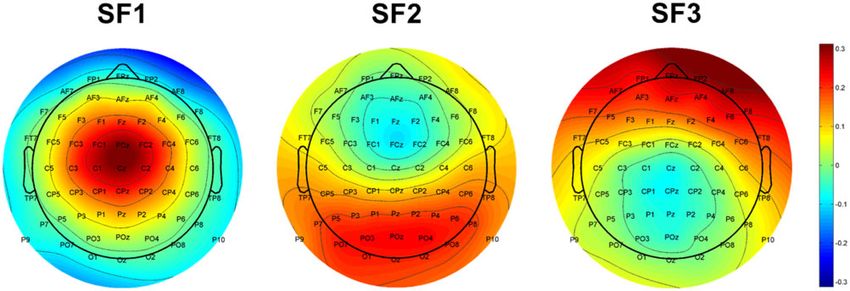
128    |   Social Cognitive and Affective Neuroscience, 2016, Vol. 11, No. 1

substantial body of knowledge indicating that the recognition of           studies keep with the notion that attention is oriented faster to
emotion in voices is intricately associated with attentional (e.g.         an emotional stimulus, and additionally suggest that the pleas-
Sander et al., 2005) and prediction mechanisms (e.g. Jessen and            antness or unpleasantness of a stimulus (i.e. its valence) may dif-
Kotz, 2013). Although attention may lead to increased precision            ferently engage attentional resources.
in information processing, prediction biases attention in favor                In an attempt to probe the brain underpinnings of vocal
of anticipated stimuli (e.g. Chennu et al., 2013). Within a limited        emotional processing, the information provided by ERP compo-
capacity system, emotionally salient information conveyed                  nents such as the P300 and the P3a may be complemented with
through the voice modulates the allocation of attentional re-              the analysis of neural oscillations in the time–frequency do-
sources, receiving preferential and prioritized processing in the          main. The importance of this type of analysis has come into
competition for access to selective attention (e.g. Fenske and             focus in recent years (e.g. Roach and Mathalon, 2008). In particu-
Raymond, 2006). Furthermore, emotion may lead to stronger                  lar, probing the phase of high-frequency oscillatory activity may
predictive signals than neutral stimuli (e.g. Jessen and Kotz,             provide critical insights into the brain mechanisms underlying
2013).                                                                     emotionally salient vocal change detection. Many recent studies
    An experimentally controlled way to probe the brain mechan-            suggest that phase synchronization of neural activity plays a

                                                                                                                                                    Downloaded from https://academic.oup.com/scan/article/11/1/127/2375193 by guest on 04 December 2020
isms associated with vocal change detection is to use an oddball           critical role in sensory prediction and change detection (e.g. Fell
paradigm. Typically, in the ‘active’ oddball task, participants are        et al., 2003; Kveraga et al., 2007). These studies have highlighted
instructed to pay attention to a stream of stimuli and to detect           the special role played by gamma-band oscillations in these
rare target (deviant) events in a series of frequent (standard) stim-      processes. Gamma phase synchronization was found to be
uli. In ERP studies, the P300 component is elicited by deviant             increased for novel relative to standard sounds (Garcia-Garcia
stimuli and can be considered an index of the allocation of pro-           et al., 2010) and to play a critical role in selective attention (Fell
cessing resources (e.g. Wickens et al., 1983), particularly attention      et al., 2003). Specific prediction and attention effects have been
(e.g. Polich, 1989), or a manifestation of a mechanism that up-            observed in the early auditory evoked gamma-band response
dates a model of the environment or context in working memory              that occurs at 30–60 Hz, within 150 ms after stimulus onset (e.g.
(e.g. Donchin, 1981; Donchin and Coles, 1988).                             Pantev et al., 1991, 1995). This response is characterized by pre-
    Rather than representing a unitary phenomenon, the P300 is             cise phase-locking to stimulus onset and is detected by averag-
composed of dissociable and independent components that re-                ing EEG single trials (e.g. Pantev, 1995; Schadow et al., 2007). An
flect the involvement of attentional and memory mechanisms                 increase in the phase synchronization of the early gamma-band
(e.g. Goldstein et al., 2002). This observation highlights the im-         response has been associated with increased attention (Fries
portance of using spatiotemporal decomposition methods to                  et al., 2001), re-allocation of attentional resources (Garcia-Garcia
disentangle potentially overlapping ERP components (e.g.                   et al., 2010), enhanced sensory information processing (e.g.
Spencer et al., 1999, 2001). The classical P300 (or P3b) has a par-        Herrmann et al., 2004), and the match between bottom-up sig-
ietal topography and is elicited by rare task-relevant stimuli             nals and top-down expectations (e.g. Debener et al., 2003; Roye
(e.g. Sutton et al., 1965). The P3a (or Novelty P3) is a positive com-     et al., 2010). Nonetheless, few studies to date have examined the
ponent with a frontocentral distribution occurring in the same             effects of salience on the synchronization of gamma oscillations
latency range as the P300, and it is elicited by task-irrelevant           and those that have present a mixed picture. For example,
rare or novel stimuli inserted randomly in a sequence of repeti-           Garcia-Garcia et al. (2010) reported increased gamma phase syn-
tive (standard) and target (deviant) events (e.g. Courchesne               chronization for novel sounds occurring in a negative visual
et al., 1975; Squires et al., 1975). This component is a neuro-            context relative to a neutral one, and Domı́nguez-Borràs et al.
physiological index of attentional orienting towards a stimulus,           (2012) found increased gamma phase synchronization for novel
with its amplitude increasing as a function of stimulus salience           sounds presented in a positive visual context relative to a neu-
(e.g. Nittono, 2006). The elicitation of a P3a component tells us          tral one. These findings suggest that gamma oscillations may
that an unexpected change in the sensory environment engages               additionally play a role in the association of the perceptual
attention involuntarily and is sufficiently salient to enter into          properties of stimuli with their emotional significance (Oya
awareness. Therefore, this component is especially relevant for            et al., 2002).
the understanding of how the salience of a change in vocal in-
tonation may differently influence attention mechanisms.
Because the P3a is elicited by a task-irrelevant and unexpected            The current study and hypotheses
change in a sound sequence, it more closely resembles a real-              Although the studies reviewed before support the strong modu-
world social communication context.                                        latory role of stimulus salience on attention, these studies do
    Very few studies have investigated how the salience of vocal           not directly address whether and how the salience of an unex-
sounds modulates the allocation of attentional resources, using            pected change in an auditory sequence has an impact upon in-
an oddball task (Thierry and Roberts, 2007; Campanella et al.,             voluntary orienting of attention indexed by the P3a and on the
2010). Two major observations have arisen from emotional stud-             synchronization of early evoked gamma oscillations. The tem-
ies in the visual modality: first, emotionally salient stimuli en-         poral resolution of the EEG methodology is especially suitable to
gage more attentional resources (e.g. Schupp et al., 2003; Olofsson        tackle these questions as it may provide critical hints about the
et al., 2008; Kissler et al., 2009); second, aversive stimuli seem to      speed at which vocal emotional information is decoded and at
engage more attention than positive stimuli (negativity bias),             the processing stages involved (e.g. Paulmann and Kotz, 2008).
even though this is not a consistent finding (e.g. Ito et al., 1998;           In this study, we presented frequent tones (standard) inter-
Carretié et al., 2001). However, fewer studies probed these effects       spersed with task-relevant infrequent tones (target) and task-
in the auditory modality. Thierry and Roberts (2007) found that            irrelevant infrequent vocal sounds. Vocal sounds were short
the P3a amplitude was significantly more positive for unpleasant           neutral, happy and angry non-verbal vocalizations. Emotional
relative to neutral sounds. Campanella et al. (2010) reported ear-         vocalizations were matched in perceived arousal. We selected
lier P300 latencies for happy than for sad prosodic speech devi-           an exemplar of negative (angry) and positive (happy) social sig-
ants (word ‘paper’ spoken with happy or sad prosody). These                nals. Both happy and angry vocal stimuli have similar acoustic
A. P Pinheiro et al.    |   129

profiles (e.g. high intensity and variable F0) and are recognized              Table 1. Affective normative ratings of the experimental stimuli
above chance (Schröder, 2003; Hawk et al., 2009; Laukka et al.,
                                                                               Type of vocalization          Affective dimension
2013). Although angry vocalizations represent a negative social
signal that may convey aversive meaning and have survival                                                    Valence            Arousal           Dominance
value (avoiding danger), happy vocalizations represent a posi-
tive social signal with social bonding value (e.g. Compton, 2003).                                           Mean (SD)          Mean (SD)         Mean (SD)
Emotional non-verbal vocalizations represent a more primitive
                                                                               Neutral                       4.83 (0.73)        3.21 (2.00)       5.09 (2.56)
expression of emotion (e.g. Scherer, 1995; Scherer et al., 2001;
                                                                               Happy                         7.54 (1.14)        5.09 (2.19)       6.28 (2.08)
Belin et al., 2004) and can be viewed as the auditory equivalent
                                                                               Angry                         3.22 (1.54)        5.63 (2.10)       4.67 (2.28)
of facial emotional expressions (e.g. Belin et al., 2004). Of note,
studies probing accuracy differences in the recognition of emo-                Note: Mean 6 SD are given for each variable.
tion expressed through different types of auditory stimuli (e.g.
prosodic speech, pseudospeech, non-verbal vocalizations) dem-
                                                                               (Oldfield, 1971); no history of neurological illness; no history or
onstrated that emotions are decoded more accurately through

                                                                                                                                                                Downloaded from https://academic.oup.com/scan/article/11/1/127/2375193 by guest on 04 December 2020
                                                                               current psychiatric disorder, as assessed by the Brief Symptom
non-verbal vocalizations than through speech-embedded pros-
                                                                               Inventory     (BSI—Derogatis,     1993;    Portuguese    version—
ody (e.g. Hawk et al., 2009). Therefore, the use of nonverbal emo-
                                                                               Canavarro, 2007); no present medication for medical disorders
tional vocalizations vs speech prosody in experimental research
                                                                               that could have deleterious effects on EEG morphology, as well
may optimize the recognition of emotional content and avoid
                                                                               as neurological, and/or cognitive functioning consequences; no
confounds associated with concurrent phonological and lexical-
                                                                               hearing, vision or upper body impairment—relevant for neuro-
semantic information (e.g. Warren et al., 2006; Belin et al., 2011).
                                                                               psychological function.
    We used a modified version of the novelty oddball paradigm.
                                                                                  Before the EEG experiment, a brief neurocognitive assessment
Instead of unique vocal stimuli, low probability vocalizations
                                                                               aimed to assess verbal intelligence quotient (Wechsler, 2008;
differing in valence were presented in different experimental
                                                                               M ¼ 119.4, SD ¼ 12.21), and a brief clinical assessment ruled out
blocks to ensure a sufficient number of EEG segments
                                                                               the presence of psychopathological symptoms (BSI—Canavarro,
that would allow the comparison of different valence types to
                                                                               1999; M ¼ 1.26, SD ¼ 0.26). None of the participants had total
probe the role of stimulus salience on attentional orienting.
                                                                               scores that indicated the presence of clinical symptoms.
In that sense, vocalizations were familiar (each was presented
                                                                                  Participants were given course credit for their participation in
more than once) but unexpected task-irrelevant stimuli
                                                                               the study. All participants provided written informed consent for
given the context in which they occurred. Because previous
                                                                               the experimental protocol approved by a local Ethical Committee.
studies suggest that after a pre-attentive evaluation of the emo-
tional significance of sounds, those that are evaluated as emo-
tionally significant receive prioritized processing and access to
selective attention (e.g. Robinson, 1998; Compton, 2003;                       Stimuli
Vuilleumier, 2005), we hypothesized that emotional vocaliza-
                                                                               Stimuli were two sinusoidal tones of different frequencies (tone
tions would lead to a greater engagement of involuntary atten-
                                                                               1–350 Hz, 10 ms rise and fall times; tone 2–500 Hz, 10 ms rise and
tion than neutral vocalizations, reflected in increased P3a
                                                                               fall times) but same duration (336 ms), and three exemplars of a
amplitude.1
                                                                               female vocalization (neutral, happy and angry) selected from
    Furthermore, we explored whether emotional vocalizations
                                                                               the ‘Montréal Affective Voices’ battery (Belin et al., 2008). The
elicit greater synchrony of neural activity across trials.
                                                                               duration of the vocalizations was shortened so that they lasted
We focused our analysis on phase-locking factor (PLF) values of
                                                                               only 500 ms, but their emotional content was preserved.2
the early auditory evoked gamma-band response. PLF measures
                                                                               Vocalizations were normalized in mean intensity (70 dB) using a
the variance of the EEG phase across single trials and, as
                                                                               Praat script (Boersma & Weenink, 2013). The mean fundamental
such, is a measure of temporal stability of a specific evoked re-
                                                                               frequency (F0) was 212.58 Hz for the neutral vocalization,
sponse (e.g. Roach and Mathalon, 2008). Considering the sur-
                                                                               350.61 Hz for the happy vocalization, and 414.36 Hz for the angry
vival value of angry vocalizations and the affiliative value of
                                                                               vocalization.
happy vocalizations, we hypothesized that emotional vocaliza-
                                                                                   In order to rule out any language or culture-specific factors
tions would be associated with enhanced phase synchroniza-
                                                                               (Scherer et al., 2001), the sounds were first validated with a sam-
tion of the early auditory-evoked gamma oscillation, reflecting
                                                                               ple of European Portuguese participants (n ¼ 155; 90 females;
increased attention towards unexpected salient stimuli relative
                                                                               mean age ¼ 21.00, SD ¼ 3.62 years) who did not participate in the
to unexpected neutral stimuli (e.g. Fries et al., 2001; Garcia-
                                                                               ERP study. They rated the sounds in the affective dimensions of
Garcia et al., 2010).
                                                                               valence (indexing the unpleasantness or pleasantness of a
                                                                               stimulus, ranging from unpleasant to pleasant), arousal (reflect-
                                                                               ing the degree of activation elicited by the stimulus, and ranging
Method                                                                         from calm to arousing), and dominance (indexing the degree of
                                                                               perceived control that a stimulus evokes, ranging from out
Participants
                                                                               of control to in control), using the Self-Assessment Manikin
Participants were 18 healthy college students (9 females; mean                 9-point scale (SAM, Bradley and Lang, 1994). Three vocalizations
age ¼ 23.67, SD ¼ 3.53 years). The inclusion criteria were:                    were selected based on the normative ratings. The affective
European Portuguese as first language; right handedness                        properties of the three vocalizations are presented in Table 1.

1   Throughout the text, we will use the term P3a instead of Novelty P3        2   In order to reduce stimulus duration, the most steady-state portion of
    since the low-probability vocalizations used in our study did not repre-       the vocal sounds was selected and individual waves were manually
    sent truly novel or unique stimuli, as they were repeated in the               cut at zero crossings (where the wave crosses zero amplitude) to avoid
    experiment.                                                                    clicks. Additionally, pauses were reduced.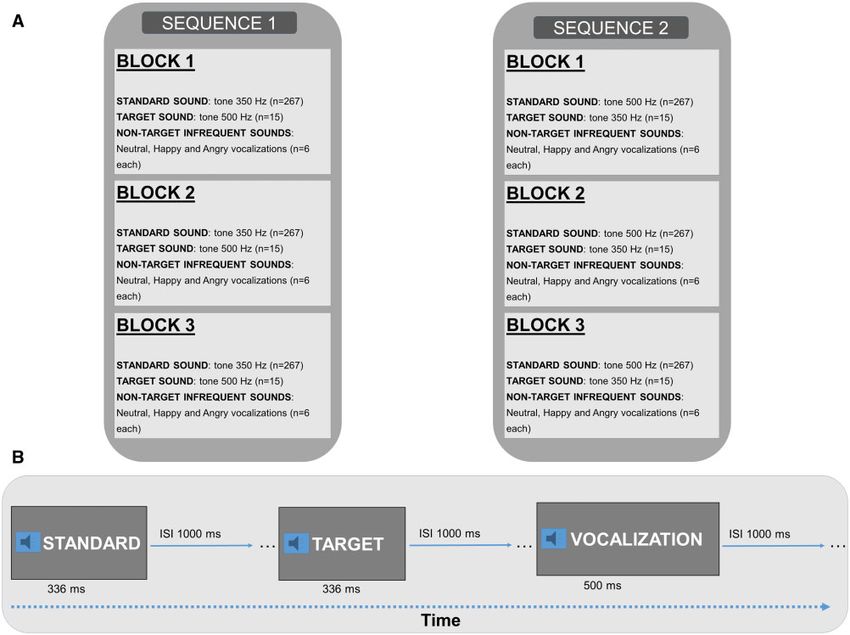
130    |   Social Cognitive and Affective Neuroscience, 2016, Vol. 11, No. 1

Procedure                                                                             pseudorandomized order, with the rule that each target was fol-
                                                                                      lowed by at least two standards and each vocalization was fol-
The experiment took place in a sound-attenuated and electric-
                                                                                      lowed by at least 10 non-vocal sounds, with no vocal stimuli
ally shielded room. Participants performed an oddball task in
                                                                                      appearing in the first 15 sounds. Auditory stimuli were sepa-
which they counted infrequent target sinusoidal tones. The ex-
                                                                                      rated by an inter-stimulus interval (ISI) of 1000 ms (see Figure 1),
periment included two oddball sequences: in sequence 1, 800 ex-
                                                                                      and presented via Sennheiser CX 300-II headphones at 70 dB
emplars of tone 1 (350 Hz; standard—P ¼ 0.089), 45 exemplars of
                                                                                      sound pressure level. The presentation and timing of the stim-
tone 2 (500 Hz; target—P ¼ 0.005), and 18 exemplars of each vocal-
                                                                                      uli were controlled through Presentation software (version 16.3;
ization (neutral, happy and angry—P ¼ 0.002 each) were pseudor-
                                                                                      Neurobehavioral Systems, Inc., Albany, NY). Participants were
andomized. In sequence 2, 800 exemplars of tone 2 (500 Hz), 45
                                                                                      instructed to silently count the number of infrequent (target)
exemplars of tone 1 (350 Hz) and 18 exemplars of each vocaliza-
                                                                                      tones.
tion (neutral, happy and angry) were presented. The experiment
                                                                                          At the end of the EEG session, participants were instructed
was divided into eight blocks, i.e. two training blocks and six ex-
                                                                                      to rate the valence, arousal and dominance of the three vocal-
perimental blocks (see Figure 1). The order of these blocks was
                                                                                      izations using the SAM (Bradley and Lang, 1994).

                                                                                                                                                                         Downloaded from https://academic.oup.com/scan/article/11/1/127/2375193 by guest on 04 December 2020
counterbalanced across participants. No vocalizations were pre-
sented during the training blocks. The presentation of sounds in
six experimental blocks accomplished three main goals: (i) to
minimize working memory demands associated with the task of
                                                                                      EEG data acquisition and analysis
counting the target sounds (participants were asked to report
the number of targets counted at the end of each block); (ii) to                      EEG data acquisition. EEG data were recorded using a 64-channel
avoid an excessive number of vocalizations presented in a single                      Active Two Biosemi system (Biosemi, Amsterdam, The
block; (iii) to minimize participants’ fatigue and distraction.                       Netherlands), in a continuous mode at a digitization rate of
    Simultaneous to auditory stimuli presentation, an unblink-                        512 Hz, with a bandpass of 0.01–100 Hz, and stored on disk for
ing fixation cross was presented on a monitor 100 cm from                             later analysis. Eye blinks and movements were monitored
the participant. All auditory stimuli were presented in a                             through electrodes placed on both temples (horizontal

Fig. 1. Schematic illustration of the experimental procedure. (A) The experiment included two oddball sound sequences. The order of these blocks was counterbalanced
across participants. Before each sequence, a training block took place. This allowed participants to identify which sound would be the standard and which sound
would be the target and to which attention should be paid for the following three blocks. No vocalizations were presented during the training blocks. (B) Standard and
target sounds had the same duration. Non-target infrequent vocalizations had 500 ms duration. The auditory stimuli were separated by a 1000 ms ISI (1000 ms).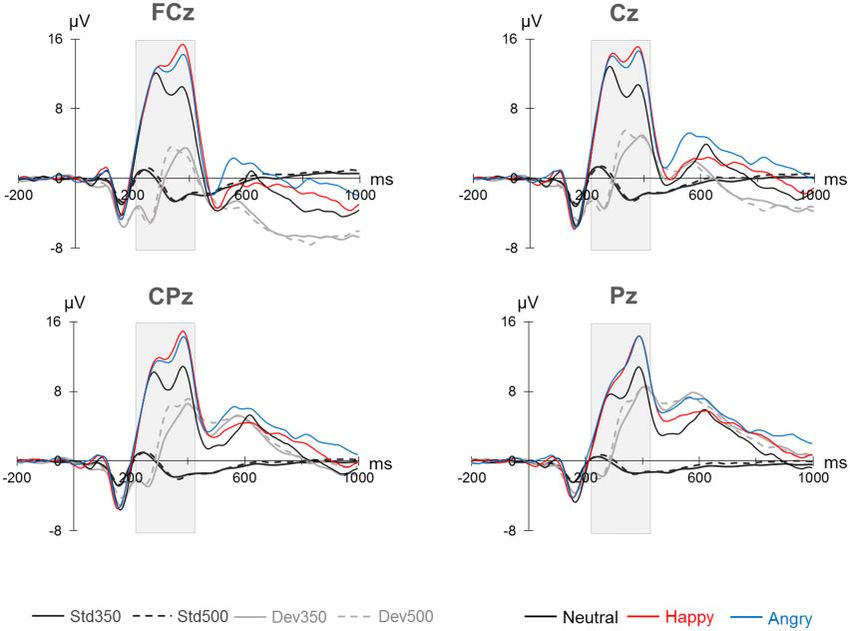
A. P Pinheiro et al.   |   131

electrooculagram) and another one below the left eye (vertical              conditions and participants). In this second step, the covariance
electrooculogram [EOG]).                                                    between time-points for all the virtual electrodes, participants
    The EEGLAB 13.1.1b software (Delorme and Makeig, 2004)                  and experimental conditions was analyzed (see Spencer et al.,
was used for data analysis. Data were referenced offline to the             1999, 2001). Following Spencer et al. (1999, 2001), the resulting
average of the left and right mastoids and high-pass filtered               temporal factor (TF) scores for each SF were used to measure
with a 0.1 Hz filter. Individual ERP epochs were created for each           the activity in the ERP component with the temporal morph-
stimulus type, with 200 ms pre-stimulus baseline and 1000 ms               ology and scalp distribution of interest. Factor scores represent
post-stimulus epoch. The EEG was baseline corrected using the               a unitless dimension (see Spencer et al., 1999, 2001 for further
200 to 0 ms pre-stimulus interval. The vertical EOG was                    details).
derived by subtracting the activity measured at an electrode
positioned below the left eye from an electrode positioned                  Habituation effects of non-target vocalizations. We explored
above it. The horizontal EOG was derived by subtracting the ac-             whether adaptation (measured as ERP amplitude attenuation)
tivity measured between electrodes placed at the outer canthi               differed as a function of stimulus valence. For that purpose,
of the eyes. The EEG channels were then corrected for vertical              mean amplitude at the electrode Cz was exported in the 210–

                                                                                                                                                   Downloaded from https://academic.oup.com/scan/article/11/1/127/2375193 by guest on 04 December 2020
and horizontal eye movements using the method of Gratton                    310 ms and 310–410 ms latency windows for each trial in the
et al. (1983). Segments were also semiautomatically screened for            neutral, happy and angry conditions.
eye movements, muscle artifacts, electrode drifting and ampli-
fier blocking. EEG epochs exceeding 6100 mv were not included               Time–frequency EEG data. PLF. PLF values were extracted by
in individual ERP averages. After artifact rejection, at least 85%          wavelet-based spectral decomposition of single-trial EEG
of the segments per condition per subject entered the analyses.             epochs time-locked to non-target vocalizations. It was calcu-
The number of trials in each vocal condition did not differ                 lated as 1 minus the phase variance, for the frequencies be-
(P > 0.50). Individual ERP averages were derived for each stimu-            tween 3 and 60 Hz. Time–frequency decomposition was
lus condition for all the participants.                                     performed using the Morlet wavelet transform in EEGLAB soft-
                                                                            ware, which was applied in 0.25 Hz steps from 4 to 60 Hz at each
                                                                            time-point to yield time–frequency maps. Before that, the re-
EEG data analysis
                                                                            tained artifact-free epochs were re-referenced to the average
ERP data. Spatiotemporal analyses. In order to most accurately              reference (Dien, 1998). The wavelet frequency/duration ratio f0/
capture the spatial topography of evoked responses over time                rf was 12 ppffiffi ffi 5:33 and its multiplication factor was 15
                                                                                     5 2
                                                                                                                                     pffiffi ffi 5:30.
                                                                                                                                    2 2
and to functionally separate distinct events that occur simul-              Baseline activity was subtracted from each PLF map. Baseline
taneously in time, a spatio-temporal Principal Component                    periods were calculated from 200 to 0 ms relative to stimulus
Analysis (PCA) method was used. The procedures used here are                onset. The analysis of the TF maps revealed effects in the
described in detail in Spencer et al. (1999, 2001). The data set            gamma-band range in an early latency window that corres-
used in the PCA consisted of the ERP averages at each electrode             ponds to the early auditory-evoked gamma-band response. PLF
site in all stimulus conditions for each participant, using the             values for task-irrelevant infrequent vocalizations were ex-
0–700 ms portion of the epoch (359 time-points). The data ma-               tracted in the 30–50 Hz frequency range in the 75–120 ms latency
trix input to the spatial PCA consisted of 61 (oculars excluded)            window, and measured at frontocentral electrode sites (FCz/1/2,
electrode sites  45234 observations (359 time-points  7 stimu-            and Cz/1/2).
lus conditions3  18 participants). Based on the scree test                     The SPSS 22.00 (SPSS, Corp., USA) software package was
(Cattell, 1966), 3 spatial factors (SFs) explained most of the vari-        used for statistical analyses. Analyses were corrected for non-
ance in the data set and were extracted for rotation with the               sphericity using the Greenhouse–Geisser method (the original
Varimax procedure (see Figure 3). In this first step, as described          df is reported). All significance levels are two-tailed with the
by Spencer et al. (1999, 2001), SF loadings are computed (vari-             preset significance alpha level of P < 0.05. Main effects were
ables ¼ electrode sites; observations ¼ time-points, experimen-             followed up with pairwise comparisons between conditions
tal conditions and participants). The covariance between                    using the Bonferroni adjustment for multiple comparisons.
electrode sites is analyzed across the time-points of the aver-             Only significant results are presented in the following section
ages for each stimulus condition and participant. As a result,              (P < 0.05).
each SF provides information about the correlations between
the EEG data recorded at each electrode site (original variable)
and the factor in the new data space (SFs) with reduced dimen-
                                                                            Results
sionality. ‘Virtual electrodes’ represent the SFs that inform               ERP data
about the spatial variance in the data, representing scalp distri-
                                                                            Grand average waveforms for the three types of vocalizations
butions and not typical ERP components. As such, they are not
                                                                            (see Figure 2) revealed two major effects in the P300 latency
comparable to voltage maps. SF scores can be plotted as time
                                                                            window (210–410 ms). The spatiotemporal PCA provided sup-
series for each condition and participant and, therefore, con-
                                                                            port for the independency of these effects and revealed their
sidered ‘virtual ERPs’ (see Spencer et al., 1999, 2001).
                                                                            spatial distribution.
Topographical maps of the voltage data and SF loadings were
plotted using spherical line interpolation.
    A temporal PCA was then run on the SF scores, using                     Spatial-temporal analysis. The spatial PCA revealed three SFs
Varimax rotation (variables ¼ SF scores or ‘virtual ERPs’ associ-           (see Figure 3): SF1 has a frontocentral distribution and ac-
ated with the time-points; observations ¼ ‘virtual electrodes’,             counted for 41.7% of variance; SF2 has a parietal/occipital distri-
                                                                            bution and accounted for 27.88% of variance; SF3 has a frontal
3   The conditions were: Standard 350 Hz, Target 500 Hz, Standard 500 Hz,   distribution and accounted for 21.93% of variance.
    Target 350 Hz, Neutral Vocalization, Happy Vocalization and Angry          The temporal PCA identified 8 TFs (see Figure 4). We focused
    Vocalization.                                                           our analysis on the TFs that were observed in the latency
132    |   Social Cognitive and Affective Neuroscience, 2016, Vol. 11, No. 1

                                                                                                                                                                        Downloaded from https://academic.oup.com/scan/article/11/1/127/2375193 by guest on 04 December 2020
Fig. 2. Grand average ERP waveforms for neutral, happy and angry vocalizations, at midline electrodes (FCz, Cz, CPz, Pz). Note: Std, standard; Dev, deviant (target).
Grand-averaged waveforms were filtered with a 8-Hz low-pass filter for graphical display only.

Fig. 3. Topographic maps of the factor loadings for the SFs (‘virtual electrodes’) accounting for most of the variance after rotation.

window around 300 ms: TF3 and TF4. Corroborating previous                                 condition effect was found for the early P3a peak or TF4
studies (e.g. Escera et al., 1998), the P3a to task-irrelevant unex-                      (P > 0.05). The factor scores were significantly enhanced at fron-
pected vocalizations had a double peak over frontocentral scalp                           tocentral sites represented by SF1 (main effect of SF—F(2,
locations, which suggested two different subcomponents. TF4                               34) ¼ 18.108, P < 0.001, g2p ¼ .516; SF1 vs SF2—P < 0.001; SF1 vs
accounted for 14.03% of the variance and occurred in the latency                          SF3—P < 0.001) (see Figure 5).
between 210 and 310 ms. TF3 accounted for 20.53% of the vari-                                 Although no condition effects were found in the earlier
ance, with an latency between 310 and 410 ms.                                             peak of the P3a, a significant effect of condition was observed in
   The factor scores represented by TF4 and TF3 were separ-                               the later part of the P3a window or TF3 [F(2, 34) ¼ 11.183,
ately analyzed through Repeated Measures Analyses of                                      P < 0.001, g2p ¼ 0.397]: larger positive responses were observed
Variance (ANOVA) with condition (neutral, happy and angry)                                for both happy and angry vocalizations than for neutral vocal
and SF (1, 2 and 3) as within-subject factors. No significant                             stimuli (neutral vs happy—P ¼ 0.001; neutral vs angry—P < 0.003)
A. P Pinheiro et al. | 133
Downloaded from https://academic.oup.com/scan/article/11/1/127/2375193 by guest on 04 December 2020
Fig. 4. TF loadings (‘virtual epochs’). Note. The percentage of variance accounted for by each factor is: TF1-13.1677%; TF2-13.1958%; TF3-20.5298%; TF4-14.0251%; TF5-
10.6438%; TF6-4.7668%; TF7-15.5136%; TF8-3.1795%.
Fig. 5. TF3 and TF4 scores associated with SF1, SF2 and SF3, for each vocalization type. Note. The value of the factor scores is a unitless dimension.
(see Figures 2 and 5). No differences between angry and in the statistical model. No significant interaction between time
happy vocalizations were observed (P > 0.05). The factor and condition was observed (P > 0.05).
scores were significantly enhanced at frontocentral sites, repre- In order to better illustrate amplitude variation across trials
sented by SF1 (main effect of SF—F(2, 34) ¼ 12.622, P < 0.001, for each condition, the EEGLab function ‘erpimage()’ was used
g2p ¼ 0.426; SF1 vs SF2—P ¼ 0.009; SF1 vs SF3— P < 0.001) (see (see Figure 6). This function allows the trial-by-trial visualiza-
Figures 2 and 5). tion of ERP amplitude for a specific channel. First, the group
average of ERP activity for each trial and condition (neutral,
Habituation effects of vocalizations. In order to explore whether happy and angry vocalizations) was computed. Then the ‘erp-
the repetition of the non-target vocalization led to differences image()’ function was run on those data. As a result, the group
in adaptation (i.e. amplitude reduction) as a result of stimulus average of trial-by-trial ERP activity for each condition at the Cz
valence, we ran a repeated-measures ANOVA on single-trial electrode was illustrated in a 2D representation, in which time
amplitude data for each vocal stimulus in the two P3 latency (from 200 to 1000 ms) was plotted against trials (from first to
windows (210–310 ms; 310–410 ms). The single trial data were last). Cz was chosen given the frontocentral/central distribution
grouped as beginning (trials 1–10), middle (trials 11–20) and of the P3 effects. The trials were imaged (bottom-to-top) based
end (trials 21–30) of the sequence of vocalizations. The within- on their order of occurrence during the experiment (see Figure
subject factors of time (beginning, middle and end of the se- 6—Panel A). The data matrix input included 33156 observations
quence) and condition (neutral, happy and angry) were included (614 time-points 3 stimulus conditions 18 participants).134 | Social Cognitive and Affective Neuroscience, 2016, Vol. 11, No. 1
Downloaded from https://academic.oup.com/scan/article/11/1/127/2375193 by guest on 04 December 2020
Fig. 6. Trial-by-trial ERP amplitude for neutral, happy and angry vocalizations. (A) 2D representation of the group average of trial-by-trial ERP activity for each condition
at the Cz electrode. Time (200 to 1000 ms) was plotted against trials (from first to last), based on their order of occurrence in the experiment. The figure shows darker
red color (i.e. increased positive amplitude) in the P300 latency window for happy and angry vocalizations compared with the neutral vocalization, consistently from
the first until the last experimental trial. (B) Line graphs showing trial-by-trial mean amplitude in two time windows: 210–310 ms; 310–410 ms. Voltage scores represent
the group average of mean amplitude for each experimental trial in the specified latency intervals. The figure shows trial-by-trial variability in ERP amplitude for the
three conditions.
Using the same EEGlab function, two line graphs were plotted their emotional salience and how this had an impact on the ori-
showing the trial-by-trial group average of mean amplitude in enting response around 300 ms after stimulus onset. Because
the latency intervals of interest: 210–310 ms and 310–410 ms, re- emotional significance evaluation guides the allocation of
spectively (see Figure 6—Panel B). Based on the inspection of attention, it stands to reason that both infrequent and task-
Figure 6, the ERP response across trials for each condition is irrelevant angry and happy vocalizations would automatically
characterized by variability, instead of trial-by-trial amplitude elicit stronger attention orienting as they represent stimuli that
reduction that would suggest neural adaptation. might be of the highest relevance to the organism’s goals, when
compared with neutral vocal stimuli. We observed two dissoci-
able components in the P3 window, corroborating previous stud-
Time–frequency analysis: PLF
ies with infrequent non-target sounds (e.g. Escera et al., 1998,
The repeated-measures ANOVA included condition (neutral, 2000) and the hypothesis that these components reflect different
happy and angry) and electrodes (FCz/1/2, Cz/1/2) as within- cognitive processes (e.g. Friedman et al., 2001). No condition-
subject factors. dependent amplitude differences were observed in the 210–
The PLF of the early auditory evoked gamma response was 310 ms latency window. These differences emerged only in a later
enhanced for happy relative to both neutral (P ¼ 0.027) and latency window (310–410 ms) and consisted of enhanced ampli-
angry (P ¼ 0.020) task-irrelevant vocalizations, as demonstrated tude for emotional relative to neutral vocalizations, with no dif-
by a significant effect of condition [F(2, 34) ¼ 5.920, P ¼ 0.006, ference between pleasant and unpleasant vocal stimuli.
g2p ¼ 0.258) (see Figure 7). An important function of the orienting response is to pre-
pare the organism to deal with an unexpected and potentially
salient stimulus. Previous studies suggest that the early phase
Correlational analyses
of the P3a reflects processes related to automatic attention ori-
Two-tailed Pearson correlation analyses were conducted in an enting that takes place after the unexpected stimulus has been
exploratory analysis of the relationship between significant detected (e.g. Escera et al., 2000). The later phase of the P3a re-
ERP/PLF effects and participants’ affective ratings of the vocal flects the effective orienting of attention towards the salient
stimuli (presented in Table 2). No significant associations were stimuli, involving categorization processes (Friedman et al.,
found (P > 0.05). 2001) that are critical for preparing the organism to goal-
directed action selection (Yamaguchi and Knight, 1991; Escera
et al., 1998, 2001; Debener et al., 2005; Escera and Corral, 2007).
Discussion The absence of condition differences in the 210–310 ms window
Emotion has long been known to modulate attention, leading to suggests that the mismatch signal elicited by the three types of
an enhancement of processing resources. However, it remains non-target unexpected stimuli exceeded the threshold for un-
to clarify to what extent and how salient vocal stimuli, such as attended deviance detection in a similar way. Therefore, the
happy or angry vocalizations, presented as task-unrelated and early part of the P3a responded to stimulus probability or sur-
unexpected stimuli, engage automatic vs voluntary aspects of prise (a factor that was constant for the three vocal conditions
attention. In this study, we probed whether non-target infre- in our study) but not to stimulus salience: the three types of vo-
quent vocalizations—representing complex deviations from calizations automatically triggered a similar attention switch,
stimulus predictability imposed by task-irrelevant high- despite differences in the physical properties and emotional
probability tones—were differentially processed on the basis of salience of the vocal stimuli.A. P Pinheiro et al. | 135
Fig. 7. (A) Time–frequency maps of PLF at FCz and Cz electrodes for neutral, happy and angry vocalizations. (B) Topographic maps of gamma-band PLF (30–50 Hz) in the Downloaded from https://academic.oup.com/scan/article/11/1/127/2375193 by guest on 04 December 2020
75–120 ms window for each condition.
Nonetheless, in a later window (310–410 ms), P3a amplitude preferential access to attentional resources (e.g. Thierry and
was enhanced for emotional vocalizations, irrespective of va- Roberts, 2007). The enhanced mobilization of higher-order at-
lence. Because the later response in the P3 window seems to re- tentional resources for emotionally salient compared with neu-
flect the effective orienting of attention towards stimuli that are tral vocalizations plausibly has an evolutionary source, since it
categorized as salient or emotionally relevant (e.g. Friedman is advantageous to pay more attention to a potential danger or
et al., 2001), our finding provides further support for the notion source of joy communicated through the voice in the social en-
that emotional information cannot be ignored even when it is vironment. For example, the potential threat carried by an
not task-relevant (e.g. Liu et al., 2012), that unexpected emo- angry voice may require a behavioral response with a protective
tional events are rapidly detected and categorized (e.g. Schirmer function (‘fight’ or ‘flight’). Nonetheless, contrary to what has
et al., 2005; Liu et al., 2012), and that emotional cues have a been reported by studies on visual emotional processing, we did136 | Social Cognitive and Affective Neuroscience, 2016, Vol. 11, No. 1
Table 2. Affective ratings of the experimental stimuli by the partici- template of the target (e.g. Debener et al., 2003; Roye et al., 2010):
pants of the study when the perceived sound matches the expected sound, an
enhanced early evoked gamma-band response is observed (e.g.
Type of vocalization Affective Dimension
Engel et al., 2001; Widmann et al., 2007). In emotional oddball
Valence Arousal Dominance paradigms (e.g. novel sounds presented in a neutral or negative
visual context—Garcia-Garcia et al., 2010), the synchronization
Mean (SD) Mean (SD) Mean (SD) of the early auditory evoked gamma-band response has been
found to index the integration of novelty and emotional sali-
Neutral 4.73 (0.70) 3.07 (1.75) 6.80 (1.78)
ence information (Garcia-Garcia et al., 2010), lending support to
Happy 8.27 (0.88) 6.07 (1.98) 6.53 (1.60)
Angry 2.27 (1.10) 6.93 (1.71) 3.07 (1.22) the idea that neurons in the primary auditory cortex are tuned
to respond to the motivational salience of a stimulus (e.g.
Note: Mean 6 SD are given for each variable. Weinberger, 2004).
Even though previous studies suggested that the early
not find a negativity bias (e.g. Ito et al., 1998; Carretié et al., 2001), gamma-band response mainly reflects sensory processing
Downloaded from https://academic.oup.com/scan/article/11/1/127/2375193 by guest on 04 December 2020
i.e. enhanced P3a amplitude for angry relative to happy and (Karakas and Basar, 1998), we have strong reasons to believe
neutral vocalizations. It is plausible that both the modality that this was not the main factor accounting for the PLF differ-
of stimulus presentation (visual vs auditory) and task (task- ences between the three types of vocalizations. If that were the
relevant vs task-irrelevant change detection; change detection case, then we would have additionally observed PLF differences
when attention is focused on the auditory stimuli vs elsewhere) between neutral and angry vocalizations. Indeed, the mean F0
have an impact upon how the behavioral relevance of a stimu- characterizing the vocal stimuli was higher for angry (414.36 Hz)
lus is assessed. The ERP amplitude differences between emo- than for neutral (212.58 Hz) and happy (350.61 Hz) vocalizations.
tionally salient and neutral vocalizations in this study cannot The acoustic difference between angry and neutral vocaliza-
be explained by differences in stimulus probability, a factor that tions was, therefore, the highest (difference angry–
affects the P3, since the three types of vocalizations were pre- neutral ¼ 201.78 Hz; difference happy–neutral ¼ 138.03 Hz;
sented with the same probability. Also, it is unlikely that the difference angry–happy ¼ 63.75 Hz), but no significant PLF differ-
surprise or unusualness of the sounds were the only factor ex- ence was observed between neutral and angry vocalizations.
plaining the effects, since if that were the case we would have We have additionally analyzed the mean F0 of the first 120 ms
observed similar ERP amplitude for the three conditions in the of each vocal stimulus type (neutral ¼ 199.66 Hz;
later P3a peak. Furthermore, these findings do not seem to be happy ¼ 339.55 Hz; angry ¼ 421.74 Hz): the pitch pattern was the
explained by increased habituation to neutral relative to emo- same when considering this shorter sample or the total stimu-
tional vocal sounds, since no significant interaction between mo- lus duration, i.e. increased F0 for angry, followed by happy and
ment and condition was found when analyzing the ERP then by neutral vocalizations. It is also unlikely that the PLF dif-
amplitude in the two P3 latency windows. In other words, the sa- ferences between happy and angry vocalizations were driven by
liency of task-irrelevant stimuli, more than their novelty, seems arousal differences, as subjective arousal ratings were very
to affect the physiological response in a later stage of the P3a. similar for angry and happy stimuli, and no significant associ-
Another important finding from our study is the increased ations were found between PLF findings and participants’ af-
phase synchronization for happy relative to both angry and fective ratings.
neutral vocalizations in the early auditory-evoked gamma-band Considering previous evidence demonstrating the role
response that is typically observed in the first 150 ms after played by gamma oscillations in the association of the percep-
stimulus onset (e.g. Pantev et al., 1991). The PLF differentiation tual properties of stimuli with their emotional significance (e.g.
between positive and negative vocalizations occurred even Oya et al., 2002; Garcia-Garcia et al., 2010), it is surprising that
though the two types of non-target vocalizations elicited a simi- the PLF was not increased for angry vocalizations, refuting
lar P3a response. The early phase-locked auditory gamma-band our initial hypothesis. A plausible explanation is that mood-
response, observed within 100 ms after stimulus onset, reflects congruent effects influenced the match between bottom-up
the synchronization of neural assemblies involved in the per- stimulation and top-down expectations, accounting for the cur-
ceptual processing of sensory input (Hall et al., 2009) that is crit- rent pattern of findings. Indeed, since the participants were col-
ical for the integration of stimulus features and for the lege students with no history of psychopathological disorder, it
assignment of emotional significance to those features (e.g. seems possible that happy vocalizations represented the vocal
Garcia-Garcia et al., 2010). In particular, the PLF represents a stimulus category that was more congruent with their mood,
measure of temporal consistency in neural synchrony, i.e. the and more frequently encountered in daily life social inter-
event-related phase synchronization across trials (e.g. Hall et al., actions. As such, the increased top-down expectations for
2009). The current findings suggest that the neural response to pleasant vocal stimuli may have resulted in a facilitated match
unexpected and task-irrelevant happy vocalizations was char- with bottom-up signals and, therefore, in increased early tem-
acterized by increased temporal synchrony compared with neu- poral consistency of neural synchrony in the gamma-band (see
tral or angry vocal stimuli. Herbert et al., 2008 for a similar account based on ERP results).
Previous studies suggested that early phase synchronization This interpretation is in concordance with studies suggesting
in the gamma-band reflects feature binding underlying stimu- that healthy subjects present a bias towards pleasant informa-
lus representation (Herrman et al., 2004). More recently, the role tion, when compared with depressive subjects (e.g. Deldin et al.,
of gamma-band phase synchronization in sensory prediction 2001; Herbert et al., 2008), and demonstrating the particularly sa-
and change detection has been highlighted (e.g. Fell et al., 2003; lient role of happy vocalizations in healthy participants with no
Herrman et al., 2004; Kveraga et al., 2007). In oddball paradigms, neurological, psychiatric or other medical problems (e.g.
the early auditory evoked gamma-band response has been con- Johnstone et al., 2006; Warren et al., 2006). In keeping with our
sidered an index of a comparison process involving matching results, Roye et al. (2010) found that the early gamma-band re-
bottom-up signals against top-down expectations or a memory sponse was enhanced for participant’s own ringtone comparedA. P Pinheiro et al. | 137
with the ringtone of others within the first 100 ms after stimulus change is detected by participants with mood disorders, such as
onset. The authors hypothesized that the auditory system may depression.
pre-activate the representation of a personally significant
sound. These findings add to more recent evidence showing
top-down influences on early sound processing (e.g. Widmann Conclusions
et al., 2007), and extending the role of the primary auditory cor-
tex beyond the analysis of stimulus acoustic properties to in- Much work remains before we understand vocal emotional pro-
clude: (i) the analysis of the behavioral significance of those cessing as well as face perception is currently understood (e.g.
acoustic properties; (ii) and (perhaps more importantly for the Belin et al., 2004). In the context of social communication, it is
interpretation of the current findings) the short-term and long- advantageous to prioritize emotionally salient events, such as
term retention of specific memory traces about the sounds’ angry or happy vocalizations. We observed that the irregularity
behavioral significance (Weinberger, 2004). It is plausible that, imposed by the three types of unexpected and task-irrelevant
because of the absence of any threat-related consequences in auditory events was similarly detected, but that only emotional
the environment, the evoked gamma-band response to angry vocalizations led to enhanced attention orienting that is neces-
Downloaded from https://academic.oup.com/scan/article/11/1/127/2375193 by guest on 04 December 2020
vocalizations was less temporally stable across trials, in this sary for goal-directed action selection, in the later P3a peak. In
early processing stage. spite of the fact that ERPs did not differentiate between happy
Considering the early time window of this effect (75–120 ms and angry vocalizations, increased synchronized oscillatory ac-
after stimulus onset), it is likely that the acoustic analysis of the tivity in the gamma frequency band for happy vocalizations
complex and rapidly changing vocal stimulus properties suggests that pleasant vocal signals are associated with early
occurred in parallel with the analysis of other stimulus features increased synchronous neural activity across trials than un-
(e.g. stimulus motivational value; memory representations) pleasant or neutral ones.
(Roye et al., 2010). In spite of the differences between happy and Together, these findings further support the idea that the
angry vocal stimuli in the early evoked gamma-band response brain must prioritize the processing of emotionally salient stim-
(i.e. before full access to the emotional meaning of the vocaliza- uli even when they are not task-relevant. In the context of social
tions took place), they elicited similar attentional processing in communication, this means devoting more attentional re-
a later stage indexed by the P3a (310–410 ms). Therefore, distinct sources to angry and happy vocalizations, which represent sali-
stages of auditory processing may be characterized by different ent signals in a social landscape.
neurophysiological effects, as a result of the dynamic interplay
between bottom-up sensory mechanisms and top-down cogni-
tive processes (e.g. Schirmer and Kotz, 2006). For example, re- Funding
cent models such as the Auditory Event Representation System
This work was supported by Grants IF/00334/2012, PTDC/
(Schroger et al., 2014) suggest that after the formation of audi-
tory stimulus representations, regularity representations that PSI-PCL/116626/2010 and PTDC/MHN-PCN/3606/2012 funded
predict subsequent sensory input are formed and, subse- by Fundação para a Ciência e a Tecnologia (FCT, Portugal)
quently, predictions and sensory input are compared. A final and FEDER (Fundo Europeu de Desenvolvimento Regional)
stage is the evaluation of the relevance of the relationship be- through the European programs QREN (Quadro de Referência
tween the incoming sound events and the context. Estratégico Nacional) and COMPETE (Programa Operacional
Furthermore, the model of Schirmer and Kotz (2006) proposes Factores de Competitividade), awarded to A.P.P.
that vocal emotional comprehension is a multi-stage process
Conflict of interest. None declared.
consisting of several stages that are differentially represented
in the brain: after the sensory processing of emotionally
relevant acoustic cues (within the first 100 ms after stimulus
Acknowledgements
onset), salient acoustic features are categorized as emotional
vs non-emotional (around 200 ms after stimulus onset) and, in The authors gratefully acknowledge all the participants who
the last stage (approximately after 300 ms), the cognitive evalu- collaborated in the study, as well as Jason Ridge, Marcelo
ation of the emotional significance of the voice signal takes Dias and Tatiana Magro for their help with data acquisition,
place. and Andréia Rauber for her critical help in stimulus prepar-
We should note that differences in task requirements and ation and editing.
stimulus type may be a critical factor explaining the apparent
inconsistency between this and other studies (e.g. Garcia-Garcia
et al., 2010). For example, the study of Garcia-Garcia et al. (2010) References
did not include a positive emotional context, and participants Belin, P., Bestelmeyer, P.E.G., Latinus, M., Watson, R. (2011).
were asked to focus their attention on visual stimuli selected Understanding voice perception. British Journal of Psychology,
from the International Affective Picture System (Lang et al., 102(4), 711–25.
2005) and to ignore the sounds (a 700 Hz standard tone and 100 Belin, P., Fecteau, S., Bedard, C. (2004). Thinking the voice: neural
unique environmental sounds). Furthermore, in previous stud- correlates of voice perception. Trends in Cognitive Sciences, 8(3),
ies from our research team we have observed differences in the 129–35.
pattern of early gamma-band phase synchronization to neutral, Belin, P., Fillion-Bilodeau, S., Gosselin, F. (2008). The Montreal
happy and angry vocalizations using a passive oddball para- Affective Voices: a validated set of nonverbal affect bursts for
digm (manuscripts in preparation). Future studies should clarify research on auditory affective processing. Behavior Research
the effects of task requirements on PLF and ERP effects. In Methods, 40(2), 531–9.
addition, in order to further explore the putative role of mood- Boersma, P., Weenink, D. (2013). Praat: Doing phonetics by computer
congruency effects on the early auditory gamma-band re- (Version 5.3.53) [Computer program]. Available: http://
sponse, future studies should investigate how emotional vocal www.praat.org/. [July 10, 2013].138 | Social Cognitive and Affective Neuroscience, 2016, Vol. 11, No. 1
Bradley, M.M., Lang, P.J. (1994). Measuring emotion: the self- Escera, C., Alho, K., Winkler, I., Näätänen, R. (1998). Neural mech-
assessment manikin and the semantic differential. Journal of anisms of involuntary attention to acoustic novelty and
Behavior Therapy and Experimental Psychiatry, 25(1), 49–59. change. Journal of Cognitive Neuroscience, 10(5), 590–604.
Campanella, S., Bruyer, R., Froidbise, S., et al. (2010). Is two better Escera, C., Corral, M.J. (2007). Role of mismatch negativity and
than one? A cross-modal oddball paradigm reveals greater novelty-P3 in involuntary auditory attention. Journal of
sensitivity of the P300 to emotional face-voice associations. Psychophysiology, 21(3–4), 251–64.
Clinical Neurophysiology, 121(11), 1855–62. Escera, C., Yago, E., Alho, K. (2001). Electrical responses reveal
Canavarro, M. C. (1999). Inventário de Sintomas Psicopatológicos the temporal dynamics of brain events during involuntary at-
[Brief Symptoms Inventory]: BSI. In: Simões, M.R. Gonçalves, tention switching. European Journal of Neuroscience, 14(5),
M., & Almeida, L.S. (Eds.), Testes e provas psicolœgicas 877–83.
em Portugal [Psychological Tests in Portugal]-vol. II. Braga: SHO/ Escera, C., Yago, E., Polo, M.D., Grau, C. (2000). The individual rep-
APPORT. licability of mismatch negativity at short and long inter-stimu-
Canavarro, M.C. (2007). Inventário de Sintomas Psicopatológicos lus intervals. Clinical Neurophysiology, 111(3), 546–51.
(BSI): Uma revisão crı́tica dos estudos realizados em Portugal. Fell, J., Fernandez, G., Klaver, P., Elger, C.E., Fries, P. (2003). Is
Downloaded from https://academic.oup.com/scan/article/11/1/127/2375193 by guest on 04 December 2020
In: Simões, M.R., Machado, C., Gonçalves, M., Almeida, L., edi- synchronized neuronal gamma activity relevant for selective
tors. Avaliação psicológica. Instrumentos validados para a popula- attention?. Brain Research Reviews, 42(3), 265–72.
ção Portuguesa, vol. III, pp. 305–31. Coimbra: Quarteto Editora. Fenske, M.J., Raymond, J.E. (2006). Affective influences of select-
Carretié, L., Mercado, F., Tapia, M., Hinojosa, J.A. (2001). Emotion, ive attention. Current Directions in Psychological Science, 15(6),
attention, and the ‘negativity bias’, studied through event-re- 312–6.
lated potentials. International Journal of Psychophysiology, 41(1), Friedman, D., Cycowicz, Y.M., Gaeta, H. (2001). The novelty P3: an
75–85. event-related brain potential (ERP) sign of the brain’s evalu-
Cattell, R.B. (1966). The scree test for the number of factors. ation of novelty. Neuroscience and Biobehavioral Reviews, 25(4),
Multivariate Behavioral Research, 1(2), 245–76. 355–373.
Chennu, S., Noreika, V., Gueorguiev, D., et al. (2013). Expectation Fries, P., Reynolds, J.H., Rorie, A.E., Desimone, R. (2001).
and attention in hierarchical auditory prediction. The Journal of Modulation of oscillatory neuronal synchronization by select-
Neuroscience, 33(27), 11194–205. ive visual attention. Science, 291(5508), 1560–3.
Compton, R.J. (2003). The interface between emotion and atten- Garcia-Garcia, M., Yordanova, J., Kolev, V., Domı́nguez-Borràs, J.,
tion: a review of evidence from psychology and neuroscience. Escera, C. (2010). Tuning the brain for novelty detection under
Behavioral and Cognitive Neuroscience Reviews, 2(2), 115–29. emotional threat: the role of increasing gamma phase-syn-
Courchesne, E., Hillyard, S.A., Galambos, R. (1975). Stimulus nov- chronization. Neuroimage, 49(1), 1038–44.
elty, task relevance and the visual evoked potential in man. Goldstein, A., Spencer, K.M., Donchin, E. (2002). The influence of
Electroencephalography and Clinical Neurophysiology, 39(2), 131–43. stimulus deviance and novelty on the P300 and novelty P3.
Debener, S., Makeig, S., Delorme, A., Engel, A. K. (2005). What is Psychophysiology, 39(6), 781–90.
novel in the novelty oddball paradigm? Functional significance Gratton, G., Coles, M.G.H., Donchin, E. (1983). A new method for
of the novelty P3 event-related potential as revealed by inde- off-line removal of ocular artifact. Electroencephalography and
pendent component analysis. Cognitive Brain Research, 22(3), Clinical Neurophysiology, 55(4), 468–84.
309–21. Hall, M.-H., Taylor, G., Sham, P., et al. (2009). The early
Debener, S., Herrmann, C.S., Kranczioch, C., Gembris, D., Engel, auditory gamma-band response is heritable and a putative
A.K. (2003). Top-down attentional processing enhances audi- endophenotype of schizophrenia. Schizophrenia Bulletin, 37(4),
tory evoked gamma band activity. NeuroReport, 14(5), 683–6. 778–87.
Deldin, P.A., Keller, J., Gergen, J.A., Miller, G. (2001). Cognitive bias Hawk, S.T., Van Kleef, G.A., Fischer, A.H., Van der Schalk, J. (2009).
and emotion in neuropsychological models of depression. “Worth a thousand words”: absolute and relative decoding of
Cognition and Emotion, 15, 787–802. nonlinguistic affect vocalizations. Emotion, 9(3), 293–305.
Delorme, A., Makeig, S. (2004). EEGLAB: an open source toolbox Herbert, C., Junghofer, M., Kissler, J. (2008). Event related poten-
for analysis of single-trial EEG dynamics including independ- tials to emotional adjectives during reading. Psychophysiology,
ent component analysis. Journal of Neuroscience Methods, 134(1), 45(3), 487–98.
9–21. Herrmann, C.S., Munk, M.H., Engel, A.K. (2004). Cognitive func-
Derogatis, L.R. (1993). BSI, Brief Symptom Inventory: Administration, tions of gamma-band activity: memory match and utilization.
Scoring, and Procedures Manual. Minneapolis, MN: National Trends in Cognitive Sciences, 8(8), 347–55.
Computer Systems. Ito, T.A., Larsen, J.T., Smith, N.K., Cacioppo, J.T. (1998). Negative
Dien, J. (1998). Issues in the application of the average reference: information weighs more heavily on the brain: the negativity
Review, critiques, and recommendations. Behavior Research bias in evaluative categorizations. Journal of Personality and
Methods, Instruments, and Computers, 30(1), 34–43. Social Psychology, 75(4), 887–900.
Domı́nguez-Borràs, J., Garcia-Garcia, M., Escera, C. (2012). Phase Jessen, S., Kotz, S. A. (2013). On the role of crossmodal prediction
re-setting of gamma neural oscillations during novelty process- in audiovisual emotion perception. Frontiers in Human
ing in an appetitive context. Biological Psychology, 89(3), 545–52. Neuroscience, 7, 369.
Donchin, E. (1981). “Surprise! . . . surprise?”. Psychophysiology, Johnstone, T., Van Reekum, C.M., Oakes, T.R., Davidson, R.J.
18(5), 493–513. (2006). The voice of emotion: an FMRI study of neural re-
Donchin, E., and Coles, M.G. (1988). Is the P300 component a sponses to angry and happy vocal expressions. Social Cognitive
manifestation of context updating? Behavioral and Brain and Affective Neuroscience, 1(3), 242–49.
Sciences, 11(3), 357–74. Karakas, S., Basar, E. (1998). Early gamma response is sensory in
Engel, A.K., Fries, P., Singer, W. (2001). Dynamic predictions: origin: a conclusion based on cross-comparison of results from
Oscillations and synchrony in top-down processing. Nature multiple experimental paradigms. International Journal of
Reviews Neuroscience, 2(10), 704–16. Psychophysiology, 31(1), 13–31.You can also read