SCHOOL DISTRICT REPORT - SCHOOL DISTRICT 34| Abbotsford 2020/2021 PILOT PHASE 2 - CHART Lab
←
→
Page content transcription
If your browser does not render page correctly, please read the page content below

SCHOOL DISTRICT 34| Abbotsford

SCHOOL DISTRICT REPORT

2020/2021 PILOT PHASE 2

ACKNOWLEDGEMENTS
We gratefully acknowledge that we live and work on the unceded, ancestral, and traditional territories
of the xʷməθkwəy̓əm (Musqueam), Skwxwú7mesh (Squamish), Stó:lō, Səl̓ílwətaɬ (Tsleil-Waututh), and
kʷikʷəƛ̓əm (Kwikwetlem) Nations on the Burnaby Mountain Campus of Simon Fraser University.

The Youth Development Instrument (YDI) pilot is supported by funding provided to Dr. Hasina Samji
from the British Columbia Center for Disease Control and Simon Fraser University.

The YDI follows in the footsteps of the Middle Years Development Instrument (MDI), and other child
monitoring tools developed by the Human Early Learning Partnership (HELP) at the University of British
Columbia. We thank HELP, and the HELP Aboriginal Steering Committee, for their support and guidance
in building and implementing the YDI. We would also like to extend our sincere gratitude to YDI Co-
Investigators Drs. Martin Guhn and Kimberly Schonert-Reichl for their ongoing collaboration and
guidance, and to Drs. Naomi Dove, Kim Thomson, Michael Warren, Jessica Trach and Ms. Michelle Pang
for their contributions to the project.

We are grateful for the insight and advice from the YDI Provincial Policy and Practice Advisory Board,
composed of school district administrators and staff, Ministry and community organization
representatives, and public health and medical professionals, as well as our YDI Youth Advisory
Committee, which have helped guide YDI development and implementation.

We are also thankful to Maple Ridge Pitt Meadows and Pacific Rim school districts for participating in
Phase 1 of the YDI pilot in Fall 2020 and the support and hard work of the education staff, teachers, and
school administrators in all of our pilot districts.

And finally, we want to share our warmest appreciation to the many students who took the time to
share their insights with us.

YDI research is led by Principal Investigator Dr. Hasina Samji, Director of the Capturing Health and
Resilience Trajectories (CHART) lab, Assistant Professor in the Faculty of Health Sciences at Simon Fraser
University and Senior Scientist at the BC Centre for Disease Control.

The Youth Development Instrument was approved by the Behavioural Research Ethics Board, University
of British Columbia, ID#: H20-02544.

© Dr. Hasina Samji, 2021                                                             PAGE                2

PROJECT TEAM
Dr. Hasina Samji, Principal Investigator
Gaelen Snell, Research Coordinator
Dr. Martin Guhn, Co-investigator
Dr. Kimberly Schonert-Reichl, Co-investigator
Mari del Casal, Implementation Coordinator
Brooke Low, Research Assistant
Judy Wu, Research Assistant
Amilya Ladak, Research Assistant
David Long, Research Assistant
Lauren Gorfinkel, Research Assistant

2020-2021 YOUTH ADVISORY COMMITTEE
 Aadi Kaur                                             Jacob Campbell
 Alyssa Wellar                                         Logan Isfield
 Ayden James Thane                                     Maya Beninteso
 Brandon Stellaard                                     Qaleem Rawji
 Caila Tymchuk                                         Rufina Aniyado
 Charmaine Lee                                         Sierra Lee
 Emmi Ouelette                                         Stephanie Quon
 Jace Lamoureux                                        Zoey Thom-Lucy

CONTACT INFORMATION:
For any additional questions about the YDI or its data, please contact: ydi@sfu.ca or see:
http://chartlab.ca/ for more information.

Suggested Citation
Samji, H., Snell, G., del Casal, J. M., Low, B., Wu, J., Long, D. (2021). Youth Development Instrument
School District Report, 2020-2021. SD34: Abbotsford. Burnaby, BC: Simon Fraser University.

© Dr. Hasina Samji, 2021                                                              PAGE               3
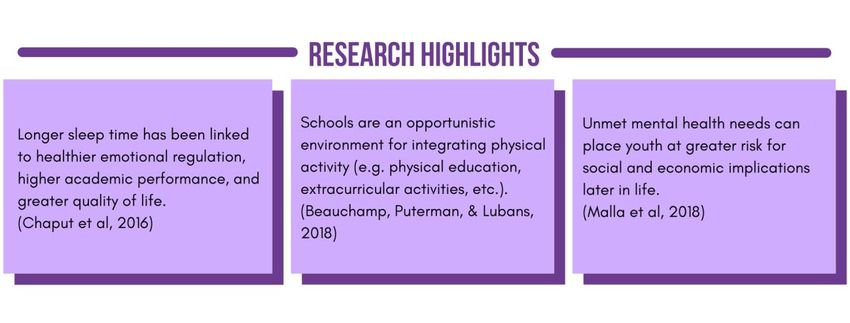
TABLE OF CONTENTS

 INTRODUCTION TO THE YDI                          5

 YDI DIMENSIONS & DOMAINS                         6

 CONNECTING THE YDI TO THE BC CURRICULUM          7

 2020/2021 SCHOOL DISTRICT RESULTS                8

     Demographics                                 10
     Well-being and Asset Indices                 12
     Social and Emotional Development             14
     Social Well-being                            18
     Learning Environment and Engagement          21
     Physical and Mental Well-being               24
     Navigating the World                         28

 YDI CROSS-CUTTING DOMAINS                        30

    Positive Childhood Experiences                30
    Positive Mental Health                        30
    Impacts of COVID-19                           31

 REFERENCES                                       32

© Dr. Hasina Samji, 2021                   PAGE        4
INTRODUCTION TO THE YDI

WHY DOES YOUTH MATTER?

Late adolescence is an important developmental period that defines future health, social, and well-being
trajectories. During this time, youth experience remarkable changes physically, neurodevelopmentally,
and socially. In turn, these changes impact how youth think, feel, and behave in the world around them
(Dahl & Hariri, 2005; World Health Organization, 2021). For instance, changes in cognitive capacities are
reflected in youth’s ability to think more abstractly, engage in more complex problem solving, and
process information and stimuli in more nuanced ways (Zarrett & Eccles, 2006). Youth also experience
significant changes in their social relationships, marked by growing autonomy from parents and
caregivers to other influential relationships such as peers, romantic partners, and other adults in the
community (Zarrett & Eccles, 2006).

While late adolescence is an important period of development, so is the transition to young adulthood.
During this time, new social roles and responsibilities are adopted (Scales et al., 2016). While these new
roles may be challenging, early conditions that propel young people on positive trajectories can also
help negotiate this challenging transition (Scales, 2016). As such, youth can achieve positive
developmental outcomes when they are provided with opportunities, resources, and structures that
enable them to attain skills to negotiate adversity and establish healthy behaviours.

WHAT IS THE YOUTH DEVELOPMENT INSTRUMENT?
Building on the work of the Early Development Instrument (EDI) and the MDI, the YDI is a self-report
questionnaire that seeks to understand the health and well-being of Grade 11 students in British
Columbia. This survey takes a strengths-based approach through its emphasis on developmental assets
such as thriving, positive childhood experiences, and positive mental health. These assets, also known as
‘cross-cutting domains', span the YDI’s five primary dimensions: Social and Emotional Development,
Social Well-being, Learning Environment and Engagement, Physical and Mental Well-being, and
Navigating the World. Each dimension is divided into several domains and subdomains that ask
questions about myriad of emotions, thoughts, experiences, and habits.

These five collective dimensions strategically identify individual and contextual resources, opportunities,
and practices that foster or hinder positive youth development. At the same time, using data linkages,
researchers can monitor how responses change over time and map out how current youth experiences
effectively shape trajectories into emerging adulthood. The YDI helps produce a more elaborate, in-
depth landscape of youth health and well-being to inform policies and practices that support thriving
and healthy trajectories.

© Dr. Hasina Samji, 2021                                                              PAGE                5

YDI DIMENSIONS & SUBDOMAINS*

                           *selected subdomains included in the report

© Dr. Hasina Samji, 2021                           PAGE             6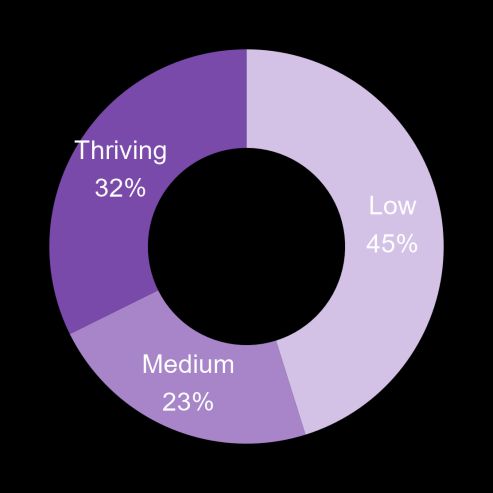
CONNECTING THE YDI TO THE BC
CURRICULUM
The YDI illuminates both youth development and well-being, complementing BC’s approach to learning.

Figure 1. Examples of YDI construct connections to BC Curriculum

The YDI also aligns with the BC Ministry of Education’s Mental Health in Schools Strategy. Our intention
behind collecting YDI data and providing summary reports is to enhance school systems’ supports and
build their capacity to document current student trends. These data can help evaluate student mental
health outcomes and inform decision-making and agenda setting at both the district and school levels.

© Dr. Hasina Samji, 2021                                                            PAGE                   7

SCHOOL DISTRICT RESULTS
ABOUT THE DATA
This report contains data from Grade 11 students in six school districts and an independent school that
participated in the 2020/2021 YDI Pilot Phase 2. These districts include Pacific Rim, Sunshine Coast,
Maple Ridge-Pitt Meadows, Revelstoke, Abbotsford, and Kootenay Lake. Please note that these pilot
data are from a small selection of districts and are not representative of all BC students.

Some subdomains on the YDI are measured using a set of several questions called a “scale.” Youth’s
responses within these subdomains are summarized by 1) converting their answers to each question
into a numeric score and 2) adding or averaging these scores across the questions included in the scale.
Both results of youth in your district and youth in all participating districts are reported.

Keep in mind that larger districts’ results will be closer to overall results because their students
represent a higher proportion of the total YDI sample. To maintain student confidentiality, statistics
calculated from the data of five or fewer students are not included in the report, and average statistics
for all reported districts are displayed instead.

Please also note that only select subdomains from the YDI survey are included in this report. The
subdomains reported were chosen in collaboration with our school district stakeholders to best meet
their needs and the needs of their students. As well, the report contains YDI subdomains that also
appear on the MDI, enabling districts to track the trajectories of their students by comparing MDI results
of the same students, if available. YDI subdomains that also appear on the MDI are marked with an
asterisk (e.g. empathy*).

HOW THE RESULTS ARE SCORED
The YDI uses 3 primary categories of questions to measure subdomains: Agreement Questions, Rating
Questions, and Frequency Questions. Subdomains containing unique question types are described in the
results section.

Agreement Questions
For the majority of the questions on the YDI, youth indicated their level of       EXAMPLE AGREEMENT
agreement with a given statement. For example, students were presented                  OPTIONS
with the following in the Loneliness subdomain:                                 5 = ‘Agree a lot’
Please indicate your agreement or disagreement with each of the                 4 = ‘Agree a little’
                                                                                3 = ‘Don’t agree or disagree’
following statements:                                                           2 = ‘Disagree a little’
     1. “I feel lonely”                                                         1 = ‘Disagree a lot’
     2. “I often feel left out”
     3. “There is no one I feel close to”

© Dr. Hasina Samji, 2021                                                               PAGE                     8
Rating Questions
EXAMPLE RATING OPTIONS
Some subdomains contain questions that ask youth to provide a rating.
5 = ‘Excellent’
For example, youth were asked the following in the General Health
4 = ‘Very good’
subdomain: 3 = ‘Good’
In general, how would you describe your health? 2 = ‘Fair’
1 = ‘Poor’
Frequency Questions
Other subdomains include questions that ask how frequently youth EXAMPLE FREQUENCY
OPTIONS
engage in certain activities or behaviours. These subdomains each
contain their own frequency-specific scale that is reported accordingly. 7 = Every day
6 = 6 times a week
For example, youth answered the following in the Physical Activity
5 = 5 times a week
subdomain: 4 = 4 times a week
Over a typical or usual week, on how many days are you physically active 3 = 3 times a week
for a total of at least 60 min per day? 2 = 2 times a week
1 = 1 time a week
0 = Never
HOW TO INTERPRET THE RESULTS
Students’ subdomain scores are categorized as ‘High’, ‘Medium’ or ‘Low’.
SCORING
High: Scores ≥80% of the scale’s max value (e.g. ≥12 out of 15)
Medium: ≥60% andDEMOGRAPHICS
POPULATION
Total Sample 1139
GENDER IDENTITY
Male 51% In another way 2%
Female 43%
ETHNICITY
Indigenous peoples of 6% East Asian 6%
Canada
White 46% Southeast Asian 5%
Black 3% South Asian 33%
Latin, Central or South 3% Other 6%
American
Middle Eastern 2%
IMMIGRATION
Born in Canada 79% Born outside of 18%
Canada
LANGUAGES SPOKEN AT HOME
English only 49%
English and other language(s) 37%
Other language(s) only 11%
PARENTAL EDUCATION
Graduate or Professional Degree (e.g., Masters, PhD) 13%
University Degree (e.g., Bachelors) 20%
College Program (e.g., diploma, certificate, apprenticeship) 19%
High school or less 22%
I don’t know/Not Applicable 16%
FAMILY AFFLUENCE
High 36%
Medium 45%
Low 16%
DEMOGRAPHICS DESCRIPTIONS
Population:
Total number of students whose data are included in this report.
Gender Identity:
Youth selected which gender they self-identify as. If youth do not identify as “Male” or “Female”, they
may select “In another way” and then specify.
© Dr. Hasina Samji, 2021 PAGE 10Ethnicity: Youth selected the ethnicity with which they self-identify. Youth of mixed descent can select more than one category. Some ethnicity categories have been collapsed to represent larger geographic regions. Middle Eastern includes those who identify as Arab (e.g., Egyptian, Lebanese) or West Asian (e.g., Afghan, Iranian). East Asian includes those who identify as Chinese (e.g., Mainland China, Hong Kong, Macau, and Taiwan), Japanese or Korean. Southeast Asian represents those who identify as Filipino or other Southeast Asian (e.g., Cambodian, Indonesian, Laotian, Vietnamese, etc.) Other represents those who do not identify as part of any of the categories above, including those who are Indigenous from outside of Canada. Immigration: Youth indicated whether they were born in Canada or outside of Canada. Languages Spoken at Home: Youth indicated any language(s) they speak at home. Answers were categorized into “English only”, “English and other language(s)”, and “Other language(s) only”. Parental Education: The highest level of education at least one parent has completed (e.g., if parent one has a Masters degree and parent two has a Bachelors degree, parents are counted as part of the graduate level). Family Affluence: Family affluence was measured using a youth-friendly scale containing indicators of socioeconomic status (e.g., having a dishwasher, number of bathrooms, owning a car, etc.). Family affluence is categorized as low, medium, and high based on the sum score across all socioeconomic indicators. © Dr. Hasina Samji, 2021 PAGE 11
WELL-BEING INDEX
Adolescent well-being can be defined as “[having] the support, confidence, and resources to thrive in
contexts of secure and healthy relationships, realizing their full potential and rights” (Ross et al., 2020).
The YDI reports on the same indicators of physical, social, and emotional well-being as the MDI to
encourage trajectory mapping.

                                                                        •     Absence of Sadness
                     •   Optimism
                                                                        •     General Health
                     •   Self-Esteem
                                                                        •     Happiness

Scores from these five measures are summed and categorized as the following:

                High Well-Being
                                                     Medium Well-Being                        Low Well-Being
                (Thriving)                           Youth who indicated                      Youth who indicated a
                Youth who indicated high             high scores in three                     low score in one
                scores in a minimum of               or fewer measures,                       or more measures.
                four measures and have
                                                     but still did not have
                no low scores.
                                                     any low scores.

                   Abbotsford                                       All Participating Districts

© Dr. Hasina Samji, 2021                                                                   PAGE               12
ASSETS INDEX
In contrast to the individual-level nature of the well-being indices, assets are more contextual. They are
considered experiences or relationships that contribute to healthy trajectories (HELP, 2021). What
makes assets so unique is that they can be modified through changes in youth’s environments (HELP,
2021). As such, schools are a key player in cultivating and enhancing students’ assets. This Assets Index
is reproduced from the MDI and uses equivalent measures. Please note that School Experiences are also
considered an asset; however, they are excluded from this index and reported more comprehensively in
the Learning Environment and Engagement section on page 20.
Peer Relationships Adult Relationships Nutrition & Sleep After-school
Peer Belonging Supportive Adults at Home Sleep activities
Friendship Intimacy Supportive Adults at School Eating Breakfast Extracurricular
Supportive Adults in the Meals at Home with Family activities
Community
Abbotsford All Participating Districts
© Dr. Hasina Samji, 2021 PAGE 13SOCIAL AND EMOTIONAL DEVELOPMENT Social and emotional development encompasses the knowledge, attitudes, and skills involved in emotional management, positive goal setting, healthy relationship development, responsible decision- making, and effective problem-solving. These competencies are necessary for successfully navigating the social and emotional challenges the period of youth and emerging adulthood. EMOTIONAL SELF-REGULATION* Youth’s level of agreement with statements about their ability to recognize and control their emotions. e.g., “I can calm myself down when I’m excited or upset” *called Self-Regulation (Short-term) on the MDI EMPATHY* Youth’s level of agreement with statements about their ability to recognize and understand someone else’s emotions and experiences. e.g., “I am a person who cares about the feelings of others” PERSPECTIVE TAKING Youth’s level of agreement with statements about their ability to imagine a situation from someone else’s point of view. e.g., “When I’m upset with someone, I usually try to put myself in their shoes for awhile” RESPONSIBLE DECISION-MAKING* Youth’s level of agreement with statements about whether they consider the impacts and repercussions of their actions. e.g., “When I make a decision, I think about what might happen afterward” © Dr. Hasina Samji, 2021 PAGE 14
SELF-ESTEEM*
 Youth’s level of agreement with statements about how
 they see and value themselves.

  e.g., “In general, I like the way I am”

 PURPOSE AND MEANING
 Youth’s level of agreement with statements about having a
 meaningful life.

 e.g., “My life has a clear sense of purpose”

 SELF-EFFICACY
 Youth’s level of agreement with statements about their
 ability to accomplish goals and tasks.

  e.g., “I believe that I am capable in most things”

 AUTONOMY
 Youth’s level of agreement with statements about their
 capacity to think, choose, and act independently.

  e.g., “I decide most of my life decisions”

 PERSERVERANCE*
 Youth’s rating of their sense of self-discipline and work
 ethic.

 e.g., “I finish whatever I begin”

© Dr. Hasina Samji, 2021                                     PAGE   15
SELF-CONTROL
 Youth’s level of agreement with statements about their
 ability to focus and keep tabs on information related to
 short-term tasks and activities.

 e.g., “I often forget what I have done”, “It is difficult for me
 to sit still”

 Note: This subdomain is reversed scored, meaning that a higher score indicates
 greater youth-reported self-control.

 OPTIMISM*
 Youth’s level of agreement with statements about
 whether they have a positive outlook on their life.

 e.g., “I believe more good things than bad things will
 happen to me”

 ENGAGEMENT
 Youth’s level of agreement with statements about how
 invested and enthusiastic they are about their work and
 activities.

 e.g., “I get fully absorbed in the activities I do”

 GRATITUDE
 Youth’s level of agreement with statements about feeling
 grateful about things in their lives.

  e.g., “I feel thankful for everyday things”

© Dr. Hasina Samji, 2021                                                          PAGE   16
© Dr. Hasina Samji, 2021 PAGE 17
SOCIAL WELL-BEING
Social well-being assesses the quality and number of meaningful relationships with peers, family, and
community members. Positive and healthy social relationships play an important role in promoting
physical, mental, and emotional health during and beyond youth.

 FRIENDSHIP INTIMACY*
 Youth’s level of agreement with statements about the
 closeness of their friendships.

 e.g. “I have friends I can tell everything to”

 PEER BELONGING*
 Youth’s level of agreement with statements about their sense
 of belonging to a social group.

 e.g. “I feel that I usually fit in with other kids around me”

 SUPPORTIVE ADULTS IN THE COMMUNITY*
 Youth’s level of agreement with statements about how
 supported they feel by the adults in their community.

 e.g. “In my neighbourhood/community, there is an adult who
 really cares about me”

 *called Adults in the Neighbourhood/Community on the MDI

 COMMUNITY BELONGING
 Youth’s rating of their sense of belonging in their local
 community and neighbourhood.

 e.g. “How would you describe your sense of belonging to your
 local community?”

 NUMBER OF SUPPORTIVE ADULTS IN THE COMMUNITY
 The number supportive adults in youth’s lives, including parents, relatives, school figures, adults from
 extracurricular activities or other adults.

© Dr. Hasina Samji, 2021                                                             PAGE              18
79%                               13%                              8%
                5+ adults                         3-4 adults                      0-2 adult

                  79%                                 13%                              8%
           average of reported            average of reported districts   average of reported districts
                districts

 DISCRIMINATION
 How frequently youth experience discrimination.

 e.g. “In your day-to-day life, how often are you are treated
 with less courtesy or respect than other people”

 SUPPORTIVE ADULTS AT HOME*
 Youth’s level of agreement with statements about how
 supported they feel by the adults at home.

 e.g. “In my home, there is a parent or another adult who
 really cares about me”

 *called Adults at Home on the MDI

© Dr. Hasina Samji, 2021                                                          PAGE                    19
LEARNING ENVIRONMENT AND ENGAGEMENT The learning environment and engagement dimension seeks to understand youth’s experiences at school, including their feelings and experiences regarding their academic work, the school environment, and the broader school community. SCHOOL BELONGING* Youth’s level of agreement with statements about their sense of belonging at school. e.g., “I feel like I belong at this school” SUPPORTIVE ADULTS AT SCHOOL* Youth’s level of agreement with statements about how supported they feel by the adults at their school. e.g., “At my school, there is an adult who really cares about me” *called Adults at School on the MDI SCHOOL ENVIRONMENT* Youth’s level of agreement with statements about the social atmosphere of the school, including the relationships and interactions between and amongst students and staff. e.g., “Teachers and students treat each other with respect in this school” *called School Climate on the MDI SCHOOL SAFETY Youth’s level of agreement with the statement “I feel safe at my school” © Dr. Hasina Samji, 2021 PAGE 20
SCHOOL                               SCHOOL                       SKILLS FOR THE FUTURE
         MOTIVATION                           PRESSURE

               69%                              82%                                      78%
   agree a lot that getting an          feel at least some                 agree a lot that they have
   education is important to            pressure by their               opportunities to develop job and
              them                         schoolwork                               life skills

                67%                              80%                                      75%
    average of reported districts    average of reported districts            average of reported districts

 BULLYING*
 How frequently youth experienced bullying or harassment during the school year, including physical,
 social, verbal, and/or cyberbullying.

     Cyberbullying (e.g., online messaging)                    Physical Bullying (e.g., hit or kicked)

© Dr. Hasina Samji, 2021                                                                   PAGE               21
Social Bullying (e.g., exclusion, gossip) Verbal Bullying (e.g., threatened, teased) © Dr. Hasina Samji, 2021 PAGE 22
PHYSICAL AND MENTAL
WELL-BEING
Physical and mental well-being provides a description of habits, behaviours, and exposures that shape
both physical and mental well-being. It also asks about youth’s experiences accessing and utilizing
healthcare services. This dimension of the YDI helps identify risk factors that may be important for
averting poor health trajectories in emerging adulthood.

 GENERAL HEALTH*
 Youth’s rating of their overall health.

 e.g., “In general, how would you describe your health”

 FOOD SECURITY
 How frequently youth reported experiencing food insecurity
 in the past 30 days.

 e.g., “During the past 30 days, how often did you go hungry
 because there was not enough food in your home?”

 Note: This subdomain is reversed scored, meaning that youth in the ‘High’ category
 reported low levels of food insecurity.

 SLEEP*
 Number of nights a week youth reported having a good night’s sleep.

 e.g., “How often do you get a good night’s sleep?”

                    24%                                           45%                            31%
                 5-7 nights                                     3-4 nights                    0-2 nights
                    22%                                           46%                             32%
        average of reported districts                 average of reported districts   average of reported districts

© Dr. Hasina Samji, 2021                                                                               PAGE           23
PHYSICAL ACTIVITY*
Number of days a week youth reported being physically active for at least an hour.
40% 29% 31%
5-7 days 3-4 days 0-2 days
40% 29% 31%
average of reported districts average of reported districts average of reported districts
_
LIFE SATISFACTION*
Youth’s level of agreement with statements about how
content they are with their lives.
e.g., “I am happy with my life”
*called Happiness on the MDI
GENERAL MENTAL HEALTH
Youth’s rating of their overall mental health.
e.g., “In general, would you say your mental health is…?”
DEPRESSION
Depression was examined using a modified version of the
Patient Health Questionnaire (PHQ-8). Please note that the
PHQ-8 is used as a screening tool and is not designed to
provide a diagnosis of depression. Youth with a sum score of
ten or above are considered to have screened positive.
e.g., “Over the last two weeks, how often have you been
bothered by feeling down, depressed or hopeless?”
37%
screened positive
for depression
40%
average of reported districts
© Dr. Hasina Samji, 2021 PAGE 24GENERALIZED ANXIETY
Generalized anxiety was examined using the Generalized
Anxiety Disorder 2-item (GAD-2) scale. Please note that the
GAD-2 is used as a screening tool and is not designed to
provide a diagnosis of generalized anxiety. Youth with a sum
score of three or above on the GAD-2 are generally
considered to have screened positive for generalized
anxiety.
e.g., “Over the last two weeks, how often have you been
42%
bothered by feeling nervous, anxious, or on edge?” screened positive on the GAD-2 for
generalized anxiety
(scored three or above)
43%
average of reported districts
SOCIAL ANXIETY*
Youth’s level of agreement with statements related to social
anxiety.
e.g., “I worry a lot that other people might not like me.”
*called Absence of Worries on the MDI
COPING
The percentage of youth who reported engaging in different activities helped them manage
distressing events, including COVID-19.
78% 14% 65%
connect with family and seek external support exercise or spend time outdoors
friends (e.g., teachers, counsellors,
Elders)
67%
80% average for reporting districts
16%
average for reporting districts average for reporting districts
© Dr. Hasina Samji, 2021 PAGE 2560% 79% 26%
turn to hobbies or use technology or social use another coping mechanism
extracurricular activities media (e.g., eating more than usual, using
substances)
30%
60% 80% average for reporting districts
average for reporting districts average for reporting districts
UNMET MENTAL HEALTHCARE NEEDS
The percentage of youth who reported feeling that they
needed help from a mental healthcare professional but did
not seek help in the past six months.
32%
reported an unmet mental
healthcare need
36%
average of reported districts
MENTAL HEALTHCARE NAVIGATION
The percentage of youth who said they would prefer to get help for an emotional problem from the
sources below.
33% 2% 4%
prefer to get help in person prefer to get help over the prefer to get help on the
phone (helpline) Internet
35%
average of reported districts 2% 4%
average of reported districts average of reported districts
© Dr. Hasina Samji, 2021 PAGE 262% 14%
prefer to get to talk over videocall probably would not seek professional help
16%
2% average of reported districts
average of reported districts
© Dr. Hasina Samji, 2021 PAGE 27NAVIGATING THE WORLD
Navigating the world encompasses a variety of subdomains that ask youth to think about how they
envision their future and encourages them to reflect on their local and global environment. As youth are
preparing to enter early adulthood, understanding their long-term goals, values, concerns and how they
fit in their larger setting is important.
GENDER EQUALITY*
Youth’s level of agreement with statements about gender
equality and gender roles.
e.g. “On the whole, men make better political leaders than
women do”
Note: This subdomain is reversed scored, meaning that the higher scores represent
greater agreement with statements about gender equality.
MULTICULTURAL IDEOLOGY
Youth’s level of agreement with statements about the
importance of cultural and ethnic diversity in Canada and
within society.
e.g. “We should help ethnic and racial minorities preserve
their cultural heritages in Canada”
STRESS OF FUTURE UNCERTAINITY
Youth’s rating of how stressed they feel about decisions
regarding their future and financial security.
e.g. “Concern for your future, Not having enough money to
buy the things you need, etc.”
COMMUNITY SERVICE*
The percentage of youth who reported volunteering with any
community groups (e.g., service groups, environmental
groups, community youth groups, etc.).
*reported as part of Citizenship and Social Responsibility on the MDI
71%
have volunteered before
70%
average of reported districts
© Dr. Hasina Samji, 2021 PAGE 28CIVIC ENGAGEMENT
The percentage of youth who intend to vote in the future.
e.g. “When you’re old enough, do you plan to vote in national 80%
(federal) elections?” expressed intent to vote in the
future
81%
average of reported districts
FUTURE GOALS*
The percentage of youth who plan to graduate from high school and post-secondary education.
99% 92%
plan to graduate from high school plan to graduate from post-secondary
99% 92%
average of reported districts average of reported districts
*reported as part of School Experiences on the MDI
© Dr. Hasina Samji, 2021 PAGE 29CROSS-CUTTING DOMAINS
In addition to its five primary dimensions, the YDI measures other strengths-based indicators of positive
youth development that transcend the dimensions. Known as cross-cutting domains, these indicators
are broadly shaped by a combination of emotional, social, physical, mental competencies and
experiences that act as both promoters towards positive trajectories and buffers against adverse youth
outcomes.
POSITIVE CHILDHOOD EXPERIENCES (PCEs)
PCEs lead to increased resilience to adversity. They include:
▪ the ability to discuss feelings with family;
▪ having family support during difficult times;
▪ participating in community traditions;
▪ having a sense of belonging in school;
▪ feeling supported by friends;
▪ having two invested non-parental adults and;
▪ feeling safe at home.1
Results are based on the number of reported PCEs:
High (7), Medium (3-6), and Low (0-2).
POSITIVE MENTAL HEALTH
Positive mental health was assessed using the Warwick-
Edinburgh Mental Well-being Scale (WEMWBS).2 The
WEMWBS is a seven-item scale that asks how frequently
youth have experienced clear and healthy thought
patterns, positive self-perception, effective problem-
solving abilities, autonomous decision-making, etc. in the
last two weeks.
Results are based on the sum scores across the seven items
in the scale. The maximum score is 35.
High (28+), Medium (21-27), and Low (0-20).
1 Bethell et al 2019
2 Tennant et al 2007
© Dr. Hasina Samji, 2021 PAGE 30IMPACTS OF COVID-19 In light of the COVID-19 pandemic, the YDI included an extra section asking youth about the impact of the pandemic and associated control measures on their physical and mental health, their relationships, and their quality of life. Giving youth the opportunity to identify areas where they are struggling during the pandemic enables us to take steps towards implementing the appropriate supports and resources. This section draws from questions on the BC Children’s Personal Impacts of COVID-19 survey, co-led by Dr. Evelyn Stewart and Dr. Hasina Samji. For more information about the Person Impacts of COVID-19 survey, visit https://www.bcchr.ca/POP/our-research/pics. PHYSICAL HEALTH The percentage of youth rating their physical health as ‘poor’ or ‘fair’ before COVID-19 compared to during COVID-19. MENTAL/EMOTIONAL HEALTH The percentage of youth rating their mental/emotional health as ‘poor’ or ‘fair’ before COVID-19 compared to during COVID-19. QUALITY OF LIFE The percentage of youth rating their quality of life as ‘poor’ or ‘fair’ before COVID-19 compared to during COVID-19. RELATIONSHIPS The percentage of youth rating their relationships as ‘poor’ or ‘fair’ before COVID-19 compared to during COVID-19. © Dr. Hasina Samji, 2021 PAGE 31
REFERENCES
INTRODUCTION

Dahl, R. E., Allen, N. B., Wilbrecht, L., & Suleiman, A. B. (2018). Importance of investing in adolescence
from a developmental science perspective. Nature, 554(7693), 441–450.
https://doi.org/10.1038/nature25770

Human Early Learning Partnership (HELP). (2021, April). Middle Years Instrument (MDI)
Quicksheet. https://www.discovermdi.ca/wp-content/uploads/2020/11/Quicksheets_combined.pdf

Ross, D.A., Hinton, R., Melles-Brewer, M., Engel, D., Zeck, W., Fagan, L., Herat, J., Phaladi, G., Imbago-
Jácome, D., Anyona, P., Sanchez, A., Damji, N., Terki, F., Baltag, V., Patton, G., Silverman, A., Fogstad, H.,
Banerjee, A., & Mohan, A. (2020). Adolescent Well-being: A Definition and Conceptual Framework.
Journal of Adolescent Health, 67, 472–476.
https://doi.org/10.1016/j.jadohealth.2020.06.042

Scales, P. C., Benson, P. L., Oesterle, S., Hill, K. G., Hawkins, J. D., & Pashak, T. J. (2016). The dimensions
of successful young adult development: A conceptual and measurement framework. Applied
Developmental Science, 20(3), 150–174. https://doi.org/10.1080/10888691.2015.1082429

Zarrett, N., & Eccles, J. (2006). The passage to adulthood: Challenges of late adolescence. New Directions
for Youth Development, 2006(111), 13–28. https://doi.org/10.1002/yd.179

SOCIAL AND EMOTIONAL DEVELOPMENT

Aviles, A.M., Anderson, T.R., & Davila, E.R. (2006). Child and Adolescent Social-Emotional Development
Within the Context of School. Child and Adolescent Mental Health, 11(1), 32–39.
https://doi.org/10.1111/j.1475-3588.2005.00365.x

Jones, D. E., Greenberg, M., & Crowley, M. (2015). Early Social-Emotional Functioning and Public Health:
The Relationship Between Kindergarten Social Competence and Future Wellness. American Journal of
Public Health, 105(11), 2283–2290. https://doi.org/10.2105/AJPH.2015.302630

Vinayak, S., & Judge, J. (2018). Resilience and empathy as predictors of psychological wellbeing among
adolescents. International Journal of Health Sciences and Research, 8(4), 192-200.

SOCIAL WELL-BEING

Gadermann, A., Guhn, M., Schonert-Reichl, K., Hymel, S., Thomson, K.C., & Hertzman, C. (2016). A
Population-Based Study of Children’s Well-Being and Health: The Relative Importance of Social
Relationships, Health-Related Activities, and Income. Journal of Happiness Studies, 17, 1847-1872.

© Dr. Hasina Samji, 2021                                                                   PAGE               32
Kingsbury, M., Clayborne, Z., Colman, I., & Kirkbride, J. B. (2020). The protective effect of neighbourhood
social cohesion on adolescent mental health following stressful life events. Psychological Medicine,
50(8), 1292-1299.

Madden, V., Domoney, J., Aumayer, K., Sethna, V., Iles, J., Hubbard, I., … Ramchandani, P. (2015).
Intergenerational transmission of parenting: Findings from a UK longitudinal study. European Journal of
Public Health, 25, 1030–1035. DOI:10.1093/eurpub/ckv093

LEARNING ENVIRONMENT AND ENGAGEMMENT

Centers for Disease Control and Prevention (2009). School Connectedness: Strategies for Increasing
Protective Factors Among Youth. Atlanta, GA: US Department of Health and Human Services.
https://www.cdc.gov/healthyyouth/protective/pdf/connectedness.pdf

Scales, P.C., Pekel, K., Sethi, J., Chamberlain, R., & Van Boekel, M. (2020). Academic Year Changes in
Student-Teacher Developmental Relationships and Their Linkage to Middle and High School Students’
Motivation: A Mixed Methods Study. Journal of Early Adolescence, 40(4), 499-536. DOI:
10.1177/0272431619858414

Wang, C., Berry, B., & Swearer, S.M. (2013). The Critical Role of School Climate in Effective Bullying
Prevention. Theory Into Practice, 52(4), 296-302. DOI: 10.1080/00405841.2013.829735

PHYSICAL AND MENTAL WELL-BEING

Beauchamp, M.R., Puterman, E., & Lubans, D.R. (2018). Physical Inactivity and Mental Health in Late
Adolescence. JAMA Psychiatry, 75(6), 543-544. DOI: 10.1001/jamapsychiatry.2018.0385

Chaput, J., Gray C.E., Poitras, V.J., Carson, V., Gruber, R., Olds, T., Weiss, S.K., Gorber, S.C., Kho, M.E.,
Sampson, M., Belanger, K., Eryuzlu, S., Callender, L., & Tremblay, M.S. (2016). Systematic review of the
relationships between sleep duration and health indicators in school-aged children and youth. Applied
Physiology, Nutrition, and Metabolism, 41, S266-S282. dx.doi.org/10.1139/apnm-2015-0627

Malla, A., Shah, J., Iyer, S., Boksa, P., Joober, R., Andersson, N., Lal, S., & Fuhrer, R. (2018). Youth Mental
Health Should be a Top Priority for Health Care in Canada. The Canadian Journal of Psychiatry, 63(4),
216-222. DOI: 10.1177/0706743718758968

NAVIGATING THE WORLD

Almroth, M. C., László, K. D., Kosidou, K., & Galanti, M. R. (2018). Association between adolescents’
academic aspirations and expectations and mental health: A one-year follow-up study. The European
journal of public health, 28(3), 504-509.

Metzger, A., Alvis, L. M., Oosterhoff, B., Babskie E., Syvertsen, A., & Wray-Lake, L. (2018). The
Intersection of Emotional and Sociocognitive Competencies with Civic Engagement in Middle Childhood
and Adolescence. Journal of Youth and Adolescence, 47(8), 1663–1683. https://doi.org/10.1007/s10964-
018-0842-5

© Dr. Hasina Samji, 2021                                                                  PAGE               33
Thoits, P. A., & Hewitt, L. N. (2001). Volunteer work and well-being. Journal of Health and Social
Behavior, 42, 115–131. DOI:10.2307/3090173

CROSS-CUTTING DOMAINS

Bethell, C., Jones, J., Gombojav, N., Linkenbach, J., & Sege, R. (2019). Positive Childhood Experiences and
Adult Mental and Relational Health in a Statewide Sample: Associations Across Adverse Childhood
Experiences Levels. JAMA Pediatrics, 173(11), e193007.
https://doi.org/10.1001/jamapediatrics.2019.3007

Tennant, R., Hiller, L., Fishwick, R., Platt, S., Joseph, S., Weich, S., Parkinson, J., Secker, J., & Stewart-
Brown, S. (2007). The Warwick-Edinburgh Mental Well-being Scale (WEMWBS): Development and UK
validation. Health and Quality of Life Outcomes, 5(1), 63. https://doi.org/10.1186/1477-7525-5-63

© Dr. Hasina Samji, 2021                                                                   PAGE                  34
You can also read