Segmental deep dives France Spain Brazil Global Markets - Gianpaolo Santorsola CEO - Spain - Schibsted

Page created by Terrence Hines
 
CONTINUE READING
Segmental deep dives France Spain Brazil Global Markets - Gianpaolo Santorsola CEO - Spain - Schibsted
Segmental deep dives
France
Spain
Brazil
Global Markets

                       Gianpaolo Santorsola
                           CEO – Spain
Segmental deep dives France Spain Brazil Global Markets - Gianpaolo Santorsola CEO - Spain - Schibsted
Significant opportunity from multi-vertical strategy in Adevinta’s second largest market

        40 years of market presence and strong customer relationships

        Biggest online classifieds business in Spain, growing rapidly at 20% revenue
        growth with 29% margin

        Multi-brand strategy with deep vertical positions – market leader in Jobs and
        Cars, with improving position in Real Estate

        Large potential of data with deep knowledge of users as source of competitive
        advantage

                                                              55
Segmental deep dives France Spain Brazil Global Markets - Gianpaolo Santorsola CEO - Spain - Schibsted
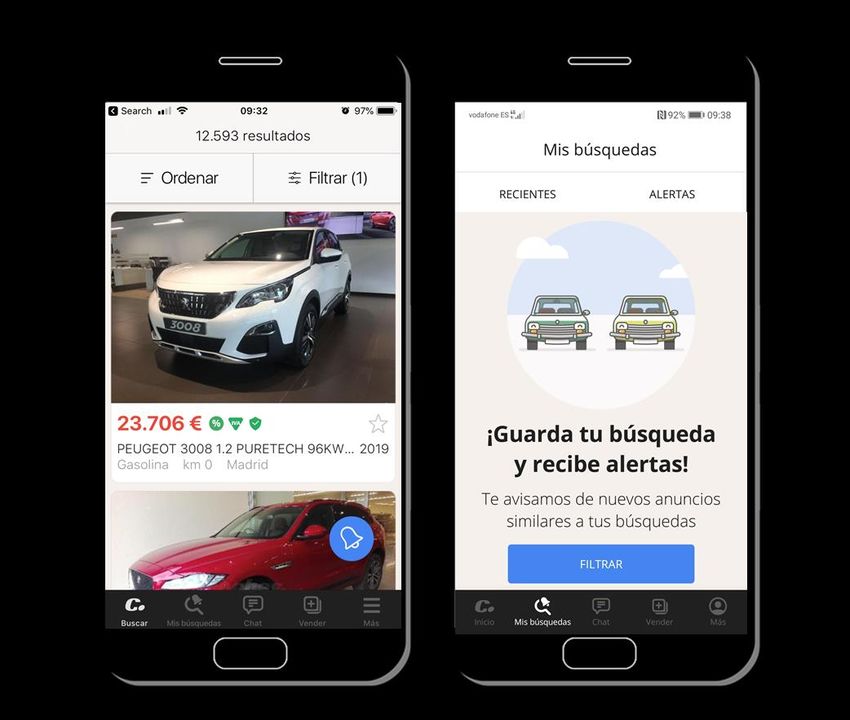
We have built a multi-brand presence in Spain through a series of M&A acquisitions

                       1982                        2004                 2008                        2013                       2017                     2019
         Foundation                      Merge between           Anuntis               Schibsted buys                     Schibsted              Upcoming1
          of Anuntis                       Anuntis and         closes its                     100% of                    Spain buys            unification of
          (Fotocasa,                     Segundamano               paper                  Anuntis: we                     Habitaclia                    most
      Coches, Motos,                                        business and                      become                          2017                 product &
      Segundamano)                                              becomes                     Schibsted                                            tech under
                                                             100% online                        Spain                                          same roof in
                                                                                                                                                new offices

                                 Pre-schibsted                                    Schibsted entry                         Consolidation                 Full ownership
                                 (1978 – 2005)                                     (2006 – 2013)                           (2014-2018)                      (2019+)

 1978                                     1998                  2006                       2009                   2014                          2019
 Foundation of                            Foundation of    Schibsted                Schibsted                Schibsted                    Schibsted
 Segundamano,                             Infojobs          buys 77%           secures control              Spain buys                     takes full
 monthly newspaper                                         of Anuntis              of Infojobs             Milanuncios                    ownership
 of free classified ads                                   and 72% of                    (+98%                                                     of
                                                             infojobs              ownership)                                             Schibsted
                                                                                                                                              Spain

Note: 1 Planned during H1 2019

                                                                                           56
Segmental deep dives France Spain Brazil Global Markets - Gianpaolo Santorsola CEO - Spain - Schibsted
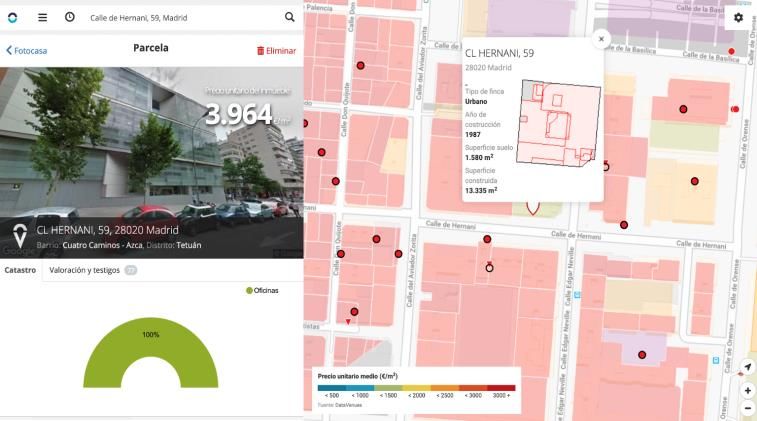
We have developed a portfolio of leading, complementary brands…
                                                                                                                                                                   Traffic                       Listings                    Customers
                                                                                                                                                                                    1                              2

                    Jobs                                                                                                                                                1                              1                             NA

                                                                                                                                                                                    1                              3                             3

                    Cars                                                                                                                                                1                              1                              1

                                                                                                                                                                                    4                              3                             3

              Real Estate                                                                                                                                                2                             1                              1

                                                                                                                                                                                    1                              5

               Generalist                                                                                                                                                2                             2                             NA

Source: 1 Ipsos: 2018 avg. Question "Which of the following online, mobile sites or apps have you visited in the past 6 months?" (or "offering jobs and employment opportunities" or "for second-hand cars / vehicles"). Sample avg. Jobs 759, Motor
505, Marketplaces 996 (answers “Amazon” considered n/a); 2 Company information based on various website hit counters; 3 Autobiz: 2018 avg.; 4 Insights by SimilarWeb (www.similarweb.com) – 2018 average. Desktop & Mobile web; 5 Company
information

                                                                                                                         57
Segmental deep dives France Spain Brazil Global Markets - Gianpaolo Santorsola CEO - Spain - Schibsted
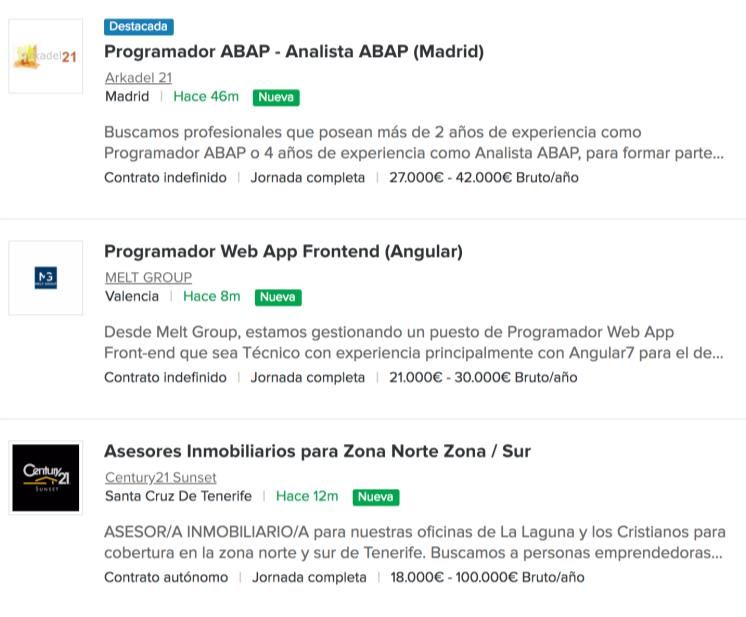
… leading to strong reach and recognition

                                                                                                                            Spain

                       Jobs                                                            Cars                                                     Real Estate                                                     Generalist

     ▪ Infojobs is the market leader                                 ▪ Coches.net is the vertical                                  ▪ Fotocasa is a leading player                                  ▪ Milanuncios is our main
       in jobs, with 52% usage1                                        market leader, with                                           with 20.2m monthly visits3                                      generalist site and is a
                                                                       15.5m monthly visits3                                                                                                         source of content and
     ▪ Enabled 1.5m contracts2 to                                      (~4x4 vs #2 vertical)                                       ▪ Complemented by Habitaclia                                      effectiveness for our real
       be signed in 2017                                                                                                             with 12.8m monthly visits3,                                     estate and car verticals
                                                                     ▪ Leading position reinforced                                   which has become the #3
                                                                       by Milanuncios - combined                                     vertical in Spain4                                            ▪ Vibbo further complements
                                                                       clear lead in usage, content                                                                                                  our generalist portfolio
                                                                       and dealers

                                                                           17m+ unique monthly visitors on average in 20185

Note: 1 Survey run by Ipsos – 2018 average. Question: “Which of the following online, mobile sites or apps offering jobs and employment opportunities have you visited in the past 6 months? (or in the past month?)” Sample avg. monthly 759
respondents; 2 TNS study – 2017 (2018 study not yet finalized) & SEPE; 3 Company’s current internal measuring; 4 Insights by SimilarWeb(www.similarweb.com) – 2018. Average monthly view. Desktop & Mobile web; 5 Comscore MMX Multi-
Platform, Total Audience, Average of Jan - Dec 2018, Spain

                                                                                                                       58
Segmental deep dives France Spain Brazil Global Markets - Gianpaolo Santorsola CEO - Spain - Schibsted
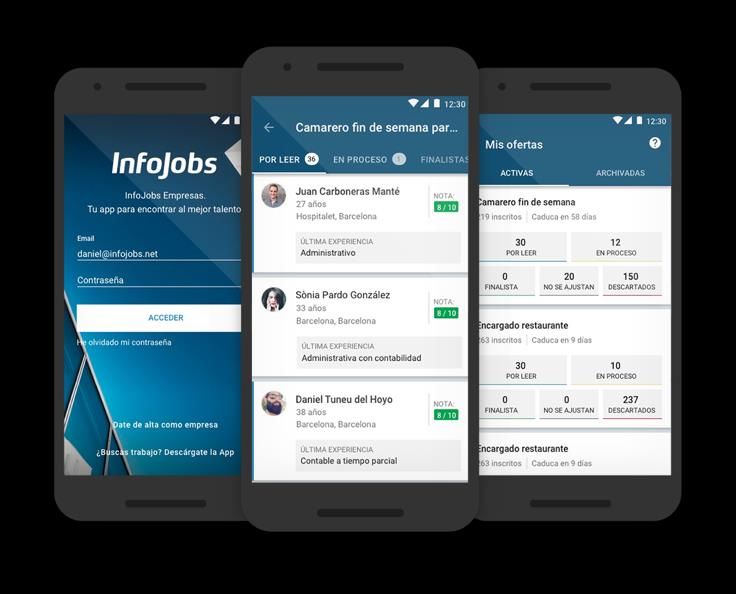
Over the past two years, we have doubled our EBITDA1 on the back of strong revenue growth and
improved operating leverage

Revenue (€m)1                                                                                                                EBITDA (€m)1, 3
                                                                                                                             EBITDA3
                                                                                                                                               21%                              25%        29%
                                                                                                                             margin:

                                                                                     160,0                                                                                                 47,1

                                                  137,7

                                                                                                                                                                                34,4
               110,8

                                                                                                                                               23,7

                                                          2                                                                                                                            2
                2016                              2017                               2018                                                      2016                             2017       2018

Note: 1 Based on Adevinta's operating segment information; 2 Jan 2017: acquisition of Habitaclia; 3 EBITDA (before other income and expenses, impairment, JVs and Associates)

                                                                                                                      59
Segmental deep dives France Spain Brazil Global Markets - Gianpaolo Santorsola CEO - Spain - Schibsted
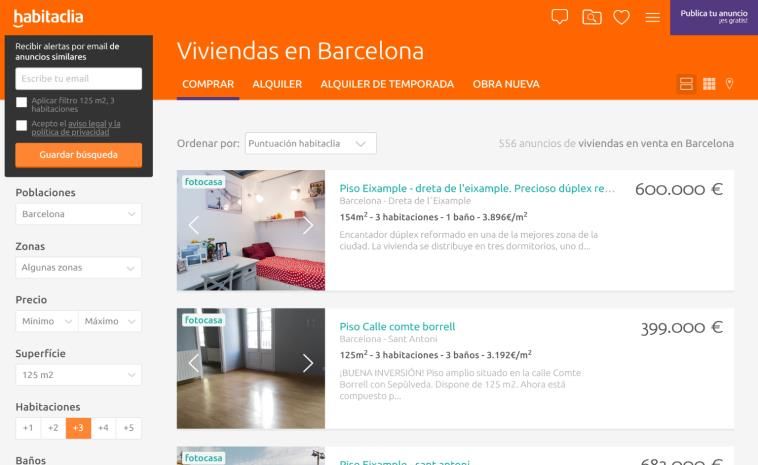
We will pursue further growth in Spain through a dedicated vertical strategy underpinned by a focus
on customers, talent and data

      Solidify leadership in                      Regain leadership on                       Reduce gap with competition in
         Jobs and Cars                                Real Estate                                     Generalist

                               Offering the greatest experience to our users and customers

                                   Attracting, developing and retaining the best talent

                                     Leveraging our data as a competitive advantage

                                                            60
Segmental deep dives France Spain Brazil Global Markets - Gianpaolo Santorsola CEO - Spain - Schibsted
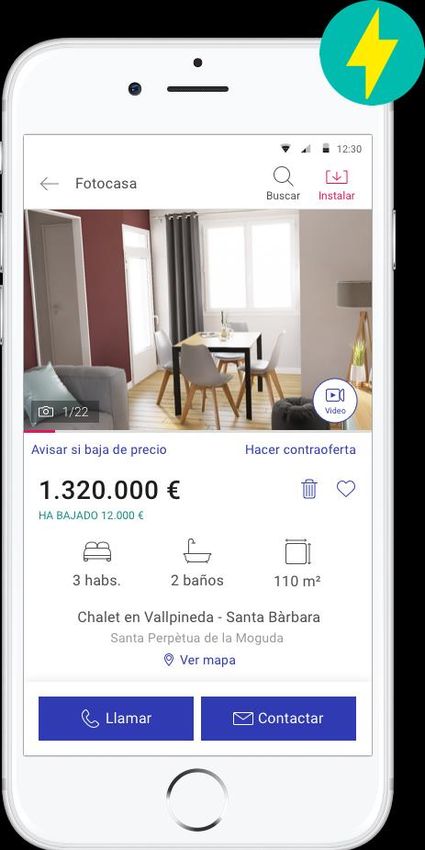
Jobs – Attractive opportunity in the Spanish Jobs market, with a very
strong foothold                                                                                                                                                                    Jobs

Unemployment rate in Spain1                                                                                            Recruitment agency and corporate marketing spend estimate (2017)2

 28%                                                              26%                                                                                                            Total marketing spend3
                                                          25%             24%                                                                                        (recruitment agency and corporate)
 26%
                                                                                  22%                                                                                                          c.€118m
 24%                                              21%
 22%                                      20%                                             20%
 20%                              18%                                                             17%
 18%                                                                                                      15%
 16%
 14%                    11%
 12%                                                                                                                           Online classifieds (incl. LinkedIn)
                   8%                                                                                                                                      c.€56m
 10%        8%
  8%
  6%
  4%
  2%
  0%
            2006

                    2007

                           2008

                                   2009

                                           2010

                                                   2011

                                                           2012

                                                                   2013

                                                                           2014

                                                                                   2015

                                                                                           2016

                                                                                                   2017

                                                                                                           2018

Source: 1 INE (EPA). Quarterly survey based on sample of ~200k people; 2 OC&C Strategy Consultants 2019
Note: 3 Excluding recruitment events

                                                                                                                  61
Segmental deep dives France Spain Brazil Global Markets - Gianpaolo Santorsola CEO - Spain - Schibsted
Infojobs is well positioned to capture the growing market opportunity                                                                                                                                                 Jobs

Traffic                                                                                                                         Liquidity

   1        Usage1 (2018)                                                                                                            1       % of users which have applied to any job offer2 (2017)

                                                                                                      1.4x                                                                                                                             1.3x

            #1 Social                                                                                                                       #2 Vertical
           Competitor                                                                                                                       Competitor

           #1 Vertical                                                                                                                       #1 Social
           Competitor                                                                                                                       Competitor

           #2 Vertical                                                                                                                      #1 Vertical
           Competitor                                                                                                                       Competitor

Note: 1 Survey run by Ipsos, proxy metric for Visitors in an aggregated 6 months period – 2018 average. Question: “Which of the following online, mobile sites or apps offering jobs and employment opportunities have you visited in the past 6
months? (or in the past month?)” Sample avg. monthly 759 respondents; 2 Survey run by TNS – 2017. One off study with 3,510 individuals

                                                                                                                         62
Segmental deep dives France Spain Brazil Global Markets - Gianpaolo Santorsola CEO - Spain - Schibsted
We have grown revenues by 38% over the past two years by improving our
offering and expanding our monetization base                                                                                                                                                                        Jobs

Revenue – Indexed to 1001                                                                                                     Customers – Indexed to 1002

                                                                                                                                                                                                       29%                 169
                                                                                             138
                                                                       14%                                                                                        31%                  131
                                                                                                                                                   100
                                                          121
                                    21%
                                                                                                                                                  2016                                2017                                2018

                        100                                                                                                               Increased monetization base in long tail3 through self-service
                                                                                                                                            channel, complemented by growth in remainder segments

                                                                                                                              ARPU – Indexed to 1001, 2                                                                             ~8% ARPU
                                                                                                                                                                                                                                   increase on
                                                                                                                                                                                                                                 2018, for existing
                                                                                                                                                                                                                                  customer base
                                                                                                                                                                    (9%)                                                           with > €500
                                                                                                                                                   100                                                (10%)
                                                                                                                                                                                                                                 annual spending
                                                                                                                                                                                        91                                           in 20174
                                                                                                                                                                                                                            82

                       2016                              2017                               2018                                                  2016                                2017                                2018
                                                                                                                                               Dilution due to long tail3 increase, nonetheless positive
         Main growth in core recruitment products, including CV database
                                                                                                                                                         ARPU growth in remainder segments
Note: 1 Company information ; 2 Related customer metric definition refers to those publishers which have purchased an Infojobs recruitment related paid product during the year (excl. non OLC advertising). These represented ~98% of revenue in
2018. Not factored-in revenue deferrals for ARPU displayed; 3 Customers with annual spend below €500; 4 Includes those customers which where acquired before Jan'17 and had sales during 2018

                                                                                                                       63
We are consistently improving products and value propositions to offer
great experiences to users & customers                                                                                                                                      Jobs

Enriched job posting info                                                       Screening app for recruiters                              Partnership with Stack Overflow

                                                                                                                                           900k+ monthly unique visitors in Spain1

 ◼    Improving UX and setting fundamentals for better                           ◼    Making it easier to manage candidate applications    ◼   Expanding Infojobs clients’ reach for tech talent
      data-driven matching

Source: 1 Insights by SimilarWeb (www.similarweb.com) – 2018 average. Desktop & Mobile web

                                                                                                           64
Cars – We are well positioned to capture a significant portion of a sizable
market through both generalist and dedicated vertical brands

Used & new car transactions (000’s)1                                                                                            Cars market size & marketing spending estimate (2017)2
       Used cars                      New cars                                                                                                  Total consumer3 used & new car transaction value (exc. OEM B2B sales, LCVs /
                                                                                                                                                motorbikes) c.€32bn of which: c.€7bn: private (C2C); c.€13bn: dealer – used;
2,500                                                                                                                                           c.€12bn: dealer – new

2,000

1,500

                                                                                                                                                                Dealer margin on car transactions
1,000                                                                                                                                                  (excl. financing / ancillary sales) c.€2.2bn

  500
                                                                                                                                       Total dealer & C2C used &
                                                                                                                                       new car marketing spend3
                                                                                                                                  Online classifieds4    c.€80m
     0
                                                                                                                                               c.€35m
            2006

                    2007

                            2008

                                    2009

                                            2010

                                                    2011

                                                            2012

                                                                    2013

                                                                             2014

                                                                                     2015

                                                                                             2016

                                                                                                     2017

                                                                                                             2018E
Source: 1 Ganvam. Used car sales preliminary figure for 2018; 2 OC&C Strategy Consultants 2019
Note: 3 Consumer includes used & new car transactions through dealers and between individuals, but excludes direct OEM sales into fleets; 4 Online classifieds are a particularly important marketing channel for used cars, which rely on it more
than other online / offline channels. Used car sales represent an estimated >90% of total online classified spend

                                                                                                                         65
We have leading positions in traffic, content and customers with a substantial lead
over our closest competitor

 Traffic                                                                              Content                                                                              Customers

    1     Usage1 (2018)                                                                  1     in monthly new ads2 (2018)                                                     1       in dealer share2, 3 (2018)

                                                                                                          4                                                                                        4

                                                      1.7x                                                                                     2.4x                                                                                      3.5x
  #1 Generalist                                                                           #1 Generalist                                                                                        4
  Competitor                                                                              Competitor

                                                                                                          4                                                                       #1 Vertical
                                                                                                                                                                                  Competitor

    #1 Vertical                                                                              #1 Vertical                                                                          #2 Vertical
    Competitor                                                                               Competitor                                                                           Competitor

Source: 1 Survey run by Ipsos, proxy metric for Visitors in an aggregated 6 months period – 2018 average. Question: “Which of the following online, mobile sites or apps for second-hand cars / vehicles have you visited in the past 6 months? ”
Sample avg. monthly 505 respondents Answers “Segundamano” considered n/a; 2 Autobiz – 2018 avg. Note: 3 Wallapop not included in chart being largely under-represented due to methodology (based on phone identification); 4 Certain overlap
exists among Milanuncios and Coches.net

                                                                                                                        66
We have grown revenues by 59% over the past two years through both customer
and ARPU growth
Revenue – Indexed to 1001                                                                                                     Customers – Indexed to 1002

                                                                                                                                                                                                     24%                 138
                                                                                             159                                                                   11%
                                                                                                                                                                                     111
                                                                                                                                                  100
                                                                       27%

                                                           125                                                                                   2016                               2017                                2018

                                    25%                                                                                                          Strengthened focus to attract long tail3 of customers,
                                                                                                                                                   complemented by growth in remainder segments
                        100
                                                                                                                              ARPU – Indexed to 1001, 2                                                                             ~25% ARPU
                                                                                                                                                                                                                                 increase on 2018,
                                                                                                                                                                                                                                     for existing
                                                                                                                                                                                                                                   customer base
                                                                                                                                                                                                       5%                           with > €100
                                                                                                                                                                 11%                 111                                 117     monthly spending
                                                                                                                                                                                                                                       in 20174
                                                                                                                                                  100

                       2016                               2017                              2018                                                 2016                                2017                               2018
             Strong marketplace traction overall, success of Milanuncios                                                                      ARPU optimization of existing customers compensating
                        bundling & optimized categorization                                                                                         erosion due to steep long tail3 expansion
Note: 1 Company information. Includes all motor categories; 2 Monthly average. Related customer metric definition refers to those publishers which have purchased a recurrent related paid product (excl. non OLC advertising & web channels).
These represented ~84% of revenue in 2018. ARPU growth ~0.6% implicit deviation due to KPI definitions; 3 Customers with monthly spending < €100; 4 Includes those customers which where acquired before Jan'17 and did not churn during
2018

                                                                                                                       67
We are continuously working to improve UX and deliver innovative features such as
vehicle history reports and chat messaging

Excellent mobile experience                                                           Chat for user communication                                                            Vehicle history reports3

         iOS App Rating1           Android App Rating1

◼ Highly rated apps                                                                   ◼ More natural conversation with chat                                                  ◼ Improving trust with integrated vehicle
◼ 75%+ of traffic already in mobile2                                                      functionality for users                                                                history reports
                                                                                      ◼ Product developed centrally

Note: 1 App rating coming from digital stores as per Feb’19; 2 Mobile traffic is aggregation of traffic from mobile web and from apps (Metric visits); 3 Carfax screenshot taken from Coches.net desktop website, Feb’19

                                                                                                                         68
Real Estate – improving market fundamentals with further opportunity for expansion

Favourable structural trends                                                                                                 Real estate commissions pool & marketing spend estimate (2017)2
         Value houses sold (excl social)1
                                                                                                                                                                                                    Residential property transaction value
         # Houses sold (all)1
                                                                                                                                                                                                    (new & used, rental) c.€89bn

   (000’s)                                                                                                  (€bn)
                                                                                                                                                                     Residential property transaction value (used, rental)
1,000                                                                                                        160                                                     c.€79bn

  900                                                                                                        140
  800
                                                                                                             120
  700
  600                                                                                                        100

  500                                                                                                        80
                                                                                                                                 Real estate agent commission on residential sales &
  400                                                                                                        60                                                    rentals c.€2.5bn

  300
                                                                                                             40                      Estate agent, developer & C2C
  200                                                                                                                                    marketing spend c.€144m
  100                                                                                                        20
                                                                                                                               Online classifieds
                                                                                                                               (Residential)3
     0                                                                                                       0
                                                                                                                               c.€103m
            2006

                   2007

                          2008

                                  2009

                                         2010

                                                2011

                                                        2012

                                                               2013

                                                                      2014

                                                                              2015

                                                                                     2016

                                                                                            2017

                                                                                                    2018E

Source: 1 Ministerio de Fomento. 2018 estimated by projecting growth Q1-Q3; 2 OC&C Strategy Consultants 2019, 1 year rental value considered for transaction value
Note: 3 Excludes estimation of online classified spend on commercial property, garages and storage

                                                                                                                      69
Despite a tough competitive landscape, we are well positioned with our two key
verticals complemented by a strong generalist marketplace

 Traffic                                                                          Content                                               Customers
   2                                                                                 1    in monthly new ads2 (2018)                       1
         in visits1 (2018)                                                                                                                     in agents share2 (2018)

 #1 Vertical                                                                                                3                                                3
 competitor

                                                      1.9x                                                                       1.1x                                    1.1x

                                                                                              #1 Vertical                                         #1 Vertical
                                                                                              competitor                                          Competitor

                                                                                                                                                             3
                                                                                                            3

 #2 Vertical                                                                         #6 Vertical                                           #6 Vertical
 competitor                                                                       Competitor (in traffic)                               Competitor (in traffic)

Source: 1 Insights by SimilarWeb(www.similarweb.com) – 2018. Average monthly view. Desktop & Mobile web; 2 Autobiz – 2018 avg.
Note: 3 Partial overlap exists among Milanuncios and Fotocasa, content & customers

                                                                                                                   70
Over the past two years, we have grown revenues by more than 50%, following
Habitaclia’s acquisition in 2017
Revenue – Indexed to 1001                                                                                                     Customers – Indexed to 100 (separately for each vertical site)3
                                                                                                                                                 Fotocasa             Habitaclia (n/a for 2016)

                                                                                                                                                          12%                              9%
                                                                                                                                                                          112                            122
                                                                                                                                           100
                                                                           14%                154

                                                                                                                                                                                                                                        +15%
                                                           135
                                                                                                                                                                                       2
                                                                                                                                                 2016                           2017                           2018
                                     35%
                                                                                                                                                  Focus on continued customer expansion & crossed
                                                                                                                                                             synergies among verticals
                         100
                                                                                                                              ARPU – Indexed to 1001, 3
                                                                                                                                                                                                  4
                                                                                                                                                 Fotocasa             Habitaclia (n/a for 2016)
                                                                                                                                                        (5%)                               3%                                               +3%
                                                                                                                                                                                                                                            +3%

                                                                   2                                                                                                                   2
                        2016                              2017                               2018                                                2016                           2017                           2018

             Steady & balanced growth in 2018. Habitaclia incorporation                                                                         Revenue growth also supported by moderate net ARPU
                          fuelled very high growth for 2017                                                                                       increase, following higher focus in share of 2017
Note: 1 Company information; 2 Habitaclia acquisition in Jan’17; 3 Monthly average – related customer metric definition refers to those publishers which have purchased a recurrent related paid product (excl. non OLC advertising & web
channels). These represented ~96% of revenue in 2018. ARPU growth ~0.3% implicit deviation due to KPI definitions; 4 Habitaclia customer metric for 2016 not available with comparable definition.

                                                                                                                        71
We are utilising data across our sites to help our users on their journey

Big Data Valuation product -Data venues-    Launching Google Android Instant App         Content Aggregation system

◼ New tool developed to support agencies    ◼ Advanced technology which improves         ◼ Cross sharing content in a way similar
  managing valuation of their stock           experience in mobile web, with promising     to aggregators, fostering cross traffic
◼ Data-driven product providing ancillary     initial results seen in conversion           among verticals
  revenue streams                                                                        ◼ Started in Habitaclia and is being tested
                                                                                           in Fotocasa

                                                                   72
Our marketplaces collect a large amount of data, which, if combined, could allow us to extract
additional value in the future
                                                                                                                                     … which could be leveraged
                                                                                                                                     through product development
We capture a large amount of data1 …                                                                                                 in several dimensions

 Private users                                            Family                        Online usage
               Demographics                               ▪ Family size                 ▪ Geolocation
               ▪ Age and gender                           ▪ Pets                        ▪ Routines & engagement
               ▪ Nationality                                                            ▪ Device related data
                                                                                                                                      ▪ Anticipate needs
    Interests                                                                                  Purchase & sales
    ▪ Hobbies                                                                                  ▪ Purchase intent & history
                                                                                                                                      ▪ Customize daily usage
                       Profile                                                                 ▪ Selling intent & history
                       ▪ Education                                                             ▪ Status in purchase journeys
                                                                                                                                      ▪ Provide relevant advertising
                       ▪ Professional activity                                     Relationships
                       ▪ Income range                                              ▪ Professional network
                                                                                                                                      ▪ Support publishers in their
                       ▪ Languages                                                 ▪ Personal network
                                                                                                                                        professional activity

 Professionals                                                                                                                        ▪ Deliver mass media relevant insights on
                                                                                                                                        markets evolution
        Profile                                Marketing profile                     Offer                    Behaviors
        ▪ Sector                               ▪ Marketing budget                    ▪ Ads published &        ▪ Quality of service
        ▪ Business size                        ▪ Product usage                         history                ▪ Routines and
        ▪ Growth pattern                       ▪ Tenure in sites                     ▪ Stock price              engagement
                                                                                     ▪ Turnover time

Note: 1 Conditioned to user providing appropriate authorizations, as required by applicable regulations

                                                                                                             73
Significant opportunity from multi-vertical strategy in Adevinta’s second largest market

                                   40 years of market presence and strong customer relationships

                                   Biggest online classifieds business in Spain, growing rapidly at 20% revenue
                                   growth with 29% margin

                                   Multi-brand strategy with deep vertical positions – market leader in Jobs and
                                   Cars, with improving position in Real Estate

                                   Large potential of data with deep knowledge of users as source of competitive
                                   advantage

                                                      74
You can also read