Seismic Performance of Buried Electricity Cables during the Canterbury Earthquake Sequence
←
→
Page content transcription
If your browser does not render page correctly, please read the page content below
Australian Earthquake Engineering Society 2016 Conference, Nov 25-27, Melbourne, Vic

     Seismic Performance of Buried Electricity Cables
       during the Canterbury Earthquake Sequence
        Sheng-Lin Lin1, Mostafa Nayyerloo2 and ZhaoXuan(Hins) Zhang3

1.    Corresponding Author. Risk Engineer, GNS Science, Wellington, New Zealand
      Email: s.lin@gns.cri.nz

2.    Risk Engineer, GNS Science, Wellington, New Zealand
      Email: m.nayyerloo@gns.cri.nz

3.    GIS Engineer, CPB HEB Joint Venture, Wellington, New Zealand
      Email: hins.zhang@tg.co.nz

                                     Abstract
The 2010-2011 Canterbury earthquake sequence, which generated significant ground
shaking in Christchurch, New Zealand, caused building damage, human losses, and
resulted in widespread damage to the city’s infrastructure, including disruption to the
buried electricity cables. This paper first describes the impact of the Canterbury
earthquakes on the buried cables by briefly summarising their performance during the
earthquakes, including the damage resulted from both ground shaking and land
damage (i.e. liquefaction and lateral spreading). To increase the knowledge of the
damage suffered by the buried electricity cables within the Greater Christchurch area,
a GIS database of damage, geotechnical data, ground shaking and land damage
information was created.

Next, preliminary lessons after carefully examining the GIS database are discussed.
Special focus is given to quantitative assessment of the seismic performance of the
buried cables. Fragility models, which present the relation between shaking intensity
and the probability of reaching or exceeding a certain level of damage in the network,
are derived using the available damage data along with the shaking and land damage
information. The procedure to derive the fragility models is illustrated in detail
followed by discussions in the light of the observed performance of the buried cables
network in Christchurch. The results contribute to enhance the understanding of the
seismic performance of buried electricity cables and therefore to minimise disruption
and increase the resilience of communities after a seismic event.

Keywords: Canterbury earthquake sequence, buried electricity cables, liquefaction,
damage index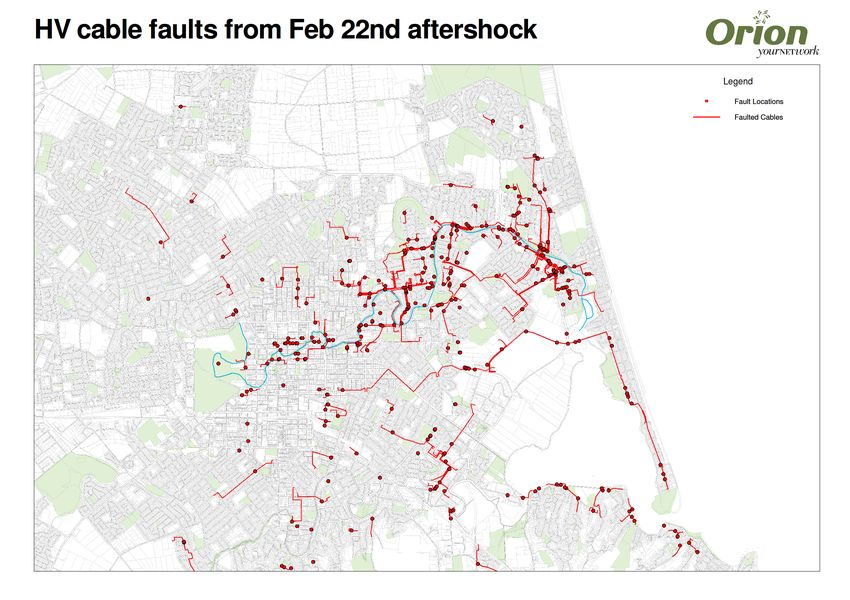
Australian Earthquake Engineering Society 2016 Conference, Nov 25-27, Melbourne, Vic

1 INTRODUCTION

The Canterbury 2010-2011 Earthquake Sequence (CES) was very damaging to
electricity network in Christchurch, causing widespread interruptions in service. Some
outage even lasted until early March (Kwasinski et al., 2014), which led to huge
economic loss to Orion, the local electricity distribution company (Orion, 2012).

In general, the above-ground electricity equipment performed well during the CES.
Damage to high voltage equipment was relatively minor due to the well-installed
equipment and low exposure number of substations to high ground shaking level
(only one substation was exposed to peak ground acceleration (PGA) much over 0.5g)
(Kwasinski et al., 2014). However, significant damage to underground buried cables
was reported. For example, considerable faults of 66 kV buried cables in urban
Christchurch were observed with most of the faults being in the area with intense
liquefaction (Eidinger & Tang, 2012, Giovinazzi et al., 2011). Assessment of the 11
kV cables seismic performance during the September 2010 and February 2011 events
also indicates that the main reason of the cable faults was liquefaction and lateral
spreading, but some cable faults were also observed in areas without land damage.
This suggests that cables are susceptible to damage caused by both ground shaking
and ground deformation (Kongar et al., 2014).

This paper presents the results from studies on how the buried electricity cables in
Christchurch performed during the CES, focusing on the most damaging aftershock of
February 2011. The performance has been studied for the main voltage levels (i.e. 400
V, 11 kV and 66 kV) present in the Christchurch electricity networks, and is described
through fragility models which are functions of both shaking intensity and ground
conditions. Brief information on the events and the electricity networks affected are
provided in the following sections, followed by a description of the data and
methodologies used to derive the fragility models. Finally, the results are presented
and discussed.

2 CANTERBURY EARTHQUAKE SEQUENCE

On 22nd February, 2011, Christchurch City experienced a direct hit from a destructive
magnitude (Mw) 6.2 aftershock following the main event of magnitude 7.1 on the 4th
September, 2010. The February event was followed by another destructive aftershock
of magnitude 6.4 in June and later by a magnitude 6.0 aftershock in December. There
were also numerous aftershocks of smaller magnitudes in between and after these
main events. The February event caused severe shaking and widespread liquefaction
in Christchurch, which caused significant damage to Christchurch’s underground
cables. Liquefaction caused failure of cables due to uneven settlement, uplift of
cables, pull-outs of joints etc. The liquefaction was widespread but most severe in the
suburb of Bexley and along the Avon River (Cubrinovski et al., 2013).

2.1 Shaking intensity

The shaking intensities in Modified Mercalli Intesity (MMI), for the February event
were estimated using ShakeMapNZ, which is the modified version of the US
ShakeMap for New Zealand. For estimating intensities, ShakeMapNZ uses the model
of Allen et al. (2012) which includes macro-seismic intensity data from around the
globe as well as from over 100 New Zealand events. For the February event, the inter-
event uncertainty in the intensity prediction equation was removed by converting all
Australian Earthquake Engineering Society 2016 Conference, Nov 25-27, Melbourne, Vic

observed instrumental ground motions on 25 GeoNet (www.geonet.org.nz) strong
motion recording stations around Christchurch, into macro-seismic intensity using the
Ground Motion to Intensity Conversion Equation (GMICE) of Worden et al (2012).
More details of the methods used in ShakeMapNZ can be found in Horspool et al.
(2015).

2.2 Liquefaction

Extensive liquefaction is believed to be the main cause of substantial damage to
Christchurch buried electricity cables (Eidinger & Tang, 2012, Kongar et al., 2014).
The liquefaction severity maps used in this study were produced by Tonkin and
Taylor Ltd (Van Ballegooy & Malan, 2013) using information collected from drive-
by surveys, where evidence from liquefaction was mapped, taking into account visible
lateral spreading, sand boil deposits, and land damage etc. Liquefaction was divided
into 6 classes (Table 1) depending on the severity of the manifestation:

In this paper the extent of liquefaction, and its implications will be discussed along
with its effects on the seismic performance of buried electrical cables in Christchurch
aiming to understand what occurred in Christchurch and the lessons we can gain from
studying the performance of the Christchurch underground buried cables during the
CES. It is noted that due to the small area of some of the land deformation zones and
the limited length of cables and number of faults in some of them, the original 6
liquefaction classes had to be consolidated into three broader categories, namely “No
land damage”, “Liquefaction damage”, and “Lateral spreading”, as shown in Table 1
to enable quantitative analysis of the performance

Table 1. Mapping between land damage categories used in this paper and those in Van Ballegoory &
Malan (2013)
         Land damage category                             Land deformation class
            (present study)                          (Van Ballegooy & Malan, 2013)
                                          • No observed land damage
            No land damage
                                          • Minor land damage but no observed liquefaction
                                          • Moderate liquefaction but no lateral spreading
              Liquefaction
                                          • Severe liquefaction but no lateral spreading
                                          • Moderate to major lateral spreading
            Lateral spreading
                                          • Severe lateral spreading

3 OVERVIEW OF NETWORK

Transpower and Orion are the companies which service the electric power in central
Christchurch. Transpower operates the high voltage (e.g. 220 kV and 66 kV) national
transmission system, while Orion operates voltages of 66 kV, 11 kV within sub-
transmission system and 400 V to final customers. Table 2 lists the length and
material information of Orion’s buried cables (Orion, 2009). Note that in the
subsequent sections of this paper, EHV (extra high voltage), HV (high voltage) and
LV (low voltage) are used to represent 66 kV, 11 kV and 400 V voltage levels,
respectively.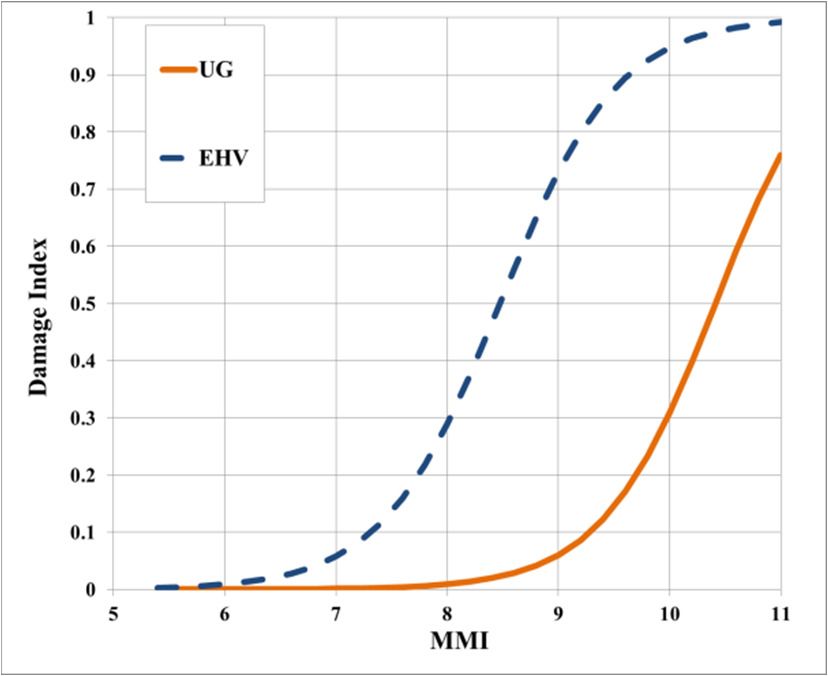
Australian Earthquake Engineering Society 2016 Conference, Nov 25-27, Melbourne, Vic

Table 2. Length and materials of Orion’s buried cables (Orion, 2009)
               Cable Type & Code           Length (km)          Insulation Materials
                                                           • XLPE (7 km)
                  66 kV (EHV)                     64
                                                           • Oil-filled (57 km)
                                                           • XLPE (601 km)
                   11 kV (HV)                    2157      • PILCA (57 km)
                                                           (remainder unknown)
                                                           • XLPE (1353 km)
                   400 V (LV)                    2470      • PVC (427 km)
                                                           (remainder unknown)
Key: XLPE (cross linked polyethylene), PILCA (paper insulated lead cable armour), and PVC (Polyvinyl
Chloride)

As mentioned previously, significant failure occurred to buried cables during the
February earthquake, in particular for cables located in the liquefaction areas. A
complete investigation of the buried cables’ behaviour under both shaking and land
deformation requires detailed information on the buried network in Geographic
Information System (GIS) format, which was not available. However, approximate
locations of faults on Orion’s buried cables during the CES were available in GIS
format and were used to derive the fragility models. Limited unverified location
information was also available in GIS format on two buried cables networks namely
underground buried cables (UG, including both 400 V and 11 kV) and EHV (66 kV
cables). These network GIS layers were extracted from some old Orion’s archives.
The layers were checked against the Orion WebMap portal, which is Orion’s current
network map in high resolution PDF (Orion, 2014) and deemed to be adequate for the
level of analysis intended in this paper. Unfortunately, the voltage level, material type
and other cable attributes were not identified in the UG layer. Although these
attributes were all available in WebMap, extracting the necessary attributes and
assigning them back to the same cable in the GIS layer was quite time-consuming and
could not be completed within the timeframe of this study.

Despite the above limitation of the data, in this paper the performance of UG and
EHV cables is investigated to the extent possible, and is described through fragility
models which are functions of both shaking intensity and ground conditions.
Methodologies used to derive the fragility models are discussed below, followed by
discussions on the results.

4 METHODOLOGY

In this study, the segment centroid is used to represent the cable location. Each
segment is then assigned a shaking intensity in MMI by geospatially joining the cable
centroid locations with the event MMI map. Observed liquefaction severity categories
were also assigned in a similar way by spatially joining the centroid locations with the
observed liquefaction severity maps from Tonkin and Taylor.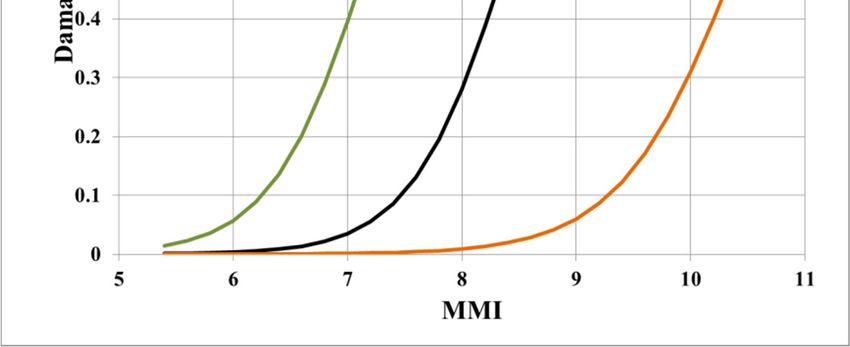
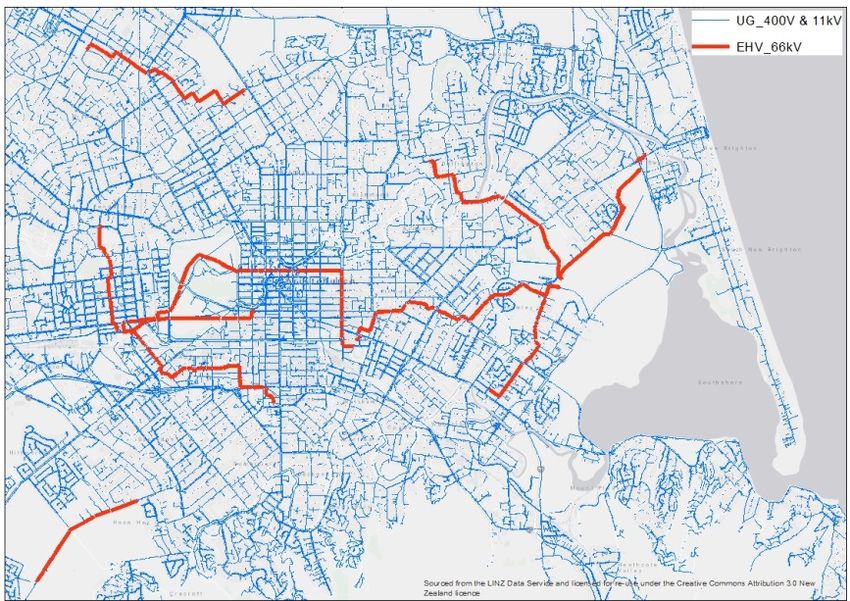
Australian Earthquake Engineering Society 2016 Conference, Nov 25-27, Melbourne, Vic

Figure 1. Orion buried cables network

4.1 Damage data

A map of a total of 1204 observed faults of HV (i.e. 11 kV) cables were supplied by
Orion (Orion 2013) (Fig. 2). It is noted that the supplied map only contained fault
locations, no descriptions or records of which event caused the faults. It is also noted
that Orion had implemented a variety of seismic mitigation measures, in combination
with the relatively modest levels of ground shaking, resulted in relatively excellent
performance (Eidinger &Tang, 2012). For example, the rapid restoration in the
September event suggests that damage was relatively minor and that almost all buried
cables and power distribution substations were unaffected (Kwasinski et al., 2014). It
was estimated that the September event damage affected about 4% of the 11 kV
buried cables, causing about 30 faults (Kwasinski et al., 2014; Kestrel Group, 2011).
In other words, the faults caused by the September event counted for only 2.5% of the
total faults in the dataset (30 out of 1204). Therefore in the present study, it was
assumed that all of the cable faults were caused by the February event.

Figure 2. fault locations of HV (i.e.11 kV) cables during the February earthquake
Australian Earthquake Engineering Society 2016 Conference, Nov 25-27, Melbourne, Vic
In terms of damage to EHV (i.e. 66 kV) cables network during the February
earthquake, it was reported that 50% (30 km out of the total of 64 km) of cables were
affected (Eidinger, 2012, Giovinazzi et al., 2009). For example, the cables in the
major liquefaction areas (e.g. Dallington and Brighton) were abandoned due to its
uneconomic repair. In addition, six faults were identified and repaired in the moderate
liquefaction areas (e.g. Armagh and Lancaster).
4.2 Fragility model for buried electrical cable
Following the approach presented in Park et al. (2006) to evaluate the seismic
performance of underground cables, Damage Index, DI, as defined in Equation 1, was
used to describe the Christchurch underground cables seismic performance in the
present study.
Damage Index = DI = (1)
Given the buried cables network overlaid with the MMI contours and the liquefaction
map, the lengths of the damaged cables and total cables in each MMI contour and
liquefaction class were tabulated and used to calculate DIs.
With the above calculated DIs, Logistic regression model (Hosmer and Lemeshow,
2000) was used to determine the fragility models of buried cables. The form of the
logistic regression model and its logit transformation are shown in Equations (2) and
(3).
$ %& '%( ))*
(!!") = (2)
+,$ %& '%( ))*
0(112)
-(!!") = ln /+30(112)4 = 56 + 5+ !!" (3)
5 RESULTS AND DISCUSSION
5.1 Results
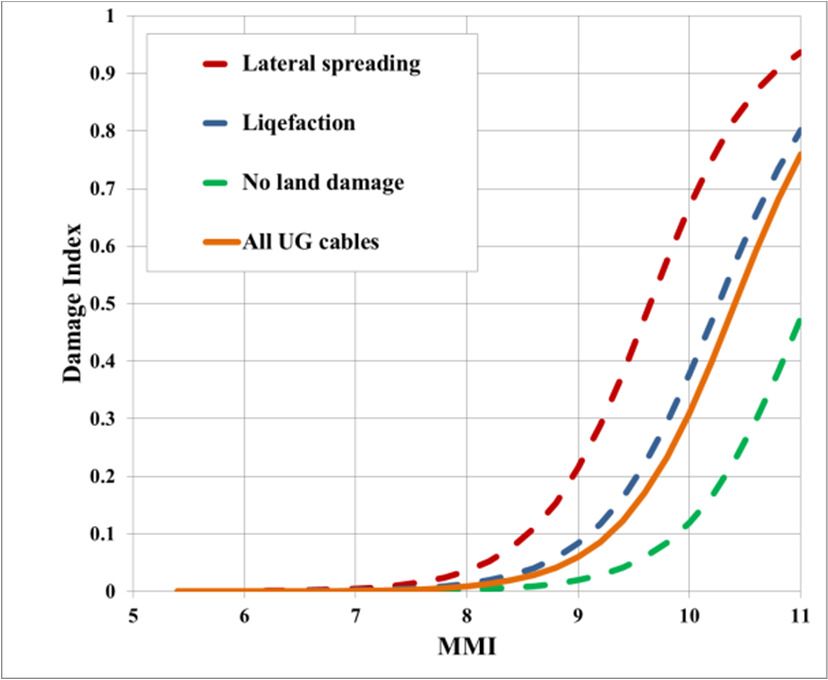
The logit model parameters for the UG cables damage indices are listed in Table 3 for
different liquefaction severities. The same models are also shown as curves in Figure
3a. As Table 3 and Figure 3a show, overall, the cables in no observed land damage
areas showed more robust seismic behaviour, followed by cables in liquefied areas.
As expected, cables in lateral spreading areas were most affected. When comparing
fragility model of cables with various voltage levels, UG cables performed better than
EHV cables, as shown in Figure 3b.
Table 3. Derived damage index model parameters for 400V and 11kV underground cables in different
land deformation zones
Christchurch Feb 2011 EQ parameters 89 8:
All cables -19.75 1.95
Cables w/o land damage -20.5 1.9
Cables w. Liquefaction damage -19 1.9
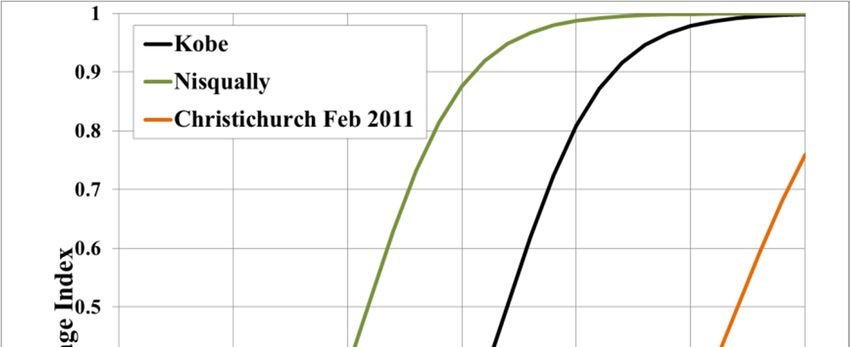
Cables w. Lateral spreading -18.5 2Australian Earthquake Engineering Society 2016 Conference, Nov 25-27, Melbourne, Vic (a) (b) Figure 3. The derived damage index curves for (a) UG cables in different ground deformation categories, and (b) UG and EHV cables given MMI values for February earthquake 5.2 Comparison with global damage data To evaluate the derived fragility models, the derived curves were compared with those presented in Park et al. (2006) from 2001 Nisqually (Washington, US) and 1995 Kobe (Japan) earthquakes, as shown in Figure 4. Figure 4. Comparison of derived damage index curves for underground cables with damage data in Nisqually and Kobe earthquakes 5.3 Discussion The effect of liquefaction in Christchurch was both horizontally and vertically non uniform, with large changes in severity even inside the same liquefaction severity class (Cubrinovski et al., 2013). Not only did the buried electrical cables experienced high changes in liquefaction observable at the surface, it experienced additional subsurface liquefaction at higher severities and variability, than the liquefaction map suggests (Cubrinovski et al., 2013). This sporadic nature of liquefaction might have a large influence on the overall damage index curves derived and should be taken into account when the results are used.
Australian Earthquake Engineering Society 2016 Conference, Nov 25-27, Melbourne, Vic

The discrepancy when comparing with other global damage data might result from
various reasons, some of which are discussed here.

• Different definitions of affected network length (affected feeder length vs. cable
   faults)
In Park et al. study, the feeder network included all systems operating at 26 kV
originating from distribution substations to the customer meter. The above system
included poles, overhead lines and underground cables, transformers, etc. While only
11 kV and 400 V underground cables were considered in the comparison. Since the
electricity network in Christchurch comprises both overhead lines and underground
cables including high voltage buried cables, which are all also vulnerable to ground
shaking and deformation, the total damage index might be higher. Therefore, the
derived fragility models will need to be investigated further when more data become
available either from the CES or future events.

• Differences in MMIs (Instrumental MMI vs. ShakeMap NZ MMI)
The instrumental MMI values which were used in Park et al. study were based on the
relationship between peak ground acceleration (PGA), peak ground velocity (PGV)
and Modified Mercalli intensity, details of which can be found in Wald et al. (1999).
It is noted that the above calculation was also used to generate USGS ShakeMap.
Although ShakeMapNZ is an implementation of ShakeMap for New Zealand, it
incorporated New Zealand specific ground motion prediction equations (GMPEs), a
New Zealand Vs30 model, and is optimised for the GeoNet instrumentation records.
Therefore, the MMI values from ShakeMap NZ might be different from those from
ShakeMap, although its influence might not be significant.

6 CONCLUSIONS

This paper combined the invaluable damage data from the Canterbury Earthquake
Sequence on the Christchurch buried electricity cables with the shaking and ground
deformation information to propose Modified Mercalli Intensity (MMI)-based
network damage index models for buried electricity cables networks when subjected
to earthquake shaking, including the influence of liquefaction. The fragility models
proposed are based on damage data that were analysed systematically to ensure the
true performance of cables is captured. As with most empirical fragility models, the
proposed models are not well-supported by data, and since they are based on the
Modified Mercalli Intensity, inherit the subjective-ness of the macro-seismic scale.
Work is currently underway to develop fragility models which are based on
engineering demand parameters to address this issue.

7 ACKNOWLEDGEMENTS

The funding provided by the New Zealand Ministry of Business, Innovation and
Employment (MBIE) that enabled this research is gratefully acknowledged. Many
individuals and industry bodies have contributed to the work discussed in this paper,
but the supports of Orion and Opus Research have been particularly valuable.

REFERENCES

Allen, T.A., Wald, D.J. & Worden, C.B. (2012) Intensity attenuation for active crustal
regions, Journal of Seismology, 16:409–433. DOI 10.1007/s10950-012-9278-7
Australian Earthquake Engineering Society 2016 Conference, Nov 25-27, Melbourne, Vic

Cubrinovski, M., Hughes, M. & O'Rourke, T. D. (2013) Impacts of Liquefaction on
the potable water system of Christchurch in the 2010-2011 Canterbury (NZ)
earthquakes, Journal of Water Supply: Research and Technology-Aqua, 63(2):95-
105.

Eidinger, J.M. (2012). “Performance of buried high voltage power cables due to
liquefaction”, Proceedings of the International Symposium on Engineering Lessons
from the 2011 Great East Japan Earthquake, Tokyo, Japan, 1-4 March.

Eidinger J. and Tang A.K. (2012) Christchurch, New Zealand Earthquake Sequence,
MW 7.1 September 04, 2010, MW 6.3 February 22, 2011, MW 6.0 June 13, 2011,
Lifelines Performance, Technical Council on Lifeline Earthquake Engineering,
ASCE, Reston, Virginia

Giovinazzi, S., Wilson, T., David C., Bristow D, Gallagher M., Schofield, A,
Villemure, M, Eidinger J, Tang, A. (2011), Lifeline performance and management
following the 22 February 2011 Christchurch earthquake, New Zealand: Highlights of
Resilience, Bulletin of the New Zealand Society for Earthquake Engineering, 44(4):
402-417.

Horspool NA, Chadwick M, Ristau J, Salichon J and Gerstenberger MC (2015)
ShakeMapNZ: Informing Post-event Decision Making, Proceedings of the NZSEE
Annual Technical Conference & AGM, Rotorua, New Zealand, 10-12 April, 2015.

Hosmer, D.W., Lemeshow, S. (2000) Applied Logistic Regression, Wiley Series in
Probability and Statistics, 2nd Edition, John Wiley & Sons, Inc., New York, NY, 375
pp.

Kestrel Group Ltd. (2011). Resilience Lessons: Orion’s 2010 and 2011 Earthquake
Experience, Kestrel Group Ltd. Wellington, New Zealand

Kongar, I., Rossetto, T., Giovinazzi, S. (2014) Seismic fragility of underground
electrical cables in the 2010-11 Canterbury (NZ) earthquakes, Proceedings of the
Second European Conference on Earthquake Engineering and Seismology, Istanbul,
Turkey, 25-29 August.

Kwasinski, A., Eidinger, J., Tang, A., Tudo-Bormarel, C. (2014) Performance of
electric power systems in the 2010-2011 Christchurch, New Zealand, earthquake
sequence, Earthquake Spectra, Supplement to Volume 30, February 2014, 205-240p.

Orion AMP (2009). Asset Management Plan: a 10-year management plan for Orion’s
electricity network, from 1 April 2009 to 31 March 2019. Available at
http://www.oriongroup.co.nz/publications-and-disclosures/asset-management-
plan.aspx [last accessed 11 August 2016].

Orion (2012) Summary of Orion’s proposed electricity network reliability and prices,
Orion New Zealand Limited, Christchurch, New Zealand

Orion (2013) HV cable faults from Feb 22nd aftershock, Orion New Zealand Limited,
Christchurch, New Zealand

Orion (2014) Orion Electric Utility Network, Orion WebMap, Orion New Zealand
Limited,         Christchurch,       New      Zealand,         Available      at:
https://oriongis.oriongroup.co.nz/UG/MapWithToolbar.aspx [last accessed 11 August
2016].
Australian Earthquake Engineering Society 2016 Conference, Nov 25-27, Melbourne, Vic

Park J., Nojima N., and Dorothy A. R. (2006) Nisqually Earthquake Electric Utility
Analysis, Earthquake Spectra, 22(2), 491-509.

Van Ballegooy S and Malan P (2013) Earthquake Commission: Liquefaction
Vulnerability Study, Tonkin and Taylor Ltd., Christchurch, New Zealand.

Wald, D.J., Quitoriano, V., Heaton, T. H., Kanamori, H., Scrivner C.W. & Worden
B.C. (1999) TriNet "ShakeMaps": Rapid generation of peak ground-motion and
intensity maps for earthquakes in southern California, Earthquake Spectra, 15: 537-
556.

Worden, C.B., Gerstenberger, M.C., Rhoades, D.A. & Wald, D.J. (2012) Probabilistic
Relationships between Ground Motion Parameters and Modified Mercalli Intensity in
California, Bulletin of the Seismological Society of America, 102: 204-221.
doi:10.1785/0120110156
You can also read


