SERIES CENTRE FOR HEALTH ECONOMICS - Consequences of Greater Gambling Accessibility - Monash ...
←
→
Page content transcription
If your browser does not render page correctly, please read the page content below
CENTRE FOR HEALTH ECONOMICS
WORKING PAPERS
SERIES of Greater Gambling Accessibility
Consequences

Samia Badji
Nicole Black
David W. Johnston

July 2021

Consequences of Greater Gambling Accessibility

 Samia Badji, Nicole Black* and David W. Johnston*

Centre for Health Economics, Monash business School, Monash University, 900 Dandenong
 Road, Caulfield East VIC 3145, Australia

 July 2021

Abstract
Greater accessibility to gambling venues may increase gambling rates, and therefore enhance
welfare through the additional enjoyment from gambling and the related socialising. However,
it may also lead to problematic gambling, financial hardship and psychological distress. We
provide new evidence on the potential benefits and harms of greater geographic accessibility
to suburban gambling venues containing electronic gaming (slot) machines. Our setting is
Australia, the world leader in per capita gambling expenditure. Our approach combines
geolocations of gambling venues with longitudinal survey data on gambling behaviours and
economic, health and social outcomes. We find that people residing in close proximity to
gambling venues are more likely to gamble, less likely to be happy, and are more likely to
suffer from financial hardship and mental health problems. We find no significant impacts on
socialising, general health, relationship dissatisfaction, or crime victimisation. These findings
have implications for the regulation of gambling venues.

Keywords: gambling, harms, mental health, financial hardship,
JEL Codes: D1, H7, I1, I3

* Corresponding authors

Samia Badji: Samia.Badji@monash.edu.au
Nicole Black: Nicole.Black@monash.edu.au
David Johnston: David.Johnston@monash.edu.au

Acknowledgements
The authors are grateful for funding support from the Victorian Responsible Gambling Foundation (VRGF)
Gambling Research Program (Round 9). Helpful comments were gratefully received from Lisa Farrell and
participants at the Australian Health Economics Association Conference (2019) and the Monash Addiction
Research Centre Symposium (2019). This paper uses unit record data from the Household, Income and Labour
Dynamics in Australia (HILDA) Survey. The HILDA Project was initiated and is funded by the Australian
Government Department of Social Services (DSS) and is managed by the Melbourne Institute of Applied
Economic and Social Research (Melbourne Institute). The findings and views expressed in this paper are those of
the authors and should not be attributed to DSS, the Melbourne Institute, the VRGF or the ARC. NB is supported
by an ARC research fellowship.
1. Introduction

Commercial gambling has grown rapidly throughout the world. Between 2001 and 2016, global
annual takings doubled from US$220b to US$450b (Raspor et al., 2019). This rapid rise in
revenues can be seen in nearly every country where legal gambling occurs. Economists have
made important contributions in understanding these gambling markets and associated
gambling behaviours.1 However, there is a surprising paucity of convincing economic research
on the consequences of gambling on gamblers themselves and those around them. 2 Most
existing studies include important empirical limitations, and focus exclusively on harm
minimisation, rather than welfare maximisation. In this paper, we present new evidence on the
impacts of the availability of gambling venues on an individual’s gambling involvement and
their economic, health and social wellbeing.

Even though gambling has a negative expected monetary return, gamblers can be viewed as
rational economic agents who are effectively purchasing entertainment, as well as the hope of
acquiring wealth (Conlisk, 1993; Eadington, 1999). In other words, expected gambling losses
are the price of excitement, and improvement in the accessibility of gambling opportunities is
generally welfare improving. A juxtaposing perspective is that gambling produces a number of
negative effects on society (Kearney, 2005). There are documented links between gambling,
gambling addiction, and harmful health and economic outcomes, such as psychological
distress, suicidal ideation, relationship breakdown, bankruptcy and criminal activity (American
Psychiatric Association 2013; Langham et al. 2016). The key policy question from a social
welfare point of view is whether the increase in consumer utility from improved gambling
accessibility, outweighs the reduction in welfare from the deleterious economic, health and

1
 For example, research into the efficient design of lotteries, decision making in betting markets, regulatory
constraints, pricing of gaming products, taxation of winnings, and the link between gambling and the economy
(Suits 1979; Even and Noble 1992; Conlisk, 1993; Eadinton, 1999; Farrell and Walker 1999; Walker and Young
2001; Kearney, 2005; Guryan and Kearney, 2008; Kumar et al. 2011).
2
 This lack of research has been noted in several past studies, including in a review of the literature by Kearney
(2005, p.287): “Additional data and research establishing the causal link between casino availability and the
incidence of personal bankruptcies, suicide, divorce, and other costly behaviors is needed.” (p.287), and “More
research on the intra-family externalities associated with lottery gambling is needed. More generally additional
research is needed on associated costly behaviors, including for example, the incidence of financial distress and
bankruptcy.” (p. 296). Regrettably, there has been little economics research on these issues since this review was
published.
social outcomes experienced by problem gamblers and their families.3 We help to answer this
important policy question.

Our context is Australia. On a per-capita basis, Australians are the world’s biggest gamblers
with per capita gambling losses in 2017-18 equalling AU$1,292 (NSW Parliament, 2019).4
Electronic Gaming Machines (EGMs), also known as slot machines (US), fruit machines (UK)
and poker machines (Australia), are the largest contributor to gambling losses in Australia, with
about half of all gambling expenditure spent on them. What makes Australia’s EGMs
particularly accessible is their abundance outside of casinos. There exists over 5000 hotels,
pubs and clubs with EGMs in Australia, containing about 200,000 EGMs (Productivity
Commission 2010).5 Moreover, these gambling venues are typically located within suburban
areas and usually offer other types of gambling, such as Keno, and sports and race betting.

Three methodological weaknesses in the existing empirical literature have caused the shortage
of robust, replicable evidence on the positive and negative impacts of gambling. First, most
multidisciplinary studies have relied upon small and non-representative samples, as there are
few large individual-level datasets that include information on gambling behaviours. Second,
many studies have been unable to control for unobserved factors that confound relationships
between socioeconomic status, accessibility to gambling, and gambling behaviours. Third,
studies have typically relied on ‘problem gambling’ survey questionnaires to measure the
consequences of gambling. However, such data are likely to suffer from social desirability bias,
and fail to capture the breadth and complexity of gambling experiences (Browne et al. 2016).6

Our empirical approach entails the matching of geographical locations of all EGM gambling
venues in Australia’s largest states to longitudinal, nationally representative survey data on
gambling behaviours and expenditures, and economic, health and social outcomes. Using an
area fixed-effects approach, we first estimate whether EGM venue accessibility increases

3
 In addition to these impacts on individuals, there are potential economic benefits that arise from the revenue
generated by governments from taxation of gambling revenues. We do not consider these potential benefits, and
instead focus solely on the benefits and costs that accrue to gamblers and their families and neighbours.
4
 In comparison, 2017 per capita gambling losses in Hong Kong and Singapore, the next highest countries after
Australia, equalled US$768 and US$725, respectively. The United States figure equalled US$421.
5
 On a per capita basis this is about five times as many EGMs as in the United States.
6
 The problem gambling questionnaire includes questions such as “Have you felt that you might have a problem
with gambling?”, “Has gambling caused you any health problems, including stress and anxiety?”, and “Have
people criticized your betting or told you that you had a gambling problem, regardless of whether or not you
thought it was true?”
gambling involvement and gambling expenditures.7 Then, to identify the positive and negative
impacts of gambling venues, we estimate the impacts of EGM venue accessibility on potential
benefits (hedonic wellbeing, positive social interactions and local community participation),
and potential harms (financial hardship, poor mental health, poor general health, relationship
dissatisfaction and crime). We additionally explore the population sub-groups who are most
strongly impacted by accessibility, including subgroups defined by income, financial risk and
time preferences, and cognitive ability.

Our ultimate aim is to provide empirical evidence that can aid policy making with regard to the
regulation of gambling industries. Gambling is subject to a wide variety of controls, including
restrictions on where gaming is allowed, how it is advertised, the amount that can be wagered,
hours of operation, and the types of games that can be offered (Eadington, 1999). The
arguments for these restrictions are based partly on the social and economic costs and benefits
from gambling. For example, Australian local governments have the power to reject
applications from gambling venue operators who wish to open a new venue or expand an
existing one. Gambling venue operators in most states must demonstrate that the community
benefits of any new or expanded gambling venue offset any harms to the community.

The analysis generates three main findings. First, we show that within a neighbourhood, people
living closer to EGM gambling venues are significantly more likely to gamble. This effect is
driven by distances less than 250m. Second, we show that this increase in gambling does not
appear to give rise to positive wellbeing benefits; residential proximity to venues actually
reduces hedonic wellbeing, and has no significant impact on either social interactions or
community involvement. Third, we show that the close proximity of venues appears to have
harmful consequences in terms of increased financial hardship and mental ill-health. We see
no significant impact on general health, relationship dissatisfaction, or crime victimisation.
Finally, we show that the effects of living close to a gambling venue are most acutely felt by
vulnerable sub-populations, such as those with low income and low cognitive ability.

Our study provides a rigorous investigation of the individual consequences of greater gambling
accessibility. It builds on previous findings that typically focus on participation in gambling or
problematic gambling as the key outcomes of interest (e.g. Welte et al. 2004; McMillen and

7
 The assumed causal pathway is that gambling venue accessibility reduces the (time and travel) costs of gambling,
and so the quantity of gambling increases. Increases in the quantity of gambling by vulnerable members of the
population (at the extensive and intensive margins) may then create problem gamblers.
Doran 2006; Ministry of Health 2008; Pearce et al. 2008; Storer et al. 2009; Young et al. 2012;
Vasiliadis et al. 2013; Welte et al. 2016; Kato and Goto 2018). These studies generally suggest
that greater accessibility is associated with higher rates of gambling involvement and problem
gambling. Few studies in this multidisciplinary literature attempt to identify causal effects. An
exception is Evans and Topoleski (2002) who use a difference-in-differences approach,
comparing outcomes, before and after the opening of Native American owned casinos. They
find that in counties where an Indian-owned casino opens, employment rates increased by
about 5% of the median, and mortality fell by about 2% four years after a casino opened.8 They
also showed that the economic and health improvements came with some costs: four years after
a casino opened, bankruptcy and crime rates were up 10 percent, in counties with a casino.

A number of other studies have also explored the impacts of gambling venues on area-level
crime rates (Grinols and Mustard 2006; Hyclak 2011) and bankruptcy (Boardman and Perry
2007; Badji et al. 2020) and generally find positive effects.9 However, causal evidence using
individual-level data, in particular on mental health outcomes remains scarce. One relevant
study is Churchill and Farrell (2018) who use a Lewbel instrumental variable estimator to
explore the impact of an individual’s self-reported gambling behaviour on self-assessed
depression in Great Britain. Their findings suggest that gambling addiction has a positive
impact on depression.

The remainder of the paper is structured as follows. Section 2 describes the HILDA data and
administrative records of gambling venues, highlighting their unique features. Section 3 details
our methodological approach. Section 4 presents the main results – we examine the impact of
proximity of gambling venues on gambling involvement, potential benefits and potential
harms. In Section 5, we explore who is more greatly affected by the proximity of gambling
venues. Section 6 discusses the policy implications of our findings and concludes.

8
 These economic improvements are a unique feature of the fiscal independence enabled by the opening of gaming
operations on American Indian reservations (see Akee et al. (2015) for an overview), and do not necessarily
generalise to other settings.
9
 In related economic literatures, several studies have carefully explored the behavioural impacts of being in close
proximity to potentially unhealthy venues. For example, there is evidence to suggest that the proximity to fast
food outlets increases body mass index (Currie et al. 2010; Chen et al. 2013) and that distance to the nearest
cannabis shop (in the Netherlands) affects the age of onset of cannabis use (Palali and van Ours 2015). We apply
similar approaches to the context of gambling venues.
2. Data

For our analysis, we combine two main data sources: the Household, Income and Labour
Dynamics in Australia (HILDA) survey; and, administrative data on the geographical location
of all electronic gaming machine (EGM) venues in the four largest capital cities with legalised
EGM gambling venues (i.e., Sydney, Melbourne, Brisbane and Adelaide). We also supplement
these main datasets with administrative data on the geographical location of all alcohol-serving
venues and post offices in these cities. In this section, we describe these datasets and the key
variables used in our analyses.

2.1 Household, Income and Labour Dynamics in Australia (HILDA) survey

HILDA is an annual nationally representative longitudinal study of Australian households that
began in 2001. It collects detailed information on all household members aged 15 years and
over on a variety of economic and social outcomes, including employment, income, health,
wellbeing and major life events (Wilkins and Lass 2015). We use HILDA data to measure an
individual’s gambling behaviour and their potential positive and negative outcomes associated
with residing in close proximity to an EGM venue. Our primary sample includes HILDA
respondents aged 18 years and over (legal gambling age), who reside in urban areas of Sydney,
Melbourne, Brisbane and Adelaide,10 and who provided information on gambling behaviours
(asked only in 2015 and 2018). This provides a sample of 14,860 observations from 9,071
people.

2.1.1 Gambling expenditure and problem gambling

HILDA collected information on gambling expenditures and problem gambling symptoms in
the wave 15 and wave 18 self-completion questionnaires. Respondents are first asked about
their expenditure on 10 different types of gambling in a typical month. From the expenditure
information we construct two types of gambling variables. Our main gambling variable is a
binary indicator representing any positive gambling expenditure in EGM gambling venues in
a typical month. The types of gambling that are generally available in an EGM gambling venue

10
 We select these cities to match available data on EGM venues. We exclude rural areas because of the high mean
distance between homes and EGM venues, as compared with urban areas, in which a high proportion of people
live within one kilometre of a venue.
are: poker/slot machines, Keno, sports betting, and betting on horse/dog racing. Therefore, our
main indicator for gambling at EGM gambling venues represents positive gambling
expenditure on any of these gambling activities. For comparative purposes, we also use similar
binary indicators for other types of gambling (e.g. lotteries, scratch cards). Our secondary
gambling variables are expenditure on different types of gambling in $000s. In our data, 13%
of respondents report positive expenditure in EGM gambling venues. Among this 13% (N =
1875), mean expenditure equals $161, and mean expenditure as a percentage of weekly
household income equals 13%. Around 6% of these gamblers report expenditure in a typical
month that exceeds 50% of their total weekly household income.

HILDA respondents are additionally asked questions that are used to construct the Problem
Gambling Severity Index (PGSI) (Ferris and Wynne 2001). The nine questions measure
problem gambling behaviours (e.g. “have you borrowed money or sold anything to get money
to gamble?”) and adverse consequences of gambling (e.g. “has your gambling caused any
financial problems for you or your household?”). See Appendix Table A1 for the list of
questions. The PGSI is constructed by summing up the responses: 0 “never”; 1 “sometimes”;
2 “most of the time”; and 3 “almost always”. Most people (97%) score zero on the PGSI,
indicating the person has no ‘problem gambling’ behaviours or adverse consequences from
gambling. Given the rarity of positive values, and the extreme positive skewness of the
distribution (skewness = 8.07), in all analyses we use a binary variable signifying at least one
problem gambling symptom.

Table 1 presents descriptive statistics of the gambling expenditure at EGM gambling venues
and problem gambling variables separately by individual socioeconomic characteristics. The
likelihood of gambling, amount gambled (both in dollar terms and as a percentage of income)
and incidence of any problem gambling symptoms are all higher for males, older people (aged
≥ 45), and people with lower incomes (< median household income). These figures are in-line
with previous studies that document higher gambling expenditure and disorder rates for more
disadvantaged individuals and communities (Welte et al. 2004; Rintoul et al. 2013). Table 1
also demonstrates that gambling expenditures and problem gambling are higher for people
who: are willing to take financial risks (less risk averse), have a short time horizon for financial
planning (high time discounting); and have lower cognitive ability.11

2.1.2 Potential benefits from living near gambling venues

Qualitative studies have shown that gambling venues can offer not only entertainment and
enjoyment from gambling, but they can also provide social benefits (Productivity Commission
2010). Many gambling venues provide a range of amenities, such as restaurants, bars and
entertainment facilities, which offer a comfortable place for people in the local community to
socialise. To investigate whether living in close proximity to gambling venues is associated
with greater enjoyment and social benefits, we examine three measures from waves 15 and 18
of HILDA.

The first is a binary indicator for whether or not the respondent reported feeling happy at least
for ‘a good bit of the time’ during the past four weeks (78% of people). This aims to capture
hedonic enjoyment, which could result from the excitement from gambling as well as engaging
in enjoyable activities, including socialising. The second measure is a binary indicator for
whether or not the respondent gets together socially with friends at least several times a week
(23% of people). Our final ‘benefit’ variable is related to this measure, and quantifies the extent
to which the respondent feels part of their local community. This variable ranges from 0 to 10,
with higher values indicating that the respondent has a greater quantity and/or quality of
connections with people in their neighbourhood.

2.1.3 Potential harms from gambling

We estimate potential negative consequences of gambling using measures of financial
hardship, relationship dissatisfaction, poor mental health, poor general health, and crime
victimisation. These are based on the taxonomy of gambling related harms developed by
Langham et al. (2016) and are described in more detail below. A consideration in selecting our
measures of harm is that they should capture consequences experienced by anyone residing
close to an EGM venue. This may be gamblers themselves, but it may also be their family
members and neighbours.

11
 Cognitive ability is measured using the predicted factor from a factor analysis of scores on the National Adult
Reading Test, Backwards Digit Span test, and Symbol Digits Modalities test. See Gong and Zhu (2019) for a
detailed investigation of the association between gambling behaviours and cognitive ability.
Financial hardship is measured through self-completion survey questions, which ask people
whether, due to a shortage of money, they: could not pay electricity, gas or telephone bills on
time; could not pay the mortgage or rent on time; pawned or sold something; went without
meals; was unable to heat home; asked for financial help from friends or family; or, asked for
help from welfare or community organisations. 80% of our sample did not experience any of
the financial hardships, and 6% experienced three or more hardships. In our main analyses we
use a binary variable signifying at least one financial hardship. We also present supplementary
estimates for each hardship separately.

Mental health is measured using the mental health domain (index) from the 36-Item Short Form
Survey (SF-36) health instrument. This index is derived from questions asking people how
much of the time during the past four weeks they have experienced symptoms associated with
mental illness (e.g. ‘felt so down in the dumps that nothing could cheer you up’). In our
regressions, we use a binary variable of poor mental health, which indicates that the person has
a score less than one standard deviation below the mean (19% of people). We additionally
estimate effects on having fair or poor general health (17% of people).

Gambling venues could increase crime in the local area due to a number of reasons (Evans and
Topoleski, 2002). For example, continued and problematic gambling can drive gamblers to
theft and property crime as a means to address large debts and insufficient funds. Another
reason why criminal activity could be higher is simply because more people congregate near
the venue, and criminals are attracted to the higher opportunities to commit crime. To measure
whether there are higher rates of crime in areas close to EGM venues, we use a binary indicator
of whether or not the individual was a victim of a property crime (e.g. theft or housebreaking)
or a violent crime (e.g. assault) in the past year.

Finally, we examine relationship disruption by using a question that asks respondents to rate
their level of satisfaction with their relationship with their partner. We create a binary indicator
of relationship dissatisfaction, which equals one if respondents scored 6 or lower on a 0-10
scale (14% of people).

2.2 Administrative records of gambling venues
Data on the geographical location of EGM gambling venues in years 2015 and 2018 were
constructed by combining separate administrative databases containing details of all licenced
gambling venues from four states of Australia: New South Wales (Sydney), Victoria
(Melbourne), Queensland (Brisbane) and South Australia (Adelaide). See Appendix B for more
details on the sources of datasets from each jurisdiction. We define a gambling venue as any
non-casino business with at least one licenced EGM in operation. 12 For Queensland, we
obtained latitude and longitude coordinates of all existing venues. Other states provided venue
addresses, which were subsequently geocoded using the ArcGIS World Geocoding Service. A
similar approach was used to construct data on the location of all establishments with a licence
to serve alcohol.

2.2.1 Proximity of gambling venues

The exact residential addresses of HILDA respondents are not available. However, the HILDA
dataset does contain relatively precise information on residential locations through two distinct
geographical classifications systems: Statistical Area 1 (SA1) and census Collection District
(CD). There are 57,523 SA1s covering the whole of Australia, with an average of about 400
people in each (Australian Bureau of Statistics 2016). For the 2006 census, there were 38,200
CDs throughout Australia, with an average of about 225 dwellings in each. To calculate the
approximate distance from the respondent’s home to the closest EGM gambling venue, we
used the midpoint of the intersection between the respondent’s SA1 and CD areas, and calculate
the Euclidean distance to the nearest EGM gambling venue. The median size of the intersected
areas is 0.4 kilometres squared (equivalent to a circle with radius 200m). This indicates that
the measurement error in the distance to gambling venues is small, but that the estimated effects
of distance will suffer from (slight) attenuation bias.

The mean distance between EGM gambling venues and people’s residence equals 1.28km. As
shown in Panel A of Figure 1, the distance measure displays substantial positive skewness.
Therefore, in all primary analyses we use the natural logarithm of the distance to EGM
gambling venues; the histogram is shown in Panel B of Figure 1. Our secondary approach for

12
 The seven casinos were excluded from the data because they are distinct from local EGM gambling venues.
Casinos are generally large, destination- or resort-style gambling complexes located in central business or
commercial districts, which offer different types of gambling (e.g. poker, blackjack and roulette) and other
forms of entertainment (e.g. cinemas). We additionally explored the sensitivity of our results to omitting
neighbourhoods with unusually large venues, containing >300 EGMs. These large venues may also be viewed
as destination gambling complexes. All estimated coefficients using this reduced sample were very similar to
those presented in the paper.
measuring proximity to people’s residence is to aggregate distance to nearest venue into four
categories: < 250m (6%); 250m-1km (47%); 1km-2km (32%); and > 2km (16%).

Undoubtedly, people travel to gambling venues from locations other than their residence. In
particular, they may visit venues after work or after shopping. Doran et al. (2007) highlighted
the appeal of gambling venues located in shopping strips and other places of social
congregation. HILDA does not contain precise information on workplace locations, and
roughly one-third of our 18-90 year old sample is not employed (21% work part-time 46%
work full-time). However, we calculated the distance between HILDA respondents’ closest
post office and its closest EGM gambling venue. Most shopping areas in Australia include a
post office, and so these calculated distances provide an approximation of the proximity of
gambling venues to HILDA respondents’ closest shopping area. Data on the location of post
offices were obtained from the Australian Postal Corporation and consists of the exact
addresses of every post office. The mean distance between EGM gambling venues and people’s
nearest post office equals 0.86km. As this distance measure is also positively skewed (see
Appendix Figure A1), we use the natural logarithm of distance to post office.

3. Empirical Approach

This study includes three main sets of analysis. First, we estimate whether the proximity of
gambling venues impacts upon a person’s likelihood of undertaking gambling of different
types. Second, we estimate reduced form regression models to determine whether the observed
increases in gambling are associated with any positive wellbeing outcomes (hedonic
enjoyment, social and community connectedness), and any harmful outcomes (financial,
relationship, mental health, general health and crime).13 Finally, we explore the population
subgroups who are most strongly affected. A specific focus will be on disadvantaged
subpopulations (e.g. low income and non-employed), and individuals with risk and time
preferences and cognitive ability levels that make them vulnerable to gambling harms.

People who reside closer to gambling venues have higher socioeconomic status than people
who reside farther away (this is demonstrated below), implying that distance from venues is

13
 We focus on one key aspect of accessibility to gambling – the distance of gambling venues from homes and
shops. However, we recognise that there are other aspects of the gambling venue that could influence accessibility
(such as opening hours and attractiveness of the venue environment), and these may modify the estimated
consequences of proximity. Unfortunately, venue level data on these other aspects are not available.
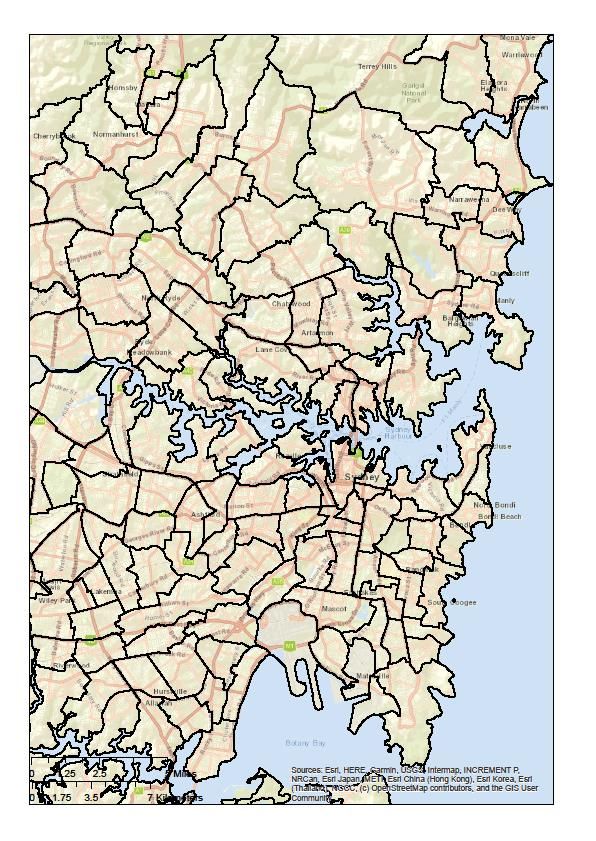
positively correlated with harmful outcomes, such as financial hardship. To control for this
endogeneity bias, we estimate the following dynamic regression model:

 ′
 = + −1 + + ′ + (1)

where is the outcome of individual i from year t, Areait is the set of area-level covariates
including neighbourhood fixed-effects, and is the set of individual-level covariates: month
and year of the survey, a cubic function of age, sex, marital status, number of children, and
educational attainment. Each regression also includes the lagged outcome −1 to control for
state dependence, and also for the possibility that current residential location is impacted by
past outcomes.14

The key parameter of interest is , the effect of proximity of nearest gambling venue
( ) on wellbeing. Given the inclusion of neighbourhood fixed-effects, this parameter
is identified by differences in the distance to a gambling venue, between people living in the
same neighbourhood. Neighbourhoods are defined by the Australian Bureau of Statistics,
Statistical Area Level 2 (SA2) geographical system. A SA2 is defined to “represent a
community that interacts together socially and economically”, and often aligns with suburb
borders (Australian Bureau of Statistics 2016). There are 2,310 SA2 regions covering the whole
of Australia. In our sample, we include the metropolitan areas of Sydney, Melbourne, Brisbane,
and Adelaide, which are divided up into 254, 265, 210 and 96 SA2s respectively. The median
area of an SA2 in our sample equals 8.2 square kilometres (3.2 square miles), which is
equivalent to a circular area with radius of 1.6 km (1 mile). Appendix Figure A2 includes a
map of Sydney that further illustrates the size of SA2s.

Each neighbourhood (SA2) contains a relatively homogenous population; however, small
demographic and socioeconomic differences exist. To control for these differences, we also
include in Areait a detailed set of area-level control variables. One key area-level variable is
accessibility to other drinking establishments such as pubs, clubs and hotels. We include the
distance (in natural logs) from the individual’s residence to the closest (non-gambling) drinking
establishment. Residential distance to gambling venues and distance to other drinking

14
 Although we have panel data, we are unable to examine within-individual changes in outcomes as there was
insufficient across-time variation in the number of venues within neighbourhoods (lack of openings and closings).
establishments are positively correlated, and given the known harms from excessive
consumption of alcohol, it’s important to control for alcohol accessibility. Other area-level
controls, measured at the (smallest) SA1 geographical level, are: income and wealth index;
education and occupation index; mean house prices, mean residential rents, and mean score of
perceptions of seven aspects of neighbourhood quality.15

In Table 2 we show that these observed area-level control variables, together with the
neighbourhood fixed-effects, sufficiently reduce heterogeneity associated with venue
proximity. Column (1) of Table 2 presents estimated associations between log distance from
residence to the nearest EGM gambling venue and individual socioeconomic status,
preferences and ability, and risky health behaviours (i.e. estimates from a regression without
any covariates apart from log distance). The estimates from this column suggest that several
individual characteristics are associated with log distance from nearest gambling venue. People
who reside close to gambling venues tend to be higher paid, better educated, work in higher
status occupations, are more risk averse, have greater cognitive ability, and drink more alcohol.

Column (2) presents estimated associations from regressions that include area-level covariates
and neighbourhood fixed-effects (Areait). These estimates suggest that the area-level variables
adequately control for the socioeconomic differences between people living near and far from
venues. The estimates for income, education, occupational status, risk aversion, cognitive
ability, and alcohol consumption are much smaller in magnitude, and are no longer statistically
significant.

As an additional test, we explore the possibility of endogenous residential sorting based on the
propensity to gamble. Or, in other words, we test whether people who like to gamble (or have
unobserved characteristics that make them more likely to gamble) tend to move closer to
gambling venues. Specifically, we regress distance to gambling venues in 2018 on gambling
behaviours from 2015, and our set of control variables from 2015. This regression is estimated
using the sample of respondents (N = 2,082) who changed residential location between 2015
and 2018. The results indicate that 2015 gambling behaviour is not a significant predictor of
how close a person lives to a gambling venue in 2018: estimated effects of gamble (0/1),

15
 The two indices are Australian Bureau of Statistics Socio-Economic Indexes for Areas (SEIFA) called the Index
of Economic Resources, which summarises people’s income and wealth levels, and the Index of Education and
Occupation (IEO), which summaries people’s educational and occupational levels, using data from the 2016
Census. The neighbourhood quality measures are: traffic noise; noise from industry, trains and airplanes; condition
of homes and gardens; extent of rubbish and litter; incidence of hostility and aggressiveness; incidence of
vandalism and damage to property; and incidence of burglary and theft.
gambling expenditure ($000s) and problem gambling (0/1) equal -0.05 (p=0.46), -0.09
(p=0.30) and -0.04 (p=0.67), respectively. Moreover, distance from venue in 2015 isn’t a
significant predictor of distance from venue in 2018 (coefficient=-0.02, p=0.61). Overall, these
test results support the validity of our identification assumption.

4. Results

4.1. Accessibility and gambling behaviour

Table 3 presents estimated effects of proximity to venues on gambling behaviour. In Panel A,
proximity is measured using log distance from residence. The estimate of -0.015 in column 1
indicates that doubling the distance from an EGM gambling venue, reduces the likelihood of
gambling on games offered in such venues by 1.4 percentage points (relative to a mean
gambling rate of 13 percent). Such effects do not hold for other gambling types: people who
live further from EGM gambling venues are no less likely to gamble on games offered at
casinos (roulette, blackjack, poker), play the lottery, or purchase scratch cards. This suggests
that there are no spillover effects from gambling in EGM gambling venues to other types of
gambling. The results also suggest that the significant finding for EGM venue gambling (-
0.015) is not driven by unobserved confounding factors, such as preferences (e.g. risk
aversion), behavioural traits (e.g. impulsivity), or socioeconomic status (e.g. liquid wealth),
because we would expect these factors to have similar effects on other gambling types.

Panel B of Table 3 shows that the significant distance effect in Column 1 is driven by distances
less than 1km; essentially comfortable walking distances. People living within 250m of a venue
are 5.8 percentage points more likely to gamble on games offered in such venues, and people
living within 250m-1km are 3.6 percentage points more likely to gamble, relative to people
living >2km from a venue. To place these effect sizes in perspective, Appendix Table A2
presents the estimated coefficients on the demographic and socioeconomic covariates included
in the regression. The estimated effects for male, having no children (relative to having three),
and being a high school dropout (relative to university educated) equal 9.0, 5.6 and 8.1
percentage points, respectively.16

In Appendix Table A3, we demonstrate that log distance from venues is not a significant
predictor of the amount of gambling expenditure, among those who gamble (the intensive
margin of gambling). All the estimated coefficients are very close to zero, including those on
distance < 250m and distance 250m-1km, for which we found large effects on the likelihood
of any gambling expenditure. These results are somewhat surprising. Our expectation was that
gamblers spend more time in venues, and have higher gambling expenditure, when the costs
of gambling are low. One explanation for these null effects is that people misreport their
expenditure amounts. People may not know the precise dollar amount gambled, and big
gamblers may feel uncomfortable disclosing how much they gamble (desirability bias).

As discussed in Section 3, having a gambling venue located near to or within a shopping district
may also induce people to gamble. In Panel C we test this proposition by replacing distance
from residence with distance from nearest post office in the regressions. The estimates indicate
that this distance measure is not a predictor of gambling.17 This could imply that people rarely
gamble near where they shop. It could also mean that a significant proportion of people do not
regularly shop at their closest shopping district; introducing measurement error in our distance
measure and attenuating our estimates.

Finally, in Column 5 we explore whether venue proximity is associated with increased rates of
problem gambling symptoms (from the PGSI). We find that living or shopping near a gambling
venue does not increase the likelihood of reporting any problem gambling behaviours, with all
the point estimates small in magnitude. These results may appear to contradict the significant
financial hardship and mental health effects that we find in Section 4.3, especially given the
PGSI includes a financial hardship item (“has your gambling caused any financial problems
for you or your household?”) and a mental health item (“has gambling caused you any health
problems, including stress or anxiety?). An explanation for this inconsistency is that the
framing of the questions, which requires people to acknowledge their problematic gambling

16
 Importantly, the distance effects are not driven by the strong documented association between mental illness
and gambling (Hartmann and Blaszczynski, 2018). If we omit people from the estimation sample who report
having depression, anxiety or another mental illness, the estimated effects are similar to those reported in Table
3: people living within 250m and 250m-1km of a venue are 5.7 percentage points and 4.1 percentage points more
likely to gamble, respectively.
17
 The coefficients on ‘log distance from post office’ in regressions that also include ‘log distance from residence’
are also small and statistically insignificant.
behaviour, leads to an under-reporting of gambling problems (Tourangeau and Yan 2007) and
subsequently an underestimate of the estimated association. Moreover, an emphasis on using
indicators of problem gambling or indexes used to screen for gambling disorder can overlook
the broader outcomes associated with gambling. We explore these broader outcomes in the
following sections.

4.2 Potential benefits of greater accessibility

We next investigate whether greater gambling accessibility leads to wellbeing benefits in the
form of increased happiness, socialising and community participation. We regress our three
wellbeing outcomes on venue distance, lagged outcomes, and the same set of area- and
individual-level controls used previously. The estimated effects of distance from these
regressions could be driven by direct effects on gamblers (e.g. the gambler has increased
happiness/enjoyment) and/or indirect effects on family members of gamblers or other local
residents (e.g. the gambler’s spouse has increased happiness). In other words, a person does
not need to be induced to gamble themselves in order to experience a positive impact from
residing close to a venue.

Column (1) of Table 4 presents the effects of proximity to Gambling venues on being happy.
Our results suggest that rather than providing opportunities for hedonic wellbeing and
enjoyment (as is arguably a key benefit of such venues), living in close proximity to Gambling
venues significantly reduces feelings of happiness. The estimate in Panel A indicates that
increasing the distance between home and an EGM venue by 100% increases the likelihood of
being happy by 1.4 percentage points (relative to a mean likelihood of 78 percent). This
distance effect is strongest for people living within 250m of an EGM venue; such people are
7.2 percentage points less likely to be happy, relative to people living >2km from a venue.
Columns (2) and (3) show that living in close proximity to an EGM venue does not have a
significant effect on socialising or community belonging. Combined, the results from Table 4
suggest that there is no evidence of significant wellbeing benefits from living in close proximity
to EGM venues. On the contrary, we find evidence of a modest reduction in feelings of
happiness.

4.3 Potential harms of greater accessibility
In this section we explore potential harmful impacts of living in close proximity to a gambling
venue. Column (1) of Table 5 presents the effects of proximity on the experience of financial
hardship. The estimate in Panel A indicates that a 100% increase in distance reduces the
likelihood of financial hardship by 1.5 percentage points (relative to a mean likelihood of 20
percent, p2km from a venue. Living 250m-1km or 1km-2km away increases the likelihood of
financial hardship by 3.4 and 3.2 percentage points, respectively. The estimated effects are
large. As a comparison, estimates for other covariates in our model, such as being divorced
(relative to never married), having three children (relative to having none), and being a high
school dropout (relative to university educated) equal 4.2, 5.4 and 6.3 percentage points,
respectively (see Appendix Table A2).

Table 6 shows that the financial hardship effects shown in Table 5 are driven in particular by
the effect of distance on the need for “financial help from friends or family”. Residing within
250m of a venue increases the likelihood of asking friends or family for financial help by 6.6
percentage points. This highlights that proximity of gambling venues not only affects gamblers,
but also affects family members and friends. Several other financial hardship items are also
positively affected by residing close to gambling venue: went without meals, couldn’t pay bills
on time, and couldn’t pay the mortgage/rent.

We also find harmful effects of venue accessibility on mental health. A 100% increase in
distance to a gambling venue is estimated to reduce the likelihood of poor mental health by 1.5
percentage points (relative to a mean likelihood of 19 percent). Again, this is driven by close
proximity to venues. Living within 250m of a venue increases the likelihood of experiencing
poor mental health by 5.6 percentage points, relative to people living >2km from a venue. In
contrast to these mental health results, proximity is estimated to have small effects on general
health. This null effect may be caused by the fact that general health reflects a person’s physical
health more than mental health (Au and Johnston, 2014).

Relationship dis-satisfaction is similarly unaffected by proximity to gambling venues. This is
not an entirely unexpected result. Though relationship distress is a commonly cited gambling
harm in the public health literature – which is the motivation for including it here – the
heterogeneity of causal effects within households are unknown. Even though spouses of
gamblers may be more dis-satisfied with their relationship (e.g. due to resenting their partner’s
gambling), it is unclear that gamblers themselves will be. The presented estimated effects of
proximity are an amalgamation of the effects on gamblers and their spouses.

Finally, in contrast to Evans and Topoleski (2002), we find no evidence that gambling
accessibility increases the likelihood of crime victimisation. This could be because crime is
rarely reported in our sample (3.9% per year). The estimated effect of residing within 250m
equals 1.3 percentage points, which is equivalent to a 33% increase, relative to the sample
mean. Nevertheless, the imprecision of the estimates prevents us from drawing any
conclusions.

5. Which population subgroups are most strongly affected?

Undoubtedly, most people are unaffected by proximity to EGM gambling venues. Only certain
types of people will be induced to gamble, and to subsequently experience financial hardship
and poor mental health (Gong and Zhu 2019). We investigate who is most vulnerable by re-
estimating the effects of living within 250m of a venue on financial hardship and mental health
using subsamples defined by gender, age, employment status, income, subjective financial risk
preference, subjective financial time preference, and cognitive ability.

The estimated coefficients, presented in Table 7, show that the populations with more negative
financial hardship effects are: men, younger people, people employed with low incomes, those
who are risk averse and have a short planning horizon, and people with lower cognitive ability.
An alternative approach for exploring heterogeneity is to estimate one financial hardship
regression that includes interaction terms between log distance and each of the individual
characteristics; this controls for the correlation between the different individual characteristics
(e.g. between income and cognitive ability). In this regression, log household income is clearly
the most important moderating factor (p-value on interaction term = 0.004). People with low
incomes are much more likely to experience financial hardship when residing close to a
gambling venue.

The mental health effects appear to be largest for males who are younger, employed and with
low cognitive ability. The alternative approach using interaction terms supports the observed
difference by sex, with the relationship between distance and mental health being significantly
more positive for men.

Overall, our results suggest that young males in low income jobs are most vulnerable to poorer
mental health and financial difficulties when they have greater accessibility to gambling
venues. Previous evidence has focussed on the wellbeing impacts of gambling among older
people (>50 years) (Churchill and Farrell 2020). However, our findings suggest that despite
older people representing the larger share of gamblers in Australia, the harmful effects are
much greater for younger people. The higher mental health consequences among young males
is particularly worrisome. This is a population group who are least likely to seek treatment for
psychological problems (Mackenzie et al. 2006), and for whom suicide is the leading cause of
death (AIHW 2021).

6. Conclusion

For the majority of gamblers, the entertainment value gained from gambling either equals or
exceeds the losses they incur. However, for a small proportion of the population, the losses
incurred from gambling can lead to a myriad of harmful outcomes. This means that there is
inevitably some level of trade-off between government revenue and individual harms. In most
countries, gambling markets are regulated and fine-tuning of regulatory models is an ongoing
process. There have been particular concerns about the ‘safety’ of electronic gaming machines
(EGMs), which has led to rules about machine design (e.g. minimum rate of return, maximum
bet) and restricted licensing of venue operators (Productivity Commission 2010).

However, better evidence on the impacts (both positive and negative) of the accessibility of
gambling venues is needed in order to better understand whether the economic benefits of
gambling venues outweigh the costs, under current regulations. In this paper, we combine the
geolocation of all non-casino EGM gambling venues in four states of Australia (NSW, VIC,
QLD and SA), with rich longitudinal survey data to present new evidence on the impacts of
proximity to gambling venues on an individual’s gambling involvement, and on their
economic, health and social wellbeing.

Our main results indicate that proximity matters: doubling the distance from one’s residence to
an EGM gambling venue reduces the likelihood of gambling on games offered in such venues
by 1.5 percentage points (relative to a mean gambling rate of 13 percent). We find no significant
effect for other types of gambling (casinos, lotteries or scratch cards), suggesting that spillover
effects are limited.

We also find that this increase in gambling likely translates into harmful outcomes. We find
residential proximity to gambling venues significantly increases financial hardship and mental
health problems, especially for very close distances. Given the aetiology of gambling disorder
(American Psychiatric Association 2013), it is possible that these mental health effects are (at
least in part) driven by the increased financial hardship. Importantly, it is recognised that the
costs of mental ill-health extend beyond the suffering felt by the individual and their family,
for instance, it has flow-on consequences for health care expenditure, reduced economic
participation and welfare support (Productivity Commission 2020). Such societal costs should
be considered when governments weigh up decisions to approve gaming licence applications.

We additionally find that proximity reduces feelings of happiness, which may be related to the
increased financial hardship and mental health problems. In our exploration of other possible
wellbeing benefits, we find no evidence that living in close proximity to Gambling venues
improves the likelihood of socialising with friends, or feeling part of your community.

Finally, we show that the harmful effects of living in close proximity to gambling venues is not
equal across populations. The location of gambling venues in close proximity to people’s
homes have greater harmful impacts on populations that are traditionally more vulnerable (such
the young, low income and low cognitive ability), and as such likely result in a widening of
socioeconomic and health inequalities. This finding also implies that a reduction in welfare
from greater gambling accessibility is most likely to occur in areas with low socioeconomic
status.
References
Akee, R. K., Spilde, K. A., & Taylor, J. B. (2015). The Indian gaming regulatory act and its
 effects on American Indian economic development. Journal of Economic
 Perspectives, 29(3), 185-208.
Au, N., & Johnston, D. W. (2014). Self-assessed health: what does it mean and what does it
 hide?. Social science & medicine, 121, 21-28.
American Psychiatric Association (2013). Diagnostic and statistical manual of mental
 disorders, fifth edition. Washington, DC, American Psychiatric Association.
Australian Bureau of Statistics (2016). 1270.0. 55.001 - Australian Statistical Geography
 Standard (ASGS): Volume 1—Main Structure and Greater Capital City Statistical
 Areas. Canberra, ABS.
Australian Institute of Health and Welfare 2021. Deaths in Australia. Cat. no. PHE 229.
 Canberra: AIHW. Viewed 25 June 2021, https://www.aihw.gov.au/reports/life-
 expectancy-death/deaths-in-australia
Badji, S., N. Black and D. Johnston (2020). "Association between density of gaming venues
 in a geographical area and prevalence of insolvency: Longitudinal evidence from
 Australia." Addiction.
Blaszczynski, A. and L. Nower (2002). "A pathways model of problem and pathological
 gambling." Addiction 97(5): 487-499.
Boardman, B., & Perry, J. J. (2007). Access to gambling and declaring personal
 bankruptcy. The Journal of Socio-Economics, 36(5), 789-801.
Browne, M., E. Langham, V. Rawat, et al. (2016). Assessing gambling-related harm in
 Victoria: a public health perspective. Melbourne, Victorian Responsible Gambling
 Foundation.
Chen, S. E., R. J. Florax and S. D. Snyder (2013). "Obesity and fast food in urban markets: a
 new approach using geo‐referenced micro data." Health economics 22(7): 835-856.
Christiansen, E. M. (1998). "Gambling and the American economy." The Annals of the
 American Academy of Political and Social Science 556(1): 36-52.
Churchill, S. A. and L. Farrell (2018). "The impact of gambling on depression: New evidence
 from England and Scotland." Economic Modelling 68: 475-483.
Churchill, S. A., & Farrell, L. (2020). Gambling and Subjective Wellbeing of Older
 Australians. In Measuring, Understanding and Improving Wellbeing Among Older
 People (pp. 97-116). Palgrave Macmillan, Singapore.
Clark, L., B. Studer, J. Bruss, D. Tranel and A. Bechara (2014). "Damage to insula abolishes
 cognitive distortions during simulated gambling." Proceedings of the National
 Academy of Sciences 111(16): 6098-6103.
Conlisk, J. (1993). The utility of gambling. Journal of risk and uncertainty, 6(3), 255-275.
Currie, J., S. DellaVigna, E. Moretti and V. Pathania (2010). "The effect of fast food
 restaurants on obesity and weight gain." American Economic Journal: Economic Policy
 2(3): 32-63.
Doran, B. J., J. McMillen and D. C. Marshall (2007). "A GIS‐based Investigation of Gaming
 Venue Catchments." Transactions in GIS 11(4): 575-595.
Eadington, W. R. (1999). The economics of casino gambling. Journal of economic
 perspectives, 13(3), 173-192.
Evans, W. N., & Topoleski, J. H. (2002). The social and economic impact of Native
 American casinos (No. w9198). National Bureau of Economic Research.
Even, W. E. and N. R. Noble (1992). "Testing efficiency in gambling markets." Applied
 Economics 24(1): 85-88.
Farrell, L. and I. Walker (1999). "The welfare effects of lotto: Evidence from the UK."
 Journal of Public Economics 72(1): 99-120.
Ferris, J. A. and H. J. Wynne (2001). The Canadian problem gambling index, Canadian
 Centre on Substance Abuse Ottawa, ON.
Gong, X., & Zhu, R. (2019). Cognitive abilities, non-cognitive skills, and gambling
 behaviors. Journal of Economic Behavior & Organization, 165, 51-69.
Grinols, E. L., & Mustard, D. B. (2006). Casinos, crime, and community costs. Review of
 Economics and Statistics, 88(1), 28-45.
Guryan, J., & Kearney, M. S. (2008). Gambling at lucky stores: Empirical evidence from
 state lottery sales. American Economic Review, 98(1), 458-73.
Hartmann, M. and A. Blaszczynski (2018). "The longitudinal relationships between
 psychiatric disorders and gambling disorders." International Journal of Mental Health
 and Addiction 16(1): 16-44.
Hing, N. and J. Haw (2009). "The development of a multi-dimensional gambling accessibility
 scale." Journal of Gambling Studies 25(4): 569-581.
Hing, N. and S. Nisbet (2010). "A qualitative perspective on physical, social and cognitive
 accessibility to gambling." Journal of Gambling Issues(24): 101-120.
Hyclak, T. (2011). Casinos and campus crime. Economics Letters, 112(1), 31-33.
Kato, H. and R. Goto (2018). "Geographical accessibility to gambling venues and
 pathological gambling: an econometric analysis of pachinko parlours in Japan."
 International Gambling Studies 18(1): 111-123.
Kearney, M. S. (2005). The Economic Winners and Losers of Legalized Gambling. National
 Tax Journal, 58(2), 281-302.
Kumar, A., J. K. Page and O. G. Spalt (2011). "Religious beliefs, gambling attitudes, and
 financial market outcomes." Journal of Financial Economics 102(3): 671-708.
Langham, E., H. Thorne, M. Browne, et al. (2016). "Understanding gambling related harm: a
 proposed definition, conceptual framework, and taxonomy of harms." BMC Public
 Health 16: 80.
Lorains, F. K., S. Cowlishaw and S. A. Thomas (2011). "Prevalence of comorbid disorders in
 problem and pathological gambling: Systematic review and meta‐analysis of population
 surveys." Addiction 106(3): 490-498.
Mackenzie, C. S., Gekoski, W. L., & Knox, V. J. (2006). Age, gender, and the
 underutilization of mental health services: The influence of help-seeking
 attitudes. Aging and mental health, 10(6), 574-582.
Marshall, D., J. McMillen, S. Niemeyer and B. Doran (2004). Gaming machine accessibility
 and use in suburban Canberra: A detailed analysis of the Tuggeranong Valley, ANU
 Centre for Gambling Research.
McMillen, J. and B. Doran (2006). "Problem gambling and gaming machine density: Socio-
 spatial analysis of three Victorian localities." International Gambling Studies 6(1): 5-
 29.
Mikhed, V., B. Scholnick and H. Byun (2017). Spatial Commitment Devices and Addictive
 Goods: Evidence from the Removal of Slot Machines from Bars, Research Department,
 Federal Reserve Bank of Philadelphia.
Ministry of Health (2008). Raising the odds neighbourood access to gambling venues in New
 Zealand. M. o. Health. Wellington.
Palali, A. and J. C. van Ours (2015). "Distance to cannabis shops and age of onset of
 cannabis use." Health economics 24(11): 1483-1501.
Pearce, J., K. Mason, R. Hiscock and P. Day (2008). "A national study of neighbourhood
 access to gambling opportunities and individual gambling behaviour." Journal of
 Epidemiology and Community Health 62(10): 862.
Productivity Commission (1999). Australia's gambling industries. Report No.10. Canberra,
 AusInfo.
You can also read