Shaping Thailand's Intended Nationally Determined Contribution (INDC): Post2020 Mitigation Contributions - Thai-German Cooperation
←
→
Page content transcription
If your browser does not render page correctly, please read the page content below
Shaping Thailand’s Intended
   Nationally Determined
   Contribution (INDC):
Post2020 Mitigation Contributions
               17 October 2014
        Swissotel Nai Lert Park, Bangkok

        Bundit Limmeechokchai
                SIIT-TU
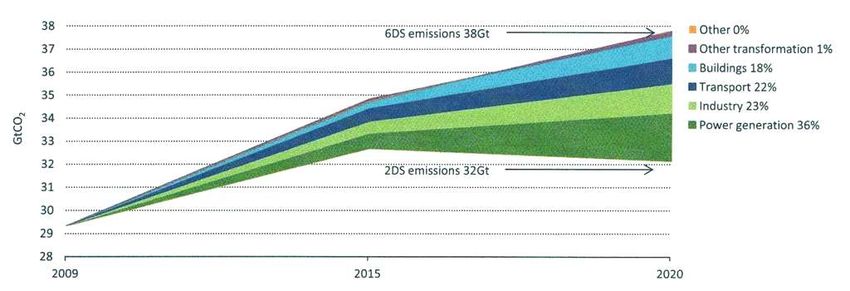
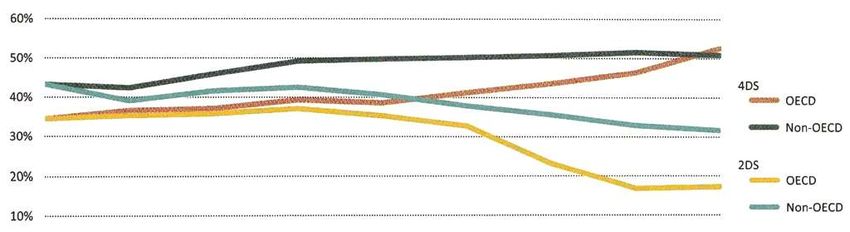
• GHG emissions in 2050 will be half of present emissions to
  achieve the 2 Degree Scenario (2DS).
• In 2050, 75% of GHG reduction will come from developing
  countries.

 Source: IEA (2012)
• สำหรับก่อนปี ค.ศ. 2020 นั้น เพื่อบรรลุเป้ำหมำย 2 องศำ, World Global
  GHG emission reduction ส่วนใหญ่จะลดลงได้จำกกำรลดกำรใช้เชื้อเพลิง
  Fossil ในภำคเศรษฐกิจหลัก

 Source: IEA (2012)
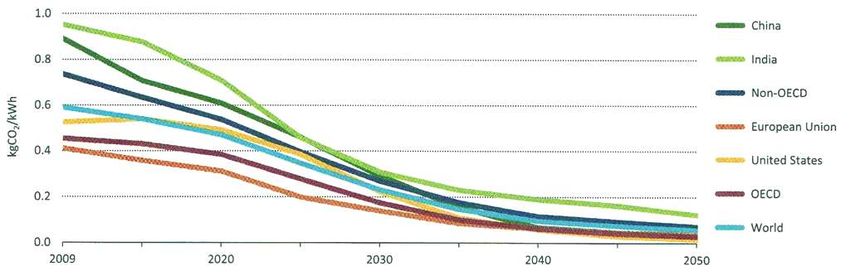
• CO2 Intensity ของภำคผลิตไฟฟ้ำ (g/kWh) จะต้องลดลงเหลือเพียง 60
  g/kWh ในปี ค.ศ. 2050 จึงจะช่วยรักษำระดับอุณหภูมิโลกไม่ให้เพิ่มขึ้นเกิน 2
  องศำ (สำหรับประเทศไทย ณ ปัจจุบันอยู่ที่ระดับประมำณ 0.5 kg/kWh)

  Source: IEA (2012)
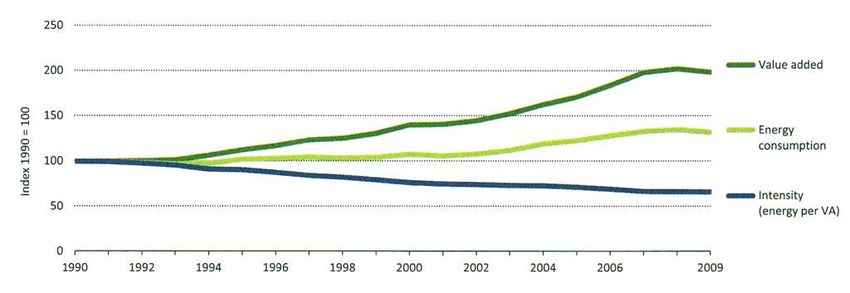
Decoupling GHG emissions: Need of transformational changes
• World Energy Intensity ในภำคอุตสำหกรรมได้ลดลงอย่ำงต่อเนื่องประมำณ
  2% ต่อปี (1990-2009)

   Source: IEA (2012)
Transport between 2DS and 4DS

Source: IEA (2014)
Today decision effects future emissions and the lock-in
• เทคโนโลยีผลิตไฟฟ้ำกังหันแก๊ส ต้องลดระดับกำรผลิต (Capacity Factor) ใน
  กำรผลิตไฟฟ้ำในปี 2050 เพื่อบรรลุเป้ำหมำย 2 องศำ (ส่วนในกรณี 4 องศำ
  เทคโนโลยีผลิตไฟฟ้ำกังหันแก๊ส จะกลำยเป็น Base-load)

       2010           2020        2030          2040         2050

 Source: IEA (2012)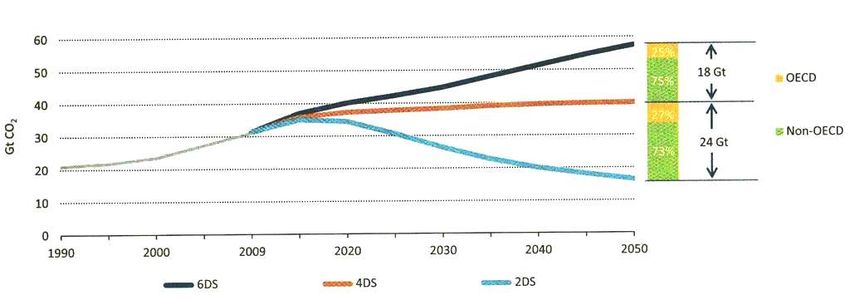
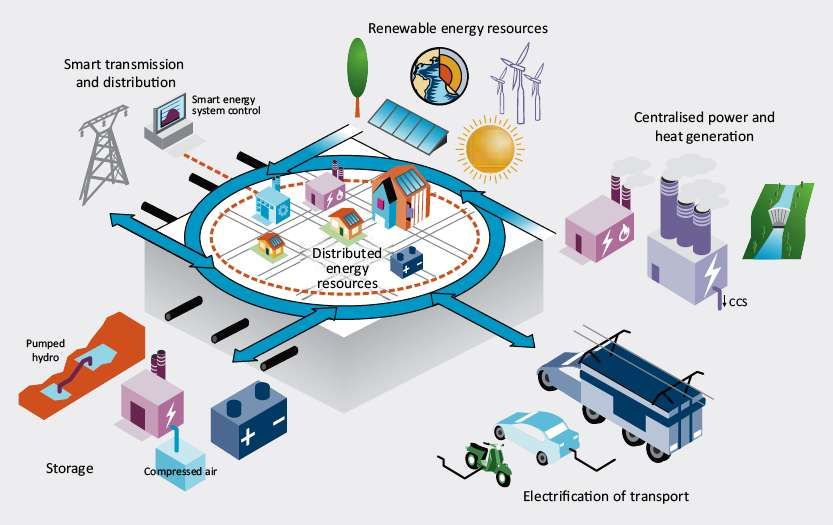
Integrated electricity systems of the future

Source: IEA (2014)
9
ภาพรวมการลดก๊าซของภาคเศรษฐกิจในการบรรลุเป้าหมาย 2DS ในปี 2050

  Source: IEA (2014)
ภาพรวมเทคโนโลยีที่จะช่วยบรรลุเป้าหมาย 2 องศา ในปี 2050

Source: IEA (2014)
Scope of commitments
Greenhouse gas (GHG) emission reduction targets
● Absolute or relative economy-wide emission targets
● Absolute or relative sectoral targets
Other quantifiable targets
● Energy intensity targets (eg, EEDP targets at 25% reduction)
● Renewable energy targets (eg, AEDP25%)
● Area to be afforested
● Other technology targets
Commitment to implement policies
Emission price commitments
Technology-oriented agreements
Commitment to implement individual actions and projects13
UNFCCC negotiation track
1997 1999 2001 2003 2005 2007 2009 2011 2013 2015 2017 2019
1997 2005 2008
Signing Kyoto
Protocol
Enter into 1st
forces
commitment 2nd commitment Period
Period
AWG-KP
Kyoto Protocol result-based
2020
emission reduction targets 2009 2012
1st Commitment = “reduce
AWG
GHG emissions to an average of LCA
5% against 1990 levels”
Post 2020
Regime
2nd Commitment = “request a
2015 2020
global reduction of 18% of Adoption of Enter into
emission compared with the 2011 New agreement forces
baseline reference (mainly 1990)” ADP
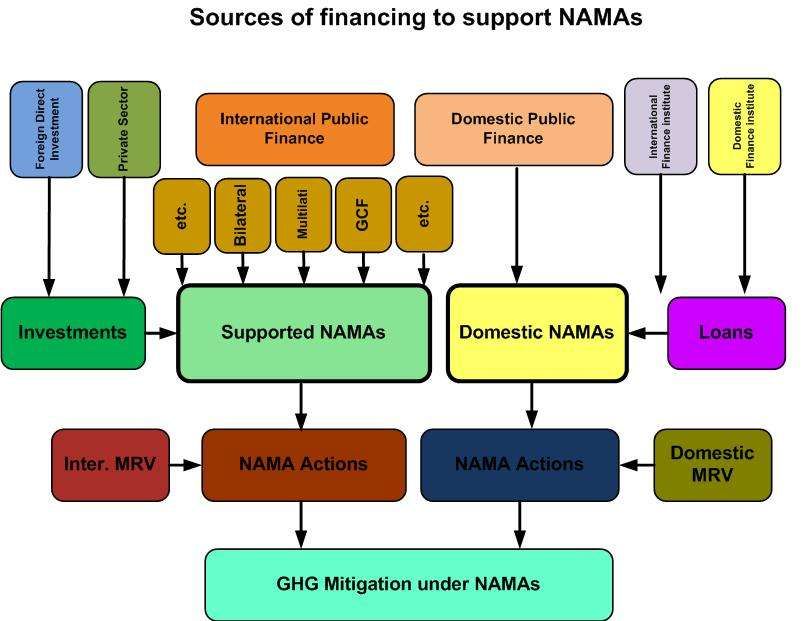
Some NAMAs activity-based
commitmentsSIIT-TU 14
ความแตกต่ างของ INDC, NAMAS & CDM
CDM Pre2020 - NAMAs Post2020 - INDC
CDM projects are driven by NAMAs are mainly driven by INDCs are mainly driven
firms involved in carbon market national governments by national policy
CDM is at project level. NAMAs are of policies, INDCs are mainly of
Programmatic CDM (PoAs) is strategies, and programmes policies
closer to NAMA concept
CDM has strict rules for testing So far, no additionality No additionality
additionality determination of NAMAs exist,
but Incremental NAMAs costs
CDM has stringent MRV NAMAs MRV could vary
requirement significantly, depending on the
nature of activity and funds.
Key purpose of CDM is carbon NAMAs will not necessary result
credit in emission creditsPre 2020: developed country ambition First Commitment period (2008 – 2012) “reduce GHG emissions to an average of 5% against 1990 levels” Second commitment period (2013-2020) “Quantified Emission Limitation and reduction commitments (QELRCs); request a global reduction of 18% of emission compared with the baseline reference (mainly 1990)” Copenhagen accord; developed country submitted to the UNFCCC secretariat the “Quantified Economy-wide Emission Targets for 2020”
Pre 2020: developed country pledges
  Annex I         Quantified economy-wide                 Base   Economy-wide emissions,
  Parties
                  emissions targets for 2020              year   relative to base year*

 EU           20% / 30% As part of a global and           1990   Advantages
              comprehensive agreement for the period             • High confidence regarding
              beyond 2012,                                          future emissions levels (if
 Japan        25% reduction, which is premised on         1990      commitments are met)
                • the establishment of a fair and
                  effective international framework              • Simplifies emissions trading
                  in which all major economies
                  participate and
                • on agreement by those economies
                                                                 Disadvantages
                  on ambitious targets.                          • Does not take into account
  US          In the range of 17%, in conformity          2005      changing economic
              with anticipated U.S. energy and
              climate legislation, recognizing that the
                                                                    conditions (case of Japan)
              final target will be reported to the
              Secretariat in light of enacted
              legislation.¹

*OECD climate change expert group paper No.2013(3)                                                16
Pre 2020: developing country ambition “Without a reduction commitment” Developing countries to earn certified emission reduction (CER) credits from CDM project, CERs can be traded and sold, and used by industrialized countries to a meet a part of their emission reduction targets under the Kyoto Protocol. Bali Action Plan; developed country submitted to the UNFCCC secretariat the “Appropriate Nationally Mitigation Actions (NAMAs) ”
NAMAs Status Update
55 Parties and African Group have submitted NAMAs
(UNFCCC; FCC/SBI/2013/INF.12/Rev.2)
Climate Summit 2014 (23 Sep) Najib Razak said that
“Malaysia plans to cut emissions 40 percent by 2020”
Regional overview of NAMA activity Sectoral overview of NAMA activity
18
*MitigationMomentum, 2014 NAMAs Status UpdatePre 2020: developing country pledges
NA I
Countries
NAMAs/Pledges GHG emissions per unit
GDP*
Lower CO2 emissions per
unit of GDP by 40 - 45% by Advantages
2020 compared to the 2005 • Takes into account changing
China level by increasing the share economic conditions
of non-fossil fuels in the
primary energy Disadvantages
consumption. • Low confidence regarding future
emissions levels
• May lead to higher than expected
Reduce the emissions emissions if economic growth is
intensity of its GDP by 20- strong
India 25% by 2020 in comparison • May complicate emissions trading
to the 2005 level
*OECD climate change expert group paper No.2013(3) 19Types of of Mitigation Pledge
China’s projected CO2 intensity baseline and goal in 2020
Emissions intensity target is based GDP
on assumption that GDP rises faster
than emission CO2
GDP, tCO2
tCO2/GDP
Decision to reduce intensity by
(CO2/GDP)2005 X% from reference level
(CO2/GDP)2020
2018
2017
2005
2007
2009
2010
2011
2012
2013
2014
2008
2015
2006
2016
2019
2020
CO2 intensity is preferable when projected GDP is higher than CO2 such as
the case of China.
20Pre 2020: developing country pledges
Economy-wide GHG
AN I emissions, relative to a BAU
Parties NAMAs/Pledges Baseline*
Reduce emissions by 36.1% -
Brazil 38.9% below BAU by 2020 Advantages
Reduce emissions by 30% below • Can facilitate participation of
Mexico BAU in 2020. developing countries
• Can be a first step towards other
Reduce emissions by 30% below commitment types
Korea BAU by 2020
South Reduce emissions by 34% below Disadvantages
BAU by 2020 • Low confidence regarding future
Africa emissions levels
Achieve a 20% deviation below • May complicate emissions trading
Chile BAU emission growth trajectory • Can have lower transparency
by 2020 • May complicate MRV
*OECD climate change expert group paper No.2013(3) 21Pre 2020: developing country pledges
NA I NAMAs/ Pledge Commitments expressed in
Parties
terms of non-GHG metrics*
Achieve carbon neutrality as a
Maldives
country by 2020. Advantages
Cambodia has been implementing a • Can facilitate participation of
pilot project within the framework of developing countries
Reducing Emissions from • Can focus on co-benefits and
Deforestation and Forest parts of the economy over which
Cambodia government has greater control
Degradation in Developing countries
(REDD) since 2009, as part of its
responsibility in tackling climate Disadvantages
change • Low confidence regarding future
emissions levels
• May complicate emissions trading
Costa Long-term pledge to become carbon
Rica’s neutral.
*OECD climate change expert group paper No.2013(3) 22Pre 2020: developing country pledges
Annual GHG emissions from
NA I NAMAs/ Pledge one or multiple sectors,
Parties
relative to a base year*
Pledge to increase forest
Tunisia cover from 12.8% in 2009 to 16% Advantages
by 2020. • High confidence regarding future
Pledge to increase emissions levels from covered
Ghana the share of renewables in the total sectors (but not uncovered
energy mix to 10-20% by 2020; sectors)
• Simplifies emissions trading
Pledge to increase the
Colombia share of biofuels in national fuel Disadvantages
consumption to 20% by 2020. • Possibility of inter-sector leakage,
if production shifts to an
uncovered sector
• Does not address all emissions
from an economy
*OECD climate change expert group paper No.2013(3) 23Summary of 2020 Pledge Types
Thailand pre 2020 Actions
Thailand is Non Annex I countries “Without a
reduction commitment” under Kyoto Protocol
Thailand earn certified emission
reduction (CER) credits from CDM
project. CERs issued from 41 project,
6,520,024 tCO2e (TGO, as of July 2014)
Thailand is under the implementation of
NAMAs
2520%
26NAMA Pledge
• Baseline, BAU level of GHG emissions & Reduction Goal
Reduction goal
Against BAU baseline
Absolute increase
From 2005
Emission tCO2
2018
2017
2005
2007
2009
2010
2011
2012
2013
2014
2015
2008
2006
2016
2019
2020
SIIT-TU 27จานวนโรงไฟฟ้านิวเคลียร์ ท่ กี าลังก่ อสร้ างในปั จจุบนั
ประเทศ จานวนทั้งสิ้น = 68
CHINA 28
RUSSIA 11
KOREA 5
JAPAN 3
PAKISTAN 2
SLOVAKIA 2
UKRAINE 2
AGENTINA, BRAZIL, FINLAND, FRANCE, 1 (each)
USA, UAE, etc
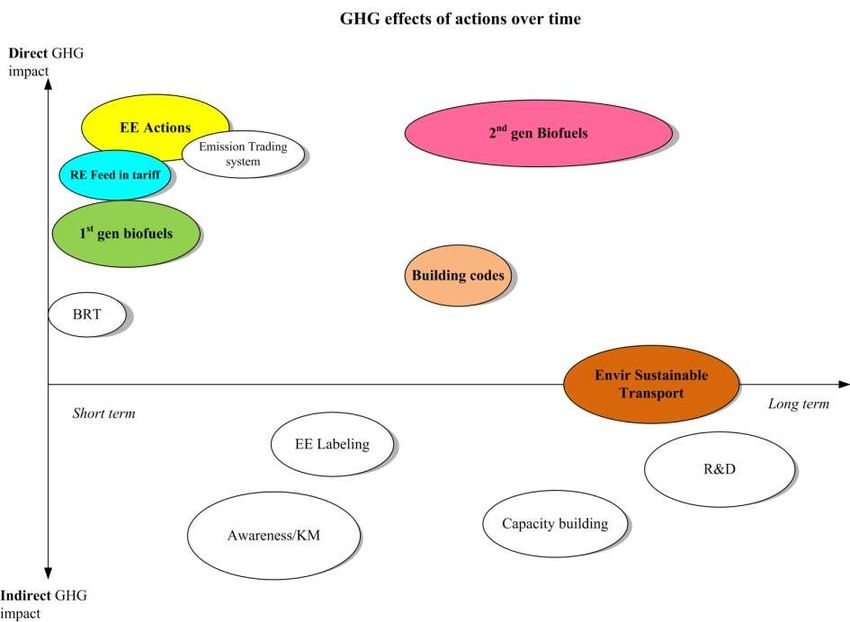
As of December 2013Thailand’s Mitigation Potential
CO2 Counter-measures for low-carbon green growth
• Renewable & Alternative Energy: Biomass, biogas, hydro, Solar,
Wind, Waste-to-energy etc.
• Energy Efficiency Improvement in Industries, Buildings,
Transportation and Power Generation.
• Bio-Fuels in Transportation.
• Environmental Sustainable Transport System.
“…..Thailand will lower CO2 emissions in the range of 7-
20% in 2020 when compared to the BAU
(if international supports are included ).....
+ UNFCCC convention”
2930
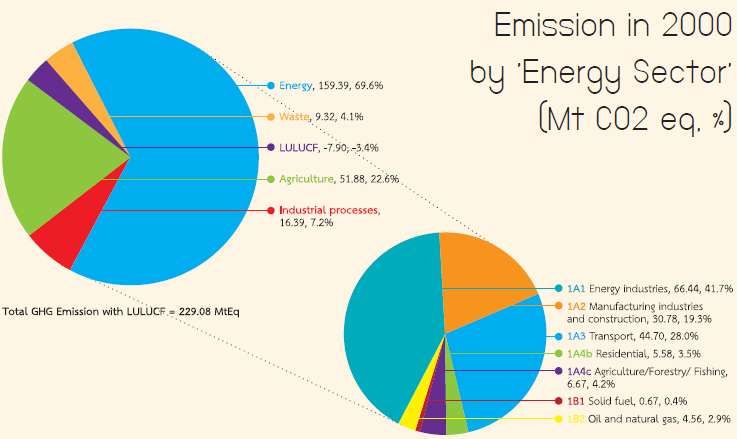
Thailand CO2 emissions by sectors in 2000

 Source: Thailand’s Second National Communication, (ONEP, 2011)
                                                                  31
CO2 Emissions in the BAU and NAMA; 7% in 2020
Total CO2 emissions (kt-CO2)
400,000
360 Mt
350,000
BAU
300,000
7% or 25 Mt
250,000
200,000
Recent Assessment with MRV in 2014
150,000
100,000
50,000
0
2005 2006 2007 2008 2009 2010 2011 2012 2013 2014 2015 2016 2017 2018 2019 2020Estimated CO2 Reduction by RE Electricity in RE Plan
CO2 Reduction (kt-CO2)
AEDP25% Actual Forecast
30,000
Forecasted 25,585
25,000 23,491
(kt-CO2)
21,335
20,000 19,458
17,579 17,266
15,847
15,000 14,132
12,412
10,705
10,000 8,906
7,095
5,000
0
2554 2555 2556 2557 2558 2559 2560 2561 2562 2563 2564
(2011) (2012) (2013) (2014) (2015) (2016) (2017) (2018) (2019) (2020) (2021)Estimated CO2 Reduction by Bio-oil in RE Plan
kt-CO2 AEDP25% Actual Forecast
7,000
Forecasted 6,199
6,000
5,263 5,450
ปริมาณการลด CO2 (kt-CO2)
5,204
5,000 4,869 4,899
4,603
4,000 3,657 4,061
3,431 3,194
3,000
2,000 1,596
1,000
-
2550 2551 2552 2553 2554 2555 2556 2557 2558 2559 2560 2561 2562 2563 2564
(2007) (2008) (2009) (2010) (2011) (2012) (2013) (2014) (2015) (2016) (2017) (2018) (2019) (2020) (2021)การประมาณการณ์ผลสัมฤทธิ์ของแผน AEDP 25% จากการใช้เชื้อเพลิงชีวภาพในสาขาขนส่ง
กำรพยำกรณ์กำรลดกำรปลดปล่อยก๊ำซ CO2 จำกำรใช้เอทำนอลและเปรียบเทียบกับแผน AEDP25%
AEDP25% Actual Forecast
8,000
7,000 7,166
ปริมาณการลด CO2 (kt-CO2)
6,000 5,176
5,000
3,981
4,000 3,185
3,000 2,389 2,707
1,831 2,070
2,000 1,433 1,672
1,000
-
2548 2550 2552 2554 2556 2558 2560 2562 2564
(2005) (2007) (2009) (2011) (2013) (2015) (2017) (2019) (2021)ผลสัมฤทธิ์ของการลดก๊าซเรือนกระจกตั้งแต่เริม่ ใช้ นโยบาย/มาตรการ/แผนงาน/
โครงการ EE จนถึงปีปัจจุบัน หน่วย: kt-CO2
ปริมาณก๊าซเรือนกระจกที่ลดลงได้จากนโยบาย/มาตรการ/แผนงาน/โครงการ
ปี
RE ไฟฟ้า Gasohol Biodiesel EE* TOTAL
๒๕๔๔ - - ๐ - ๐
๒๕๔๕ - - ๐ - ๐
๒๕๔๖ - - ๐ - ๐
๒๕๔๗ - - ๑ - ๑
๒๕๔๘ - ๑๔๗ ๒ - ๑๔๙
๒๕๔๙ - ๒๗๙ ๗ ๑๓๒ ๔๑๘
๒๕๕๐ - ๓๘๕ ๑,๐๖๐ - ๑,๔๔๕
๒๕๕๑ ๒,๘๐๘ ๗๔๑ ๑,๒๕๙ - ๔,๘๐๘
๒๕๕๒ ๓,๒๕๒ ๙๗๖ ๑,๖๕๘ ๑๒๒ ๖,๐๐๘
๒๕๕๓ ๓,๖๓๘ ๙๕๙ ๑,๘๗๘ ๒๘๐ ๖,๗๕๕
๒๕๕๔ ๔,๐๑๒ ๙๓๔ ๒,๓๔๒ - ๗,๒๘๘
๒๕๕๕ ๕,๐๐๑ ๑,๐๓๑ ๒,๕๐๐ ๕๔ ๘,๕๘๖
๒๕๕๖ ๖,๓๖๕ ๑,๘๖๐ ๒,๕๓๐ ๘๗ ๑๐,๘๔๒
หมำยเหตุ *ปริมำณก๊ำซเรือนกระจกที่ลดลงจำกกำรอนุรักษ์พลังงำนรวบรวมข้อมูลจำกโครงกำรเงินหมุนเวียนเพื่อกำรอนุรักษ์พลังงำนและพลังงำน
ทดแทน และโครงกำรส่งเสริมกำรลงทุนด้ำนอนุรักษ์พลังงำนและพลังงำนทดแทนเท่ำนั้น 36Scope of INDCs (post 2020 contributions)
What is an "intended contribution" – should it cover
mitigation, adaptation, finance, technology development and
transfer, transparency of action and support, and capacity-
building? (Para 5, Decision 1/CP17 Establishment of ADP)
All Parties seem to accept INDCs should cover mitigation
However, for some:
◦ Parties can also come forward with adaptation and financial and
other support in INDCs if they want (US, Umbrella Group,
Singapore); or
◦ INDCs should also have that wider scope for all Parties
(progressive South American countries, "like-minded" developing
countries, Africa Group)
37DRAFT Text by the Co-Chairs:
“INDCs of Parties in the context of the 2015 agreement” will be
discussed ahead of October session (20-25 Oct 2014)
Annex Information on INDCs of Parties
Information relating to mitigation
Option 1 (All parties should submit)
o Type of mitigation contribution; o Baseline emissions and related
o Time frame or time period assumptions and methodologies,
o Base year; including methods for the
o Coverage in terms of: projection of carbon intensity of
o Geographical boundaries, GDP;
o Sectors, Greenhouse gases, o A quantification of expected
o Percentage of total/national emission reductions, including
emissions covered. estimates with and without land use,
land-use change and forestry; 38Annex Information on INDCs of Parties
Information relating to mitigation
Option 1 (All parties should submit ) con.
o Annual estimated reduction in o Approach to accounting for
emissions intensity of the the land-use sector;
economy; o Estimated macro-economic
o Methodologies, emission factors and marginal costs of
and metrics used, including global achieving the commitments
warming potentials in accordance or targets, describing the
with the relevant decisions of the methods used to estimate
Conference of the Parties; them;
o An indication of additional
o Peaking year;
mitigation action to be
o Expected use of international
achieved through the
market mechanisms, including how
provision of support.
double counting is avoided; 39Option 2
Developed country Parties and other Parties included in
Annex I to the Convention
Using the relevant common tabular format for submitting such
information, as provided for “UNFCC biennial reporting guidelines for
developed country Parties”
Parties not included in Annex I to the Convention
(developing country Parties)
Information relevant to their enhanced action to implement the
Convention, subject to the provision of support from, inter alia,
developed country Parties in accordance with nationally determined
actions, indentified support, description of domestic MRV
arrangement.
40UNFCCC Negotiation
1-12 Dec COP20 Peru
ADP identify the information -INDCs, hi-level 30 Nov-11Dec 15
Ministerial, draft TEXT for 2015 Agreement COP21 Paris
Adoption of 2015
Agreement
23 Sep
UNSG climate
summit in NY
2014 Jul‘14 Aug’14 Oct’14 Dec’14 Feb’15 Apr’15 Jun’15 Aug’15 Oct’15 2015
2-14 Jun 15-18 Oct
ADP 2-5, SB40 Pre COP Ministerial 31 Aug 15
Ministerial Meeting, Possible all parties to
Bonn, Germany be communicated
20-25 Oct INDCs
ADP 2-6, additional session, draft
negotiation TEXTs
Bonn, Germany
41What will Thailand’s post 2020
contributions look like?
42Thank you
Thailand’s INDC Study
Team 1: Mitigation Planning
1. Dr. Bundit Limmeechokchai (SIIT-TU)
2. Dr. Chontichaprin Nithitsuttibuta (UNDP Coordinator)
3. Dr. Sujeetha Selvakkumaran (SIIT-TU)
Team 2: Preparatory Planning & Adaptation
1. Dr. Buntoon Srethasirote (GSEI)
2. Dr. Chalotorn Kansuntisukmongkol (ECON-TU)
43You can also read