Sharing Our Data-An Overview of Current (2016) USGS Policies and Practices for Publishing Data on ScienceBase and an Example Interactive Mapping ...
←
→
Page content transcription
If your browser does not render page correctly, please read the page content below

Prepared in cooperation with the Community for Data Integration

Sharing Our Data—An Overview of Current (2016) USGS
Policies and Practices for Publishing Data on ScienceBase
and an Example Interactive Mapping Application

Open-File Report 2016–1202

U.S. Department of the Interior
U.S. Geological Survey
Sharing Our Data—An Overview of Current
(2016) USGS Policies and Practices for
Publishing Data on ScienceBase and an
Example Interactive Mapping Application

By Katherine J. Chase, Andrew R. Bock, and Roy Sando

Prepared in cooperation with the Community for Data Integration

Open-File Report 2016–1202

U.S. Department of the Interior
U.S. Geological Survey

U.S. Department of the Interior
SALLY JEWELL, Secretary

U.S. Geological Survey
Suzette M. Kimball, Director

U.S. Geological Survey, Reston, Virginia: 2017

For more information on the USGS—the Federal source for science about the Earth, its natural and living
resources, natural hazards, and the environment—visit http://www.usgs.gov or call 1–888–ASK–USGS.
For an overview of USGS information products, including maps, imagery, and publications,
visit http://www.usgs.gov/store.usgs.gov/.

Any use of trade, firm, or product names is for descriptive purposes only and does not imply endorsement by the
U.S. Government.

Although this information product, for the most part, is in the public domain, it also may contain copyrighted materials
as noted in the text. Permission to reproduce copyrighted items must be secured from the copyright owner.

Suggested citation:
Chase, K.J., Bock, A.R., and Sando, Roy, 2017, Sharing our data—An overview of current (2016) USGS policies and
practices for publishing data on ScienceBase and an example interactive mapping application: U.S. Geological Survey
Open-File Report 2016–1202, 10 p., https://doi.org/10.3133/ofr20161202.

ISSN 2331-1258 (online)
iii

Acknowledgments

The data used for the example in this report were generated under a project funded by the
Plains and Prairie Potholes Landscape Conservation Cooperative and the Bureau of Land Man-
agement. The authors appreciate the support of those agencies.

The authors also thank colleague reviewers Drew Ignizio, Tamar Norkin, and John Risley for
their edits and suggestions that greatly improved this report.
iv
Contents
Abstract............................................................................................................................................................1
Introduction.....................................................................................................................................................1
Purpose and Scope........................................................................................................................................2
Publishing Data on Sciencebase.................................................................................................................2
ScienceBase and ScienceBase Items...............................................................................................2
Data Management Plan........................................................................................................................3
Data Formats..........................................................................................................................................3
Metadata.................................................................................................................................................3
The Information Product Data System and Data and Metadata Review.....................................3
Data and Metadata to ScienceBase..................................................................................................4
Science Data Catalog...........................................................................................................................4
Creating Interactive Maps............................................................................................................................5
ScienceBase Geospatial Services.....................................................................................................5
Using R, Sbtools, Shiny, and the Leaflet R Package to Interact with ScienceBase
Resources .................................................................................................................................5
Example—Maps Showing Simulated Changes in Streamflow for Seven Montana
Watersheds...............................................................................................................................6
Data Release Used for this Example.........................................................................................6
Preparation of Shapefiles, Data, and Metadata......................................................................6
Creating an Interactive Map Using R........................................................................................6
Accessing the Data Using Sbtools...................................................................................6
Manipulating the Data........................................................................................................6
Mapping the Data Using Leaflet........................................................................................7
Building the User Interface Application Using Shiny....................................................8
Documenting the R code using R Markdown and Hosting the R Code in
Bitbucket..................................................................................................................8
Other Mapping Options.......................................................................................... 8
Lessons Learned, Limitations and other Considerations.........................................................................9
Summary..........................................................................................................................................................9
References Cited..........................................................................................................................................10
Figures
1. Flow chart showing current (2016) workflow for preparing a ScienceBase data
release.............................................................................................................................................2
2. Screen capture showing example of a ScienceBase item....................................................4
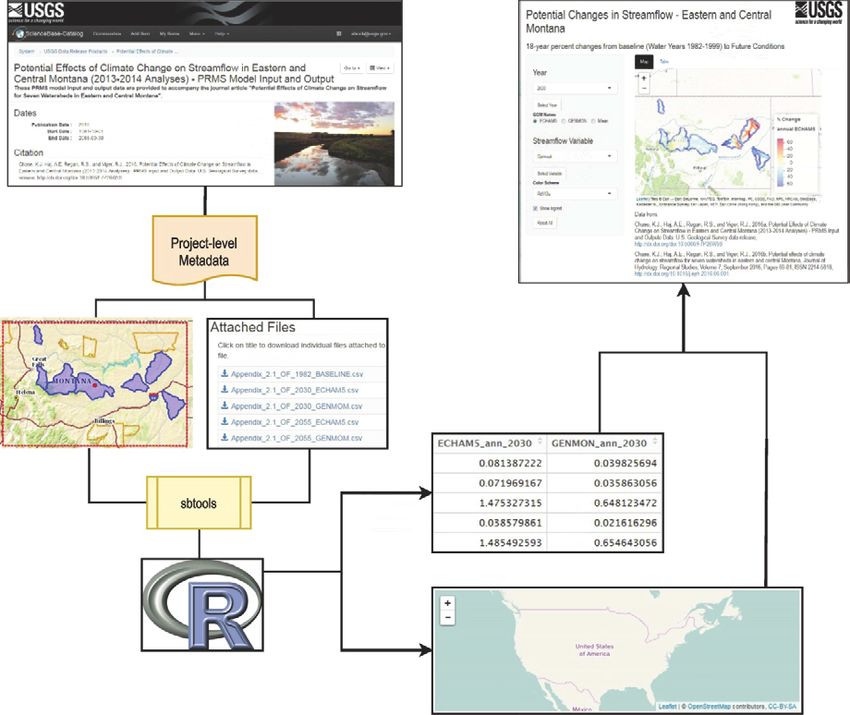
3. Flowchart illustrating creation of an interactive map using a ScienceBase data
release.............................................................................................................................................7
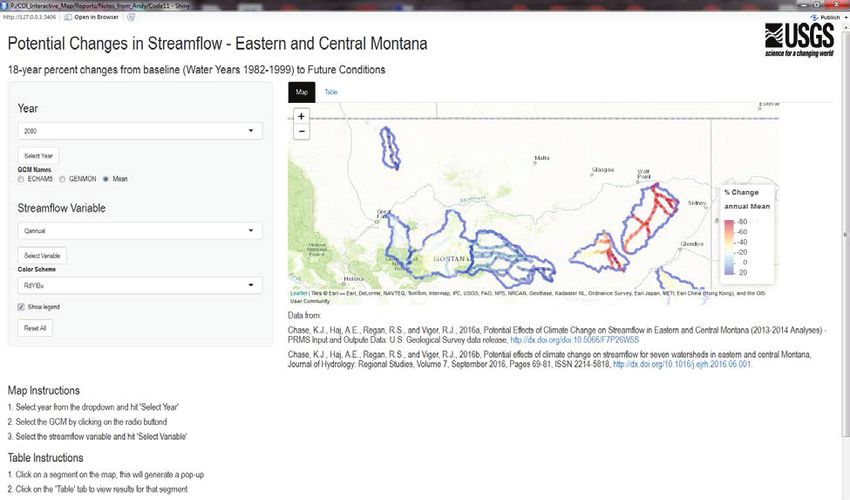
4. Example of an interactive map showing simulated changes in streamflow for
seven watersheds in Montana generated using data released on ScienceBase.............8v Abbreviations API application program interface ASCII American Standard Code for Information Interchange CDI Community for Data Integration CIDA Center for Integrated Data Analytics CRAN Comprehensive R Archive Network CSAS&L Core Science Analytics, Synthesis and Libraries CSS cascading style sheets CSV comma separated value DOI digital object identifier FGDC Federal Geographic Data Committee FSP Fundamental Science Practices GCM General Circulation Model GIS geographical information system HTML hypertext markup language IM Instructional Memorandum IPDS Information Product Data System KML keyhole markup language NetCDF network common data form OGC Open Geospatial Consortium OWI Office of Water Information PDF portable document format REST representational state transfer SD service definition SDC Science Data Catalog URL uniform resource locator USGS U.S. Geological Survey WFS Web Feature Services WMC Web coverage services WMS Web mapping services XML extensible markup langua
Sharing Our Data—An Overview of Current (2016)
USGS Policies and Practices for Publishing Data on
ScienceBase and an Example Interactive Mapping
Application
By Katherine J. Chase, Andrew R. Bock, and Roy Sando

Abstract                                                           find guidance about organizing, sharing, and displaying data
                                                                   through interactive maps.
      This report provides an overview of current (2016) U.S.            USGS Fundamental Science Practices (FSP) policies
Geological Survey policies and practices related to publish-       were established in 2006 to ensure the quality and integrity of
ing data on ScienceBase, and an example interactive mapping        USGS science activities. All USGS data intended for public
application to display those data. ScienceBase is an integrated    release are subject to rigorous FSP review, approval, and
data sharing platform managed by the U.S. Geological Survey.       release requirements (http://www.usgs.gov/fsp/). Fundamen-
This report describes resources that U.S. Geological Survey        tal Science Practices requirements have been recently (2015)
Scientists can use for writing data management plans, format-      revised to incorporate release of scientific data and metadata
ting data, and creating metadata, as well as for data and meta-    (http://www.usgs.gov/fsp/faqs_datarelease.asp, https://www2.
data review, uploading data and metadata to ScienceBase, and       usgs.gov/fsp/guide_to_datareleases.asp).
sharing metadata through the U.S. Geological Survey Science              ScienceBase is a collaborative scientific data and infor-
Data Catalog. Because data publishing policies and practices       mation management platform developed and maintained
are evolving, scientists should consult the resources cited in     by the USGS (https://www.sciencebase.gov/about/content/
this paper for definitive policy information.                      about-sciencebase). ScienceBase is designed to provide sci-
      An example is provided where, using the content of a         entists and the general public access to scientific data, Bureau
published ScienceBase data release that is associated with an      resources, and other information through access using a Web
interpretive product, a simple user interface is constructed       browser, an application program interface (API), and through
to demonstrate how the open source capabilities of the R           representational state transfer (REST) -based Web services.
programming language and environment can interact with the         ScienceBase is one option for USGS researchers to use as a
properties and objects of the ScienceBase item and be used to      platform for posting finalized data release materials (reviewed
generate interactive maps.                                         data and associated metadata).
                                                                         This report describes resources that U.S. Geological
                                                                   Survey Scientists can use for writing data management plans,
                                                                   formatting data, and creating metadata, as well as for data and
Introduction                                                       metadata review, uploading data and metadata to ScienceBase,
                                                                   and sharing metadata through the U.S. Geological Survey
     The ways scientists view and share data are changing          Science Data Catalog. Because data publishing policies and
(Fristom, 2013; Tenopir and others, 2011; Tenopir and others,      practices are evolving, scientists should consult the resources
2015). New tools, such as Web map services available through       cited in this paper for definitive policy information.
U.S. Geological Survey (USGS) ScienceBase (https://www.                  For this report, simulated streamflow data published
sciencebase.gov/about/content/view-data-using-sciencebase-         on ScienceBase (Chase and others, 2016b) were used as an
web-map-services-wms), can be used to generate interactive         example illustrating one way to develop interactive maps.
maps. In addition, Federal and state agencies, universities,       Chase and others (2016a, b) estimated streamflow for base-
and other organizations are working together to make water         line and future conditions for select locations in eastern and
resources data more accessible and interconnected through          central Montana, using temperature and precipitation data
groups such as the Advisory Committee on Water Information         from a gridded data set representing baseline conditions and
(http://acwi.gov/spatial/owdi/). However, it can be difficult to   from three different General Circulation Models (GCMs). The
                                                                   data were summarized in static plots, maps, and tables in the
2 Sharing Our Data—An Overview of Current (2016) USGS Policies and Practices for Publishing Data on ScienceBase
companion interpretive product (Chase and others, 2016a). review, and documentation of the data and metadata reviews
However, these large datasets could be better visualized with must be uploaded into the Information Product Data System
interactive maps, where a user could select a time period and (IPDS). After the data and metadata reviews are completed
GCM of interest to display. and reconciled, data and metadata are uploaded to Science-
Base, and the ScienceBase Team will create a digital object
identifier (DOI; a persistent identifier assigned to a digital
object—such as a report or published dataset—so that the
Purpose and Scope object can be located even if the object is moved). Finally,
after Bureau approval and publication, the metadata file
This report provides an overview of current (2016) U.S. associated with the data can be sent to the USGS Science Data
Geological Survey policies and practices related to publish- Catalog (discussed later in this section).
ing data on ScienceBase, and an example interactive mapping
application to display data associated with an interpretive
product. Because U.S. Geological Survey data publishing poli- ScienceBase and ScienceBase Items
cies and practices are evolving, scientists should consult the
resources cited in this paper for definitive policy information. ScienceBase (https://www.sciencebase.gov/about/) is a
In addition, USGS Web sites could change, and the informa- scientific data and information management platform where
tion, uniform resource locators (URLs), and email addresses USGS scientists can post data and enable permission-con-
provided in this report could be superseded. trolled shared access; items can be accessible only to a limited
number of users or made publicly available, as appropriate.
ScienceBase uses the basic informational unit of an “item”
to describe resources in the ScienceBase catalog. Items may
Publishing Data on Sciencebase describe datasets, projects, publications, maps, or other infor-
mational assets. All items share a core set of attributes based
U.S. Geological Survey scientists intending to publish on a standardized object model. Items can be used to store and
data on ScienceBase are encouraged to read through the Sci- share uploaded data, metadata, or links to online resources.
enceBase data release Web pages (https://www.sciencebase. Depending on how items are stored and structured within the
gov/about/content/data-release) and reference the workflow system, ancestral relationships between “parent items” (items
diagram (fig. 1). Before uploading data to ScienceBase, data that contain one or more other items) and “child items” (items
should be organized in a format and structure that will best that are located inside of another parent item) can be used to
lend itself to meet the needs of a project, and metadata should organize resources and present context. For example, a parent
be created. Data and metadata must undergo USGS-initiated
Figure 1. Current (2016) workflow for preparing a ScienceBase data release. From the ScienceBase Data Release Frequently
Asked Questions Web page at https://www.sciencebase.gov/about/content/data-release.Publishing Data on Sciencebase 3
folder can contain a child subfolder, and the child subfolder provided in USGS IM OSQI 2015-02 (http://www2.usgs.gov/
can be a parent item to a child record. usgs-manual/im/IM-OSQI-2015-02.html). For ScienceBase
data releases, metadata should be in XML format. Tools for
creating metadata are available on the USGS Data Manage-
Data Management Plan ment Metadata Web page (http://www2.usgs.gov/datamanage-
ment/describe/metadata.php). If more than one dataset will
Well-documented data are important to USGS scientists
be published, it is often advantageous to have a project-level
and cooperators, can be integrated more readily into projects
XML metadata record that describes the overall data release
and datasets, and are more legally and scientifically defensible
(including abstract information, keywords, and a general
than undocumented data (USGS Data Management Web site;
overview of the published data to provide context), as well as
http://www2.usgs.gov/datamanagement/index.php). Since
individual XML metadata records for each dataset or ordered
2006, USGS Fundamental Science Practices (https://www2.
assemblage of files that describe column values, analytical
usgs.gov/usgs-manual/500/502-2.html) have required docu-
methods, and details about appropriate use.
mentation of data collection and research activities. U.S. Geo-
For creation of metadata for the example used in this
logical Survey Instructional Memorandum (IM) OSQI 2015-
report, we used the Online Metadata Editor (https://www1.
01 (http://www2.usgs.gov/usgs-manual/im/IM-OSQI-2015-01.
usgs.gov/csas/ome/), which lists simple questions about a
html), released February 19, 2015, provides guidance for
dataset and then produces a metadata record in the Federal
managing and sharing data and establishes requirements that
Geographic Data Committee (FGDC) Content Standard for
all projects initiated on or after October 1, 2016, have Data
Digital Geospatial Metadata (http://www.fgdc.gov/csdgm-
Management Plans, which help ensure that data published by
graphical/index.html), based on the user input. In addition,
the USGS are well-documented and archived.
the metadata reviewer for the example used in this report (see
The Data Management Plan should be produced during
the section “The Information Product Data System and Data
project scoping and should be included in the proposal. The
and Metadata Review” below) used the USGS Geospatial
plan should describe data handling throughout the data lifecy-
Metadata Validation Service (http://geo-nsdi.er.usgs.gov/vali-
cle, including data acquisition, data processing and analyzing,
dation/) to check the metadata. An open-source word proces-
data preservation, and data publication and sharing. The USGS
sor, such as Notepad++ (https://notepad-plus-plus.org), with
Data Management Web site (http://www2.usgs.gov/dataman-
an XML formatting plug-in, such as XML Tools (http://docs.
agement/index.php) offers detailed information, templates, and
notepad-plus-plus.org/index.php?title=Plugin_Development),
checklists to help project managers create and maintain data
can be used to edit metadata files after they have been created.
management plans.
XML Notepad is another free editing tool that can be used to
check, view, and edit metadata (https://www2.usgs.gov/data-
Data Formats management/documents/InstructionsXMLNotepad.pdf).
As described in the 2013 Open Data Policy memo-
randum from the U.S. Office of Management and Bud- The Information Product Data System and Data
get (https://www.whitehouse.gov/sites/default/files/omb/ and Metadata Review
memoranda/2013/m-13-13.pdf) and the Data and File Formats
page on the USGS Data Management Web site (https://www2. Per USGS IM OSQI 2015-03 (http://www2.usgs.gov/
usgs.gov/datamanagement/plan/dataformats.php), non-spatial usgs-manual/im/IM-OSQI-2015-03.html), which “provides
data should be in open, machine-readable formats, such as requirements and procedures for review and approval of scien-
comma separated value (CSV), extensible markup language tific data prior to release or dissemination,” at least two USGS-
(XML), text, or American Standard Code for Information initiated reviews are required for a data release; one review
Interchange (ASCII). Spatial data should be formatted as of the data and one review of the metadata. Both reviews can
shapefiles, geodatabase feature classes, rasters, or network be by the same person, or one person can review the data and
common data form (NetCDF) files. Recommended formats another can review the metadata. However, reviewing the data
for spatial data are discussed further in the section “Creating and metadata together is best, as this helps ensure that the
Interactive Maps.” documentation adequately and accurately describes the data
and that there are no discrepancies between the two. Guid-
ance for checking metadata with data can be found on the
Metadata USGS data management Web site: https://www2.usgs.gov/
datamanagement/documents/CheckingMetadataWithData.pdf.
Metadata (data about data) are required for all USGS The metadata and data reviews must be placed in the USGS
scientific data products. Metadata files include documentation Information Product Data System (IPDS; https://ipds.usgs.
that describes a data resource, how it was produced, and other gov/WPP/Home.aspx), under the product type “Data Release.”
relevant information related to understanding its appropri-
ate use. Policy regarding USGS metadata requirements is4 Sharing Our Data—An Overview of Current (2016) USGS Policies and Practices for Publishing Data on ScienceBase
Data and Metadata to ScienceBase USGS) to access and edit the ScienceBase items. In addition,
an anonymous link can be created for unauthorized individuals
Scientists wishing to publish data on ScienceBase can outside of the USGS (such as colleague reviewers) to access
reference the current (2016) workflow (fig. 1) and initi- the data. Current (2016) information about these options and
ate contact with the ScienceBase Team by filling out a Data much more can be found on the ScienceBase Data Release
Release Submission Form (link available on the Data Release Instructions Web page (https://www.sciencebase.gov/about/
Instructions Web page https://www.sciencebase.gov/about/ content/data-release).
content/data-release; note that the ScienceBase Team is cur-
rently (2016) working on a Web application to replace the
Data Release Submission Form). The ScienceBase Team Science Data Catalog
can assist authors with establishing an item in the system to
The USGS Science Data Catalog (SDC; http://data.usgs.
store the data (fig. 2), and acquiring a digital object identifier
gov/datacatalog/), developed by USGS Core Science Analyt-
(DOI) that will resolve to the ScienceBase item and serve as
ics, Synthesis and Libraries (CSAS&L; https://www2.usgs.
permanent way to reference the data resource. The data and
gov/core_science_systems/csas/), is a searchable clearing-
metadata will not be publicly accessible until the data release
house for XML metadata records that describe USGS data
is approved and published. During the period when the data
resources and specify where they can be obtained. The SDC is
release is in progress, the author can set up permissions for
separate from ScienceBase, and data do not reside in the SDC.
USGS individuals (and authorized individuals outside the
Figure 2. Example of a ScienceBase item (Chase and others, 2016b).Creating Interactive Maps 5
The XML metadata file associated with data on ScienceBase Applications that use the KML format include Google Earth
can be sent to the SDC from ScienceBase. This metadata and ArcGIS Explorer.
record can then be searchable in the SDC and provide a direct If ScienceBase geospatial or map services are needed,
link back to the data in ScienceBase. Questions about the SDC shapefiles must include a projection (PRJ) file and rasters must
or about submitting XML metadata records can be emailed to be in the GeoTiff (TIF) file format (tagged image file format).
sciencedatacatalog@usgs.gov. For faster map service operability the projection should be
in a geographic coordinate system (as opposed to a projected
coordinate system). The Web Mercator WGS84 coordinate
system (http://spatialreference.org/ref/epsg/wgs-84/) is used
Creating Interactive Maps for many Web mapping applications (including Google and
ArcGIS Server). Ultimately, the coordinate system should be
Interactive maps can be created with data from Science- appropriate for the data, supported in the uses or applications
Base using ScienceBase geospatial services and relatively envisioned for the data, and well documented in the metadata,
simple programs with open-source capabilities such as R. with a projection (.prj) file included in the data.
Other options for serving interactive maps include Web
portals, interactive portable document format (PDF) files, and
Esri Story Maps. Using R, Sbtools, Shiny, and the Leaflet
R Package to Interact with ScienceBase
ScienceBase Geospatial Services Resources
ScienceBase offers users several choices of geospatial The ScienceBase application program interface (API)
services that can be used to display the shapefiles or spatial allows software or computer programs to interact program-
content of data releases. Users can upload shapefiles, rasters, matically with data and geospatial services on ScienceBase.
and geodatabases. In addition, ScienceBase supports ArcGIS R, sbtools, Shiny, and Leaflet are utilities that can be used to
mapping services through Service Definition (SD) files. Meth- leverage the ScienceBase API for interactive mapping.
ods for using these different formats can be found in the online R is a computer language and a free software environ-
ScienceBase documentation (https://www.sciencebase.gov/ ment for statistical computing and graphics (R Core Team,
about/content/sciencebase-geospatial-services). 2016). For the interactive maps used as an example for this
ScienceBase can generate both Web mapping services report, R was used to access and map the ScienceBase item (as
(WMS) and Web feature services (WFS) for an uploaded described in more detail below). R is supported by a number
shapefile containing vector data. A WMS allows a user to of USGS communities for data access and statistical analysis.
view the data in clients such as ArcGIS desktop, or a browser No licenses are required to run R.
application (Open Geospatial Consortium, Inc., 2006). It is R can be extended via packages, or sets of code, which
a ‘picture’ of the data, but the actual data are not included. are freely available at the Comprehensive R Archive Network,
On the other hand, a WFS provides feature level access to or CRAN (https://cran.r-project.org/mirrors.html). Scientists
geospatial data, and once properly connected with an appro- with little programming experience can download pack-
priate client, the data can be retrieved, updated, and modified ages and documentation for performing statistical analyses,
directly in GIS software (Open Geospatial Consortium, Inc., plotting, and mapping, and connect with other users through
2005). Clients that can access the WFS format include ArcGIS USGS-R, a community of support for R users (http://owi.usgs.
desktop, and various open source programs such as QGIS (an gov/R/). U.S. Geological Survey communities such as the
open source geographic information system, http://www.qgis. Office of Water Information (OWI; http://owi.usgs.gov/) and
org/en/site/) and R (R Core Team, 2016). For the example the Community for Data Integration (CDI; https://www2.usgs.
used in this report, Web Feature Services (WFS) were chosen gov/cdi/) have helped to develop a large number of tools and
because the data being mapped were vector data, and because packages using R for accessing USGS data (https://owi.usgs.
use of open source programs and USGS-supported tools (see gov/R/index.html; https://my.usgs.gov/bitbucket/projects).
discussion under “R, sbtools, Shiny, and the Leaflet R Pack- For this example, the USGS-R package sbtools (https://
age” below) best fit the project needs. github.com/USGS-R/sbtools), which contains code/libraries
Additional ScienceBase capabilities (not used in this that enable access to online data on ScienceBase, was used to
example or further discussed in this report) include WMS for access the data in ScienceBase. The sbtools package, devel-
raster data, Web Coverage Services (WCS) for raster data, oped and supported by the USGS OWI, allows access into the
and generation of keyhole markup language (KML) files (for ScienceBase Web service API, including attached data files,
both raster and vector data). Web Coverage Services for raster metadata, links to parent and child items and Web feature
files are analogous to Web Feature Services (WFS) for vector services (when available), as well as capabilities to manage or
data. The KML is an xml-based file format used to represent edit ScienceBase items.
geographic features (Open Geospatial Consortium Inc., 2009).6 Sharing Our Data—An Overview of Current (2016) USGS Policies and Practices for Publishing Data on ScienceBase
Shiny is a relatively lightweight (easier to learn and use Creating an Interactive Map Using R
than Hyper Text Markup Language [HTML] or JavaScript)
Web application framework for R for creating interactive Web This section describes the components of the interac-
applications (http://shiny.rstudio.com/). Shiny can be used tive map developed for this application using the R scientific
with a basemap obtained through the Leaflet R package to programming language (R Core Team, 2016). The user can
build an interactive mapping application that can be down- download the R scripts to their computer and run the scripts to
loaded to a user’s computer. Leaflet (http://rstudio.github.io/ create the interactive map used for this example. R was chosen
leaflet/) is an open-source JavaScript library for interactive for the map because the streamflow dataset to be mapped
maps. Scientists without Web development skills, but with (Chase and others, 2016b) is relatively simple, and because
some familiarity with R, can create maps using the Leaflet the USGS OWI develops and supports R tools. The size of the
R package and Shiny applications (https://rstudio.github.io/ intended audience of the application (probably less than about
leaflet/shiny.html). 50 users total, with only a few users accessing the application
at the same time) also contributed to the decision to use R.
For tools and interactive maps that incorporate more complex
Example—Maps Showing Simulated Changes datasets and are intended for much larger distribution, other
in Streamflow for Seven Montana Watersheds approaches might be more appropriate. For examples of other
approaches see Blodgett (2013) and the Wyoming Landscape
Data Release Used for this Example Conservation Initiative Web site (https://www.wlci.gov/
wlciMapviewer/).
For our example, an interactive map application was The R scripts for the application have four specific com-
developed to display data from a previously published Sci- ponents (fig. 3). First, access points to the ScienceBase item
enceBase data release (Chase and others, 2016b). Chase and and the WFS associated with the stream segment shapefiles
others (2016b) includes simulated monthly streamflow data for from the geospatial fabric (Viger and Bock, 2014) are created
baseline and future conditions for seven watersheds in eastern through the R interface called sbtools (Winslow and others,
and central Montana. The data accompany a journal article 2016). Second, the CSV files in appendix 2 from the Chase
that documents the model and results (Chase and others, and others (2016b) ScienceBase data release are retrieved and
2016a). summarized as data objects within R. Third, a basic interactive
map using Leaflet (Cheng and Xie, 2016) is created to connect
the data objects with the WFS. And fourth, Shiny (Chang and
Preparation of Shapefiles, Data, and Metadata others, 2016), a java-based Web framework for R, is used to
The ScienceBase data release help materials (https:// create an interactive interface.
www.sciencebase.gov/about/content/data-release) include rec-
ommendations for structuring data releases as well as helpful Accessing the Data Using Sbtools
Frequently Asked Questions lists and answers. Scientists can
The sbtools package in R uses the ScienceBase item
consult with the USGS ScienceBase Team if they have any
ID to access the properties of a ScienceBase item. For our
questions regarding the recommendations.
example we used sbtools to reference the ScienceBase ID
The general instructions for loading shapefiles to Sci-
(5522bdf7e4b027f0aee3d039) of Chase and others (2016b).
enceBase are available on the ScienceBase Geospatial services
Then, we used sbtools to retrieve the model output files in
Web page (https://www.sciencebase.gov/about/content/sci-
appendix 2 of Chase and others (2016b), to call up the WFS
encebase-geospatial-services). Upon loading a zipped shape-
of the stream segments subset from the Upper Missouri
file to the ScienceBase page and then choosing the “unzip”
Region (Hydrologic Region 10U) of the Geospatial Fabric for
option, ScienceBase automatically recognizes the shapefile
National Hydrologic Modeling (Viger and Bock, 2014), and
extension, and creates spatial services in the Open Geospatial
to retrieve watershed boundaries of the seven watersheds from
Consortium (OGC) standard.
Chase and others (2016a) derived from hydrologic response
For the application described in this report, we used a
units of the Geospatial Fabric for National Hydrologic Model-
subset of 185 stream segments from Hydrologic Region 10U
ing within the same region (Viger and Bock, 2014). A key file
available from the Geospatial Fabric for National Hydrologic
that holds additional identification information for each stream
Modeling (Viger and Bock, 2014). These segments were used
segment is accessed locally by sbtools in the Shiny application
as the modeling units in Chase and others (2016a, b). The
directory (Streamsegments_Qchange_Buffer.csv).
shapefiles for the 185 stream segments are hosted as a child
item of Chase and others (2016b; https://www.sciencebase.
gov/catalog/item/5522bdf7e4b027f0aee3d039). Manipulating the Data
Each model output file is read directly from the source
into an R data object using the RCurl R package (Temple
Lang, 2016; https://cran.r-project.org/web/packages/RCurl/Creating Interactive Maps 7
4. Shiny Web Application
Web Feature Service Data from ScienceBase
2. Data Object in R
1.
3. Basemap by Leaflet
Figure 3. Flowchart illustrating creation of an interactive map using a ScienceBase data release, R, Leaflet, and Shiny.
From the ScienceBase data release, the Web feature service (WFS) containing the geographic entities, and data indexed
to the geographic entities are brought into R environment through the use of the sbtools package (1). The data can be
summarized and directly read as R data objects (2), and the WFS components can be incorporated into open source
basemaps (3) utilizing the leaflet library through R. The Shiny Web application framework (4) is then utilized to build a user
interface that connects the geographic entities to the underlying data objects summarized in R to allow a simple level of
user interaction.
RCurl.pdf). Each file includes simulated monthly streamflow (such as ESRI and GoogleMaps) use slightly different defini-
for baseline conditions and for future conditions for each tions of the WGS84 Web Mercator Auxiliary Sphere GCS
stream segment. The simulated data include four 18-year peri- (EPSG:3857), and many commonly used map tile services
ods; one baseline period (WY 1982 – 1999) and three future (including Leaflet) expect coordinates of vector features to be
periods (WYs 2021–38, 2046–63, and 2071–88) for multiple in latitude-longitude format.
GCMs (Chase and others, 2016a, b). For this application,
the authors summarized the time series for annual, seasonal, Mapping the Data Using Leaflet
and mean monthly streamflow at each segment for each time
The Leaflet widget used for this example displays poly-
period and for each GCM.
lines representing the Geospatial Fabric stream segments and
After the incorporation of the WFS stream segments and
polygons representing the watershed boundaries (Viger and
watershed boundaries in R, the features are then re-projected
Bock, 2014) on a background basemap of open source map
to the WGS84 geographic coordinate system (EPSG:4326)
tiles. Leaflet functionality was combined with interactive capa-
(http://spatialreference.org/ref/epsg/wgs-84/). The WGS84
bilities of Shiny (see “Building the User Interface Application
is used because several of the major map service providers8 Sharing Our Data—An Overview of Current (2016) USGS Policies and Practices for Publishing Data on ScienceBase
Using Shiny”) to symbolize stream segments based on vari- Documenting the R code using R Markdown and Hosting
able combinations selected by the user. The Leaflet map can the R Code in Bitbucket
be modified or updated based on these user requests. The style,
color, and representation of the features within the Leaflet The R scripts used to produce interactive maps for this
widget can be easily modified. project, along with documentation in R Markdown files, are
archived in the USGS Bitbucket repository (https://my.usgs.
gov/bitbucket/projects/CDI/repos/interactive-mapping/
Building the User Interface Application Using Shiny browse). Users with some knowledge of R or with assistance
Shiny is an interactive Web application framework for R from an R programmer can download and run the R code on
that uses HTML, cascading style sheets (CSS), and JavaScript their computer to create an interactive map displaying data
capabilities (Chang and others, 2016). The use of R within the from Chase and others (2016b) similar to the one shown in
application allows for on-the-fly integration of R statistical or fig. 4.
graphical capabilities into a desktop application. The applica-
tion is composed of two components: the user interface, which Other Mapping Options
contains the widgets and tools that allow user interaction; and
the server, which launches the application and executes or Many other options exist for creating interactive maps,
dynamically reacts to the user-requests behind it. The Leaf- with or without accessing online data. USGS Streamstats is
let mapping widget can be easily integrated within a Shiny one example of interactive maps served through a Web portal
application. (http://streamstatsags.cr.usgs.gov/streamstats/). Developing
In this example, we have built an application using the a Web portal requires expertise in Web design and program-
Leaflet/Shiny integration to display data hosted in Science- ming, as well as an organization to host and maintain the
Base. This application can interactively and dynamically map portal. Interactive PDF maps have been published by USGS
simulated changes in streamflow for three future periods for scientists; see appendix 1 in Thamke and others (2014) for
seven watersheds in eastern and central Montana (fig. 4, 185 one example (http://pubs.usgs.gov/sir/2014/5047/pdf/sir2014-
stream segments in the study area), and generate a table sum- 5047.pdf). Interactive PDF maps only allow the user to switch
marizing these changes in streamflow for a specific stream displays among static, premade maps, and might be useful for
segment. displaying a few sets of data. However, creation and storage
of several premade maps can be more difficult than writing a
program to quickly retrieve and map data. Additionally, users
cannot easily extract data from interactive pdf maps. Finally,
Figure 4. Example of an interactive map showing simulated changes in streamflow for seven watersheds in Montana
generated using data released on ScienceBase.Summary 9
Esri Story Maps let users combine maps, text, images, and USGS Fort Collins Science Center also develop Web mapping
multimedia to share data (https://storymaps.arcgis.com/en/). applications (https://www.fort.usgs.gov/science-tasks/2326).
One example is the “100 Years of the National Park Service” These teams might be good resources or collaborators for large
storymap (http://story.maps.arcgis.com/apps/MapJournal/ and/or complex interactive mapping applications.
index.html?appid=370f50e999534f50922bfb98fbac645f). When planning interactive map projects, scientists might
consider the following questions:
1. How many users are expected? How many users might
Lessons Learned, Limitations and other be accessing the data at the same time? High concurrent
user volumes can affect performance of the maps and
Considerations user experience.
As discussed in the “Purpose and Scope” section, USGS 2. How long will the application need to be supported? Can
data publishing policies and practices are evolving, and the volume of hosted data or the overall user base be
scientists should consult the resources cited in this paper for expected to grow through time?
definitive policy information. In addition, USGS Web sites
3. Who will maintain the map applications? Will user sup-
could change, and the information, uniform resource locators
port be available by telephone and email? Who will fix
(URLs) and email addresses provided in this report could be
any errors discovered after distribution?
superseded.
For the example used in this report, data from an exist- Answers to those questions can help guide selection of
ing data release (Chase and others, 2016b) were mapped. For methods, tools, and programs used to create and maintain the
future mapping efforts and mapping applications, ideally the maps.
data would be formatted and structured with input from the
map creators and map users.
Both WFS and WMS appear to work more easily with
shapefiles with a minimal number of attribute fields (for exam-
Summary
ple, only mandatory Esri fields such as “FID” (feature identi- This report provides an overview of current (2016) U.S.
fier) and “Shape” fields). If this approach is used, these fields Geological Survey (USGS) policies and practices related to
can be linked to data stored in CSV files on ScienceBase. The organizing and sharing data using ScienceBase. An example
CSV files should contain the same ID key as the shapefile in interactive mapping application to display data that are associ-
the ScienceBase mapping service. All columns and the values ated with an interpretive product is provided.
they contain should be documented in the associated metadata. Before uploading data to ScienceBase, data should be
Column headings for xyz data should conform to standard organized in a format and structure that will best lend itself to
coordinate names or abbreviations (latitude/longitude or lat/ meet the needs of a project, and metadata should be created.
long). Scientists and programmers should be aware of blank Data and metadata must undergo USGS-initiated review,
fields and symbols or values that represent “No Data” in Sci- and documentation of the data and metadata reviews must be
enceBase items as well as program defaults for “No Data” in uploaded into the Information Product Data System (IPDS).
software or programming languages used. After the data and metadata reviews are completed and rec-
Optimizing WFS and WMS requires scientists and onciled, data and metadata are uploaded to ScienceBase, and
programmers to consider the characteristics of their spatial the ScienceBase Team will create a digital object identifier.
data, including the number of features, the complexity of the Finally, after Bureau approval and publication, the metadata
features (number of vertices), the projection, symbology (the file (in extensible markup language format) associated with the
simpler the better), and the file size. All Web-based services data can be sent to the USGS Science Data Catalog.
(in ScienceBase or other GIS server platforms) will be limited Using the structure and data content of a ScienceBase
by network bandwidth and considerations like the above. For data release, a simple user interface was constructed to demon-
optimal performance, users should carefully consider their strate how the open source capabilities of the R programming
project goals and ways to make the services more efficient. language and environment can interact with the properties and
The example mapping application created for this project objects of the ScienceBase data release and be used to gener-
is for distribution to a limited number of map users (probably ate interactive maps. Shiny, a relatively lightweight application
less than about 50 users total, with only a few users accessing framework for R, was used along with a basemap obtained
the application at the same time). For more complex datasets, through the Leaflet R package to build an interactive mapping
or for applications to be used by hundreds or thousands of application that can be downloaded to a user’s computer.
people, a Web portal or other enterprise-grade solution might U.S. Geological Survey data publishing policies and
be more appropriate. The USGS OWI Data Science Team practices are evolving, and scientists should consult the
(http://cida.usgs.gov/datascience.html) developed the sbtools resources cited in this paper for definitive policy informa-
R package used for our example. They can assist with more tion. In addition, USGS Web sites could change, and the
complex and expansive mapping projects. Scientists at the10 Sharing Our Data—An Overview of Current (2016) USGS Policies and Practices for Publishing Data on ScienceBase
information, uniform resource locators (URLs) and email Open Geospatial Consortium, Inc., 2009, OGC KML standard
addresses provided in this report could be superseded. Finally, development best practices: Open Geospatial Consortium,
the example application created for this project is for distri- Inc., accessed August 8, 2016, at http://www.opengeospa-
bution to a limited number of map users (probably less than tial.org/standards/kml.
about 50 users total, with only a few users accessing the appli-
cation at the same time). For more complex datasets, or for R Core Team, 2016, R—A language and environment for
applications to be used by hundreds or thousands of people, a statistical computing: Vienna, Austria, R Foundation for
Web portal or other enterprise-grade solution might be more Statistical Computing Web page, accessed September 2016
appropriate. at www.R-project.org.
Tenopir, Carol, Allard, Suzie, Douglass, Kimberly, Aydino-
glu, A.U., Wu, Lei, Read, Eleanor, Manoff, Maribeth, and
References Cited Frame, Mike, 2011, Data sharing by scientists—Practices
and perceptions: PLOS ONE, v. 6, no. 6, e21101, accessed
September 2016 at http://dx.doi.org/10.1371/journal.
Blodgett, D.L., 2013, The U.S. Geological Survey Climate pone.0021101.
Geo Data Portal—An integrated broker for climate and geo-
spatial data: U.S. Geological Survey Fact Sheet 2013–3019, Tenopir, Carol, Dalton, E.D., Allard, Suzie, Frame, Miek, Pje-
2 p. sivac, Ivanka, Birch, Ben, Pollock, Danielle, and Dorsett,
Kristina, 2015, Changes in data sharing and data reuse prac-
Chase, K.J., Haj, A.E., Regan, R.S., and Viger, R.J., 2016a, tices and perceptions among scientists worldwide: PLOS
Potential effects of climate change on streamflow in Eastern ONE, v. 10, no. 8, e0134826, accessed September 2016 at
and Central Montana: Journal of Hydrology Regional Stud- http://dx.doi.org/10.1371/journal.pone.0134826.
ies, v. 7, September 2016, p. 69–81, accessed December
2016 at http://dx.doi.org/10.1016/j.ejrh.2016.06.001. Temple Lang, Duncan, 2016, RCurl—General network
(HTTP/FTP/…) client interface for R: R package version
Chase, K.J., Haj, A.E., Regan, R.S., and Viger, R.J., 2016b, 1.95-4.8, accessed September 2016 at https://CRAN.R-
Potential effects of climate change on streamflow in Eastern project.org/package=RCurl.
and Central Montana (2013–2014 analyses)—PRMS input
and output data: U.S. Geological Survey data release, Thamke, J.N., LeCain, G.D., Ryter, D.W., Sando, Roy, and
accessed December 2016 at http://dx.doi.org/doi:10.5066/ Long, A.J., 2014, Hydrogeologic framework of the upper-
F7P26W5S. most principal aquifer systems in the Williston and Powder
River structural basins, United States and Canada (ver. 1.1,
Chang, Winston, Cheng, Joe, Allaire, J.J., Xie, Yihui, and December 2014): U.S. Geological Survey Scientific Inves-
McPherson, Jonathan, 2016, shiny—Web application frame- tigations Report 2014–5047, 38 p. [Also available at http://
work for R: R package version 0.13.2 Web page, accessed dx.doi.org/10.3133/sir20145047.]
September 2016 at https://cran.r-project.org/web/packages/
shiny/. Viger, R.J., and Bock, A.R., 2014, GIS features of the geospa-
tial fabric for national hydrologic modeling: U.S. Geologi-
Cheng, Joe, and Xie, Yihui, 2016, Leaflet—Create interactive cal Survey data release, accessed May 2013, at http://dx.doi.
web maps with the Javascript ‘Leaflet’ library: R package org/10.5066/F7542KMD.
version 1.0.1 Web page, accessed September 2016 at https://
CRAN.R-project.org/package=leaflet. Winslow, Luke, Chamberlain, S., Appling, A., and Read, J.,
2016, sbtools—USGS ScienceBase tools: R package ver-
Fristom, David, 2013, Why science should be (even sion 1.0.2 Web page, accessed August 2016 at https://librar-
more) open: Boston, Mass., BU Today, Boston Univer- ies.io/cran/sbtools/1.0.2.
sity, accessed September 2016 at https://www.bu.edu/
today/2013/pov-why-science-should-be-even-more-open/.
Open Geospatial Consortium, Inc., 2005, OpenGIS Web fea-
ture service implementation specification: Open Geospatial
Consortium, Inc., accessed August 8, 2016, at http://www.
opengeospatial.org/standards/wfs.
Open Geospatial Consortium, Inc., 2006, OpenGIS Web map
service implementation specification: Open Geospatial
Consortium, Inc., accessed August 8, 2016, at http://www.
opengeospatial.org/standards/wms.Publishing support provided by: Rolla Publishing Service Center For more information concerning this publication, contact: Director, Wyoming-Montana Water Science Center U.S. Geological Survey 3162 Bozeman Ave Helena, MT 59601 (406) 457–5900 Or visit the Wyoming-Montana Water Science Center Web site at: http://wy-mt.water.usgs.gov/
Chase and others—Sharing Our Data—An Overview of Current (2016) USGS Policies and Practices for Publishing Data on ScienceBase—Open-File Report 2016–1202

                                                                                                                                                      https://doi.org/10.3133/ofr20161202
                                                                                                                                                      ISSN 2331-1258 (online)
You can also read