SIA Group Analysts/Media Briefing - FY20/21 Results 20 May 2021 - Singapore Airlines
←
→
Page content transcription
If your browser does not render page correctly, please read the page content below

SIA Group
                                                                                                                                                     Analysts/Media Briefing
                                                                                                                                                                                FY20/21 Results
                                                                                                                                                                                 20 May 2021

The copyright in this material (other than in respect of information from external sources) is owned by Singapore Airlines Lt d. Singapore Airlines Ltd has not independently verified the information from external sources. This material may
not be modified, reproduced, distributed, republished or transmitted in whole or in part in any manner or by any means without prior permission of Singapore Airlines Ltd.
PRESENTATION BY:

                                                                 Senior Vice President Finance
                                                                     Mr. Stephen Barnes

The copyright in this material (other than in respect of information from external sources) is owned by Singapore Airlines Lt d. Singapore Airlines Ltd has not independently verified the information from external sources. This material may
not be modified, reproduced, distributed, republished or transmitted in whole or in part in any manner or by any means without prior permission of Singapore Airlines Ltd.
Group Financial Results
 Key takeaways – FY20/21 results

  ▪       Singapore Airlines posts $4.3 billion net loss after the toughest year in its history.

  ▪       Passenger traffic down 97.9% due to global restrictions on international travel.

  ▪       Strong cargo revenues cushioned the plunge in passenger contributions.

  ▪       Net operating loss for the financial year ended 31 March 2021 was $2,513 million, after net loss of $214
          million on fuel hedging ineffectiveness and fuel derivatives.

  ▪       Net loss for the financial year ended 31 March 2021 was $4,271 million, after $1,953 million non-cash
          impairment charges.

  ▪       Amid the continuing uncertainties of the recovery trajectory, issuance of additional mandatory
          convertible bonds will further strengthen the Group’s financial position by raising liquidity and equity
          capital.

                                                                                                                                  Slide 3
The copyright in this material (other than in respect of information from external sources) is owned by Singapore Airlines Lt d. Singapore Airlines Ltd has not independently verified the information from external sources. This material may
not be modified, reproduced, distributed, republished or transmitted in whole or in part in any manner or by any means without prior permission of Singapore Airlines Ltd.
Group Financial Results

                                                                                              2H                           2H                           Better/                                                                                Better/
                                                                                                                                                                                   FY20/21                       FY19/20
                                                                                            FY20/21                      FY19/20                       (Worse)                                                                                (Worse)
                                                                                                                                                                                    ($’M)                         ($’M)
                                                                                             ($’M)                        ($’M)                          (%)                                                                                    (%)
   Total Revenue                                                                            2,181.5                      7,651.4                        (71.5)                      3,815.9                     15,975.9                       (76.1)

   Total Expenditure                                                                         2,831.1                      8,005.4                          64.6                     6,328.4                     15,916.8                           60.2
   -- Net fuel cost                                                                           639.5                        2,287.6                         72.0                     1,015.5                      4,636.5                           78.1
          Fuel cost (before hedging)                                                            462.9                      2,081.1                         77.8                        681.3                      4,506.3                          84.9
          Fuel hedging loss                                                                     176.6                       206.5                          14.5                        334.2                       130.2                          (156.7)
   -- Fuel hedging ineffectiveness                                                              35.5                        709.8                          95.0                        497.3                       709.8                           29.9
   -- Fair value gain on fuel derivatives                                                     (385.1)                         -                            n.m.                       (283.3)                         -                            n.m.
   -- Non-fuel expenditure                                                                    2,541.2                      5,008.0                         49.3                       5,098.9                     10,570.5                         51.8

   Operating (Loss)/Profit                                                                   (649.6)                      (354.0)                     (83.5)                      (2,512.5)                          59.1                      n.m.
   Operating (Loss)/Profit Margin (%)                                                         (29.8)                       (4.6)                    (25.2) pts                      (65.8)                           0.4                    (66.2) pts

    Group Loss Attributable to Owners
    of the Parent                                                                            (803.7)                      (417.6)                        (92.5)                   (4,270.7)                       (212.0)                          n.m.
    -- Basic Loss Per Share (¢)                                                                 (18.8)                       (22.1)                       (14.9)                      (115.6)                       (11.2)                         n.m.

                                                                                                                                  Slide 4
The copyright in this material (other than in respect of information from external sources) is owned by Singapore Airlines Lt d. Singapore Airlines Ltd has not independently verified the information from external sources. This material may
not be modified, reproduced, distributed, republished or transmitted in whole or in part in any manner or by any means without prior permission of Singapore Airlines Ltd.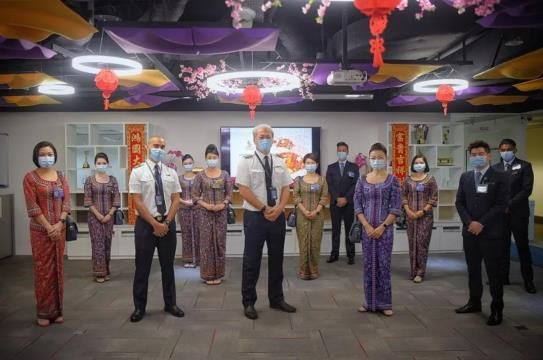
Group Revenue FY20/21
 Plunge in revenue as demand for international air travel remained depressed

                                                                     Group Revenue ($’M)

                                                          4,470.6
             4,102.2               4,222.3                                                                                                                                                                               FY20/21
                                                                                                                                                                                                                        $3,815.9M
                                                                                 3,180.8

                                                                                                                                                                                                                    Year-on-Year
                                                                                                                                                                                                                      $12,160.0M
                                                                                                                                                     1,066.7                1,114.8                                     (-76.1%)
                                                                                                         850.6                  783.8

               Q1                     Q2                    Q3                     Q4                     Q1                    Q2                     Q3                     Q4
             FY19/20                FY19/20               FY19/20                FY19/20                FY20/21               FY20/21                FY20/21                FY20/21

                                                                                                                                  Slide 5
The copyright in this material (other than in respect of information from external sources) is owned by Singapore Airlines Lt d. Singapore Airlines Ltd has not independently verified the information from external sources. This material may
not be modified, reproduced, distributed, republished or transmitted in whole or in part in any manner or by any means without prior permission of Singapore Airlines Ltd.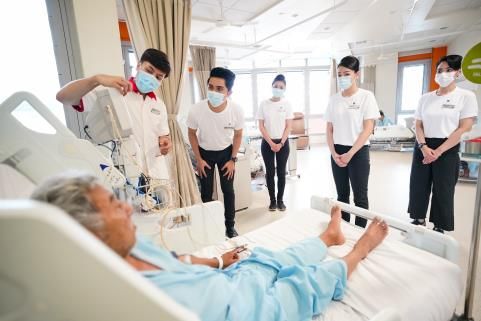
Group Revenue FY20/21
 Weakness in passenger business partially offset by strong cargo performance
                                                                                                                                                                  Passenger Business:
                                                                                                                                                                  •     Group revenue declined -76.1% y-o-y as passenger
                                                                                                                                                                        carriage plummeted 97.9% amid unprecedented
                                                                                                                                                                        closure of global borders. Passenger flown revenue
                                                                                                                                                                        declined by 94.7% y-o-y.
                                                                                                                                                                  •                           13.1%
                                                                                                                                                                        However, passenger flown   revenue in 2H more than
                                                                                                                                                                        tripled 1H following progressive capacity injection.
                                                                                                                                                                        Group ASK reached 23% of pre-Covid levels by the
                                                                                                                                                                        end of the FY compared to 8% by the end of 1H.
                                                                                                                                                                  Cargo Business:
                                                                                                                                                                  •     Despite capacity crunch led by loss of bellyhold
                                                                                                                                                                        capacity, cargo flown revenue remained strong during
                                                                                                                                                                        the FY (+38.8% y-o-y).
                              Flown
                                                  RASK            Yields          Carriage/                                                                       •     Cargo flown revenue rose 18.5% in 2H vs 1H.
                             Revenue                                                                    Capacity                  Load Factor
                                                  y-o-y           y-o-y             Load
  FY20/21                     y-o-y                                                                     y-o-y (%)               (Change y-o-y)                    •     Strong air cargo demand provided support for both
                                                   (%)             (%)            y-o-y (%)
                              ($’M)                                                                                                                                     cargo load factors and yields amid tight industry cargo
                                                                                                                                                                        capacity.
  SIA (Pax)                   -9,853.5            -65.9           +109.0               -97.5                 -84.9           13.4% (-68.5% pts)
  SilkAir                       -848.8            +26.8           +167.3               -98.9                 -97.7           36.5% (-40.8% pts)                   •     Improvement in freighter utilisation, deployment of
                                                                                                                                                                        passenger aircraft for cargo-only flights, loading of
  Scoot                       -1,495.7            +14.6            n.m.^               -99.2                 -93.3            9.9% (-75.8% pts)
                                                                                                                                                                        cargo in the passenger cabin, and the progressive
  SIA (Cargo)                   +757.6             n.a.           +116.1               -35.6                 -55.5           85.8% (+26.5% pts)                         resumption of passenger services partially mitigated
                                               ^ Not meaningful to compute a y-o-y increase in yield
                                                                                                                                                                        the loss of bellyhold capacity.
                                                                                                                                  Slide 6
The copyright in this material (other than in respect of information from external sources) is owned by Singapore Airlines Lt d. Singapore Airlines Ltd has not independently verified the information from external sources. This material may
not be modified, reproduced, distributed, republished or transmitted in whole or in part in any manner or by any means without prior permission of Singapore Airlines Ltd.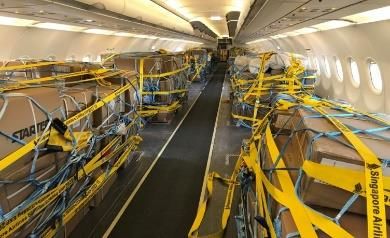
Group Expenditure FY20/21
 Group expenditure declined on capacity cuts, cost savings initiatives and government support schemes

                                                                  Group Expenditure ($’M)

4500
              3,902.2                 4,009.2                4,022.1                3,983.3
4000
                                                                                                                                                                                                                         FY20/21
3500
                                                                                                                                                                                                                        $6,328.4M
3000
2500
                                                                                                           1,887.4
2000
                                                                                                                                  1,609.9                                                                           Year-on-Year
                                                                                                                                                         1,397.5                1,433.6
1500                                                                                                                                                                                                                   $9,588.4M
1000                                                                                                                                                                                                                    (-60.2%)
  500
      0
                 Q1                     Q2                     Q3                     Q4                     Q1                     Q2                     Q3                     Q4
 -500
               FY19/20                FY19/20                FY19/20                FY19/20                FY20/21                FY20/21                FY20/21                FY20/21

                                                                                                                                  Slide 7
The copyright in this material (other than in respect of information from external sources) is owned by Singapore Airlines Lt d. Singapore Airlines Ltd has not independently verified the information from external sources. This material may
not be modified, reproduced, distributed, republished or transmitted in whole or in part in any manner or by any means without prior permission of Singapore Airlines Ltd.
Group Expenditure FY20/21 - Adjusted
 Group expenditure declined on capacity cuts, cost savings initiatives and government support schemes

                                                                  Group Expenditure
                                                                  Adjusted          ($’M)
                                                                           Group Expenditure ($’M)
                                                                                                                                            FY20/21
4500
              3,902.2                4,009.2                 4,022.1                                                                    Fuel hedging
4000
                                                                                                                                       ineffectiveness/                                                                  FY20/21
                                                                                    3,273.5                                             FV revaluation
3500
                                                                                                                                                                                                                        $6,114.4M
3000                                                                                                                                       $214.0M
2500
                                                                                                                                          (-$495.8M)

2000
                                                                                                                                                         1,548.5                1,632.2                             Year-on-Year
                                                                                                           1,423.7                1,510.0
1500                                                                                                                                                                                                                   $9,092.6M
1000                                                                                                                                                                                                                    (-59.8%)
  500
      0
                 Q1                     Q2                     Q3                     Q4                     Q1                     Q2                     Q3                     Q4
 -500
               FY19/20                FY19/20                FY19/20                FY19/20                FY20/21                FY20/21                FY20/21                FY20/21

                                                                                                                                  Slide 8
The copyright in this material (other than in respect of information from external sources) is owned by Singapore Airlines Lt d. Singapore Airlines Ltd has not independently verified the information from external sources. This material may
not be modified, reproduced, distributed, republished or transmitted in whole or in part in any manner or by any means without prior permission of Singapore Airlines Ltd.
Group Expenditure FY20/21
 Lower net fuel cost and non-fuel costs for full year

  Group expenditure declined -60.2% y-o-y:
  ▪       Significant reduction in non-fuel
          expenditure (-51.8%) on the back of
          capacity cuts, cost-saving initiatives,
          staff-related measures and government                                                                                                                                                               13.1%
          support schemes.                                                                                                                                                              69.8%
                                                                                                                                                                                                             17.1%
  ▪       Net fuel cost fell -78.1% due to capacity
          cuts and lower fuel prices.
  ▪       Net loss, due to fuel hedging
          ineffectiveness and fuel derivatives,
          declined $496M (-69.9%) to $214M, as
          $497M loss on fuel hedging
          ineffectiveness was partially mitigated
          by $283M fair value gain on fuel hedges
          following recovery of fuel prices in 2H
          FY20/21.

  Group expenditure fell 19.0% in 2H vs 1H despite ASK rising 218.2% and PKM rising 150.5%:
  ▪      Lower non-fuel expenditure was mainly due to lower fixed costs (reduction in depreciation and leased aircraft charges) partially offset by
         higher ex-fuel variable costs with the increase in passenger and cargo-only flights.
  ▪      Fuel cost before hedging was higher mainly due to increase in fuel prices and increase in volume uplifted with more flying.

                                                                                                                                  Slide 9
The copyright in this material (other than in respect of information from external sources) is owned by Singapore Airlines Lt d. Singapore Airlines Ltd has not independently verified the information from external sources. This material may
not be modified, reproduced, distributed, republished or transmitted in whole or in part in any manner or by any means without prior permission of Singapore Airlines Ltd.
Group Expenditure FY20/21 – Fuel Cost
 Lower fuel costs mainly due to capacity cuts and lower fuel prices partially negated by higher fuel hedging loss

                                                                                            Group Fuel Cost Analysis ($’M)

                                      4,636.5                    Lower uplift                                                                                                                 69.8%

                                                                                                                                                                                                                           -$3,621.0M
                                                                                                                                                                                                                            (-78.1%)

                                                                                                 Lower
                                                                                               weighted
                                                                                              average fuel                                                  Weakening
                                                                                                  price                     Higher fuel                       of USD
                                                                                                                            hedging loss                    against SGD                       1,015.5
                                                                     -3,411.4
                                                                                                                                                                    -3.8
                                                                                                  -409.8                          +204.0

                                     FY19/20                        Volume                           Price                      Hedging                      Exchange                        FY20/21

                                                                                                                                 Slide 10
The copyright in this material (other than in respect of information from external sources) is owned by Singapore Airlines Lt d. Singapore Airlines Ltd has not independently verified the information from external sources. This material may
not be modified, reproduced, distributed, republished or transmitted in whole or in part in any manner or by any means without prior permission of Singapore Airlines Ltd.
Group Operating Performance FY20/21
Lower operating losses in 2H compared to 1H
Group Operating Performance ($’M)
600
448.5
69.8%
400
200.0 213.1
FY20/21
200 -$2,512.5M
0
-200
Year-on-Year
-400 -330.8 -318.8
$2,571.6M
-600
(n.m.)
-800
-802.5 -826.1
-1000
-1,036.8
-1200
Q1 Q2 Q3 Q4 Q1 Q2 Q3 Q4
FY19/20 FY19/20 FY19/20 FY19/20 FY20/21 FY20/21 FY20/21 FY20/21
Slide 11
The copyright in this material (other than in respect of information from external sources) is owned by Singapore Airlines Lt d. Singapore Airlines Ltd has not independently verified the information from external sources. This material may
not be modified, reproduced, distributed, republished or transmitted in whole or in part in any manner or by any means without prior permission of Singapore Airlines Ltd.Group Operating Performance FY20/21 - Adjusted
Lower operating losses in 2H compared to 1H
Adjusted Group Operating
Group Operating Performance
Performance ($’M) ($’M)
600 FY20/21 Fuel hedging
448.5
ineffectiveness/FV revaluation
400
213.1 $214.0M FY20/21
200.0
200 (-$495.8M) -$2,298.5M
0
-200 -92.7
Year-on-Year
-400
-573.1
-481.8
$3,067.4M
-600 -517.4
-726.2 (n.m.)
-800
-1000
-1200
Q1 Q2 Q3 Q4 Q1 Q2 Q3 Q4
FY19/20 FY19/20 FY19/20 FY19/20 FY20/21 FY20/21 FY20/21 FY20/21
Slide 12
The copyright in this material (other than in respect of information from external sources) is owned by Singapore Airlines Lt d. Singapore Airlines Ltd has not independently verified the information from external sources. This material may
not be modified, reproduced, distributed, republished or transmitted in whole or in part in any manner or by any means without prior permission of Singapore Airlines Ltd.Group Operating Loss FY20/21
Deterioration in operating performance due to plunge in passenger flown revenue
Group Operating Performance ($’M)
Lower pax
flown
59.1 revenue
13.1%
69.8% -$2,571.6M
17.1%
+2,454.3 (n.m.)
-2,512.5
+882.6
Lower net +1,403.1
Largely:
fuel cost ▪ lower sales costs (+825.0)
+212.5 +283.3 ▪ lower passenger costs (+684.9)
+3,621.0 ▪ lower landing, parking &
Higher overflying (+667.4)
cargo ▪ lower AMO costs (+389.0)
flown ▪ lower crew expenses (+157.4)
revenue ▪ lower engineering services
revenue (-281.5)
+757.6
-12,186.0
FY19/20 Pax flown Cargo flown Net fuel Fuel hedging FV gain on fuel Staff cost Handling Others FY20/21
rev rev cost ineffectiveness derivatives charges
Slide 13
The copyright in this material (other than in respect of information from external sources) is owned by Singapore Airlines Lt d. Singapore Airlines Ltd has not independently verified the information from external sources. This material may
not be modified, reproduced, distributed, republished or transmitted in whole or in part in any manner or by any means without prior permission of Singapore Airlines Ltd.Operating Results for the Main Companies of the Group
All three airlines recorded lower operating losses in 2H; while SIAEC turned profitable in 2H vs 1H
2H 2H Better/ Better/
FY20/21 FY19/20
FY20/21 FY19/20 (Worse) (Worse)
($’M) ($’M)
($’M) ($’M) (%) (%)
SIA (441.6) (170.8) (158.5) (1,701.7) 294.2 n.m.
SilkAir (54.7) (93.2) 41.3 (219.8) (112.3) (95.7)
Scoot (156.0) (120.8) (29.1) (569.7) (197.7) (188.2)
SIAEC Group 5.6^ 30.4 (81.6) (19.0)^ 67.7 n.m.
^ The numbers differ from SIAEC’s reported figures due to re-classification of headcount rationalization cost at Group level
Slide 14
The copyright in this material (other than in respect of information from external sources) is owned by Singapore Airlines Lt d. Singapore Airlines Ltd has not independently verified the information from external sources. This material may
not be modified, reproduced, distributed, republished or transmitted in whole or in part in any manner or by any means without prior permission of Singapore Airlines Ltd.Group Net Loss FY20/21
Lower net losses in 2H compared to 1H
Group Net Performance ($’M)
314.8
111.1 94.5 13.1%
69.8%
17.1% FY20/21
-141.8 -$4,270.7M
-732.4 -661.9
-1,123.3 Year-on-Year
$4,058.7M
(n.m.)
-2,343.7
Q1 Q2 Q3 Q4 Q1 Q2 Q3 Q4
FY19/20 FY19/20 FY19/20 FY19/20 FY20/21 FY20/21 FY20/21 FY20/21
Slide 15
The copyright in this material (other than in respect of information from external sources) is owned by Singapore Airlines Lt d. Singapore Airlines Ltd has not independently verified the information from external sources. This material may
not be modified, reproduced, distributed, republished or transmitted in whole or in part in any manner or by any means without prior permission of Singapore Airlines Ltd.Group Net Loss FY20/21
Net loss driven by weaker op performance and non-cash impairment charges, partially offset by increase in tax credit
Group Net Performance ($’M)
-212.0
Largely: -$4,058.7M
Impairment of Lower share of profits from (n.m.)
45 surplus JVs (-32.4),
aircraft Loss on divestment of Virgin
Impairment of Australia (-25.0),
goodwill (170.4), Loss on Absence of expected credit
-2,571.6 base disposal of loss on NokScoot (+28.7)
maintenance aircraft, spares
Weaker Higher tax
operating asset (36.9) and & spare
intangible assets engines vs credit
results
(11.4) surplus last
year
-24.8 -4,270.7
-1,734.3
-218.7 -53.7 -44.7 -33.9 +623.0
FY19/20 Operating Impairment of Impairment of Net finance Headcount Aircraft disposal Taxation Others FY20/21
performance aircraft other asset charges rationalisation
costs
Slide 16
The copyright in this material (other than in respect of information from external sources) is owned by Singapore Airlines Lt d. Singapore Airlines Ltd has not independently verified the information from external sources. This material may
not be modified, reproduced, distributed, republished or transmitted in whole or in part in any manner or by any means without prior permission of Singapore Airlines Ltd.Group Financial Position
($’M) As at 31 March 2021 As at 31 March 2020
Equity attributable to owners of the company 15,905.9 9,314.1
Total Assets 37,581.3 33,712.8
Total Debt 14,336.9 11,784.5
Total Cash and Bank Balances 7,783.0 2,685.3
Total Liabilities 21,303.2 23,980.1
Debt: Equity ratio (times)^ 0.90 1.27
Net Asset Value Per Share ($)^^ 5.36 7.86
^ Total debt : equity ratio is total debt divided by equity attributable to owners of the Company.
^^ Net asset value per share is computed by dividing equity attributable to owners of the Company by the number of ordinary shares in issue less
treasury shares.
Slide 17
The copyright in this material (other than in respect of information from external sources) is owned by Singapore Airlines Lt d. Singapore Airlines Ltd has not independently verified the information from external sources. This material may
not be modified, reproduced, distributed, republished or transmitted in whole or in part in any manner or by any means without prior permission of Singapore Airlines Ltd.Group Fleet Development
Net increase of 19 aircraft by end of FY21/22
Operating Fleet As at 31 March 2021 In Out As at 31 March 2022
SIA 777-300ER 23 23
A380-800 12 12
A330-300 3 -3 0
A350-900 52 +6 58
787-10 15 +5 20
737-800 NG 8 +1 9
747-400F 7 7
Total 120 +12 -3 129
SilkAir 737-800 NG 1 -1 0
Total 1 -1 0
Scoot 787-8 10 +2 12
787-9 10 10
A320 22 -1 21
A320neo 5 5
A321neo 0 +10^ 10
Total 47 +12 -1 58
GROUP TOTAL 168^^ +24 -5 187
^ Direct leases
^^ Excluded 51 aircraft in non-operating fleet which comprises 41 surplus aircraft that were impaired, six 737 MAX 8s, three A35 0-900s that were delivered
but not yet operational and one A330 removed from operating fleet in preparation for lease return
Singapore Airlines will also be taking delivery of eight 737-8 MAXs during FY21/22
Slide 18
The copyright in this material (other than in respect of information from external sources) is owned by Singapore Airlines Lt d. Singapore Airlines Ltd has not independently verified the information from external sources. This material may
not be modified, reproduced, distributed, republished or transmitted in whole or in part in any manner or by any means without prior permission of Singapore Airlines Ltd.PRESENTATION BY:
Chief Executive Officer
Mr. Goh Choon Phong
The copyright in this material (other than in respect of information from external sources) is owned by Singapore Airlines Lt d. Singapore Airlines Ltd has not independently verified the information from external sources. This material may
not be modified, reproduced, distributed, republished or transmitted in whole or in part in any manner or by any means without prior permission of Singapore Airlines Ltd.1 Strong Fundamentals
2 Response to Covid-19
3 Lead the New World
Slide 20
The copyright in this material (other than in respect of information from external sources) is owned by Singapore Airlines Lt d. Singapore Airlines Ltd has not independently verified the information from external sources. This material may
not be modified, reproduced, distributed, republished or transmitted in whole or in part in any manner or by any means without prior permission of Singapore Airlines Ltd.Strong Fundamentals The copyright in this material (other than in respect of information from external sources) is owned by Singapore Airlines Lt d. Singapore Airlines Ltd has not independently verified the information from external sources. This material may not be modified, reproduced, distributed, republished or transmitted in whole or in part in any manner or by any means without prior permission of Singapore Airlines Ltd.
Strong Fundamentals
  Investing to grow network, product, service and digital leadership pre-Covid

                 Extensive global network                                                                    Modern fleet with premium
                                                                                                                                                                                                Delivering a world-class service
                 bolstered by partnerships                                                                            products
                                                                    Americas
                                                       4 out of 6 Points served
                                                                      Non-Stop
    Europe
    17 Points
                                                              North Asia
                                                     38 Points, including 27
                                                                     in China
 W Asia & Africa
 21 Points, including 13
 in India
                                                    Southeast Asia
         Southwest Pac.                                          43 Points                       Average Group fleet age of                 Fitting our A350s, A380s,
         12 Points                                                                                5 yrs 7 mths, with                         787s, 777Xs with latest
                                                                                                  new-gen & fuel-efficient                          cabin products                                                       our people
                                                                                                                                                                                                     Sustained investments in
                                                                                                          aircraft                                                                                          and technology to enable
                            137 destinations                                                                                                                                                                 personalised service excellence
* As at Dec’19       37 countries and territories                                           * As at May’21

                                                            Architected blueprint to become the world’s leading digital airline

                         Cultivating a                                                   Building                                                          Revamping                                                           Collaborating with
                        Digital Culture                                            Digital Capabilities                                             Technical Infrastructure                                                External Communities

                                                                                                                                 Slide 22
The copyright in this material (other than in respect of information from external sources) is owned by Singapore Airlines Lt d. Singapore Airlines Ltd has not independently verified the information from external sources. This material may
not be modified, reproduced, distributed, republished or transmitted in whole or in part in any manner or by any means without prior permission of Singapore Airlines Ltd.
Strong Fundamentals
Developing new air and non-air engines of growth
Streamline the Group portfolio to build synergies Grow new businesses to diversify revenue streams
and increase customer mindshare
FSC integration LCC integration
announced in 2018 completed in 2017
Strategic investments in high-growth markets
CORE
35 5
domestic points international
pre-Covid points pre-Covid
Vistara
SIA
Launched 1st India’s highest- Scoot
787-9 rated airline on
Dreamliner in Skytrax and
India TripAdvisor
Slide 23
The copyright in this material (other than in respect of information from external sources) is owned by Singapore Airlines Lt d. Singapore Airlines Ltd has not independently verified the information from external sources. This material may
not be modified, reproduced, distributed, republished or transmitted in whole or in part in any manner or by any means without prior permission of Singapore Airlines Ltd.Strong Fundamentals
Successful Transformation programme has placed us in good stead to handle Covid-19
Record-highs achieved in 3Q FY19/20
Available Passenger Passenger
Seat-KM Load Factor Uplift Revenue
(ASK)
45,506 million 85.6%* 10.1 million S$4,470.6 million
* Highest PLF record achieved in previous quarter Q2 FY19/20 at 85.9%, with Q3 coming in a close 2 nd
Slide 24
The copyright in this material (other than in respect of information from external sources) is owned by Singapore Airlines Lt d. Singapore Airlines Ltd has not independently verified the information from external sources. This material may
not be modified, reproduced, distributed, republished or transmitted in whole or in part in any manner or by any means without prior permission of Singapore Airlines Ltd.Response to Covid-19 The copyright in this material (other than in respect of information from external sources) is owned by Singapore Airlines Lt d. Singapore Airlines Ltd has not independently verified the information from external sources. This material may not be modified, reproduced, distributed, republished or transmitted in whole or in part in any manner or by any means without prior permission of Singapore Airlines Ltd.
Response to Covid-19
 Fortifying our balance sheet to recover from a position of strength

                                                                                                                S$8.8B                 From shareholders, through Rights Issue

                                                             Additional liquidity                               S$2.1B                 Aircraft secured financing
                                                                raised since
                                                                                                                S$2.0B                 Sale-and-leaseback of 11 aircraft
                                                                1 Apr 2020
             Total additional                                                                                   S$2.0B
             liquidity raised                                       S$15.4B                                                            Issuance of convertible bonds and notes

               and planned                                                                                      S$0.5B                 New committed lines of credit* and unsecured loan

                S$21.6B                                                                                        ▪ Allows the Group to navigate prolonged Covid-19 uncertainty and
                                                            Additional MCBs to                                   support future growth
                                                                 be issued
                                                                                                               ▪ MCBs are not immediately dilutive and will provide the
                                                                       S$6.2B                                    Company flexibility for redemption over the next 9 years

                            Committed LOCs (untapped)                                                           S$1.7B                 Renewed existing committed lines of credit
                                            S$2.1B                                                              S$0.4B                 New committed lines of credit*

                                                           We will continue to pursue opportunities for additional liquidity
 *Refers to the same newly committed LOCs

                                                                                                                                 Slide 26
The copyright in this material (other than in respect of information from external sources) is owned by Singapore Airlines Lt d. Singapore Airlines Ltd has not independently verified the information from external sources. This material may
not be modified, reproduced, distributed, republished or transmitted in whole or in part in any manner or by any means without prior permission of Singapore Airlines Ltd.
Response to Covid-19
Measures to manage expenditure remain firmly in place
Agreements reached with Airbus and Boeing
Various staff measures implemented
Aircraft Family Revised Order Book
A320 43 ~20% of positions reduced in FY20/21
A350 12 Paycuts instituted and remain
737-8 31
787 20
777-9 31
Expenditure remains closely watched
Information accurate as of 19 May 2021; includes orders from lessors
Reduce discretionary expenditure
Defer non-critical projects
Deferred >$4b of CapEx out of FY20/21 – FY22/23 Renegotiate contracts
Restructured fleet orders to moderate current capacity
growth and meet projected long-term needs
Slide 27
The copyright in this material (other than in respect of information from external sources) is owned by Singapore Airlines Lt d. Singapore Airlines Ltd has not independently verified the information from external sources. This material may
not be modified, reproduced, distributed, republished or transmitted in whole or in part in any manner or by any means without prior permission of Singapore Airlines Ltd.Response to Covid-19
Delivering a safe and seamless customer journey
Pre-flight Check-In/Lounge/Boarding Inflight Arrival/Post-flight
COVID-19 Info Centre Health assessment for passengers Care Kit for pax Electronic Health
• Comms & health safety videos Declaration/ temperature
• Enhanced flight credits rebooking Mounted hand sanitisers screening
outside lavatory
Digital Health Verification Solutions
Personalised Travel Protective Barriers at
Crew in masks, goggles (gloves for
Restrictions & Visa Info counters, Staff in Masks
meal collection & full PPE for lav cleaning)
• Travel advisory subscription Protective barriers at counters,
Staff in masks Hand Sanitisers in
Vaccination for Cabin Crew
Flexibility in ticket conditions multiple locations
• New ‘Value’ fare family Hand Sanitisers in multiple locations HEPA filters on all aircraft
• Flight Pass Cleaning & disinfection
Cleaning & Disinfection, Long Cleaning & disinfection with
Enhanced Travel Guard with AIG lasting anti-microbial coating approved disinfectant Calla 1452
(Rolled out in 13 markets to date) • Electrostatic spraying to improve fogging Safe distancing markers
Membership Programme Safe distancing markings Long lasting Anti-Microbial Coating
Tier requalification assistance, miles Auto Creation of Mishandled
extension Baggage Report (PIR)
Print & Go Contactless Kiosk & F&B Changes
Auto Bag Tag printing
Pre departure test facilitation
service Companion App, IFE controlled via PED
E-library Customer Surveys
• Pilot in ID-JKT&MES, SG, HK & UK
• On-going New Normal survey to
• Extended to Scoot source markets E-library, E-menu understand customers’ travel
Digital Food Ordering (SKL) concerns & changing needs
Auto & Online Check-in
E-shopping
option (incldg groups) with
No boarding pass checks at
Digital Boarding Pass aircraft entrance by crew New amenities:
• Headphone hygiene covers
Themes: Cleanliness & Hygiene Reducing Contact & Safe Distancing Facilitating Travel • Disposable coat cover
Digital Initiatives Among Industry First Italics mean Work in Progress Pillow wrapping in biodegradable plastic
Slide 28
The copyright in this material (other than in respect of information from external sources) is owned by Singapore Airlines Lt d. Singapore Airlines Ltd has not independently verified the information from external sources. This material may
not be modified, reproduced, distributed, republished or transmitted in whole or in part in any manner or by any means without prior permission of Singapore Airlines Ltd.Response to Covid-19
Prioritising health and safety by leveraging technology and service excellence
SIA & Scoot awarded highest “Diamond” rating
in global health and safety audit by APEX and
SimpliFlying
Two pilots successfully completed
For frontline staff to digitally verify
SGHealthCerts to prevent fraud and 96% of SIA Group pilots and cabin crew*
Dec’20
human error are fully vaccinated
First airline in the world to pilot the
IATA Travel Pass (ITP) solution, which
allows customers to securely store
Mar’21 and present Covid-19 test information
Envisaging a seamless digital health
verification touchpoint
Improving Integrating
adoption of ITP vaccinations and other
test certificates *98% of SIA Group pilots and cabin crew have signed up to be vaccinated, of which 96% have been fully
vaccinated with both doses. Information accurate as of 14 May 2021.
Slide 29
The copyright in this material (other than in respect of information from external sources) is owned by Singapore Airlines Lt d. Singapore Airlines Ltd has not independently verified the information from external sources. This material may
not be modified, reproduced, distributed, republished or transmitted in whole or in part in any manner or by any means without prior permission of Singapore Airlines Ltd.Response to Covid-19
Rebuilding our passenger network in a safe and calibrated manner
Keeping Our Hub Network Open Crafting New and Safe Models of Travel
SIA Group Passenger Capacity; % vs. pre-Covid in Jan’20 With Authorities
Jul 2021
Brunei Japan*
32% of pre-Covid capacity Reciprocal China Korea*
6,000 49% of pre-Covid destinations Green Lanes Germany* Malaysia*
(RGL) Indonesia*
32%
5,000
28%
27%
ASK (mil seat-km)
24% Australia New Zealand
4,000 23% Unilateral
20%20% Opened (UO) Brunei Taiwan*
19% China Vietnam*
3,000 Borders
13%
2,000
10%
8% 8%
Air Travel Allows for a safe and controlled way to
1,000 5% 5% open borders for general travel
3% 3% Bubble (ATB)
0
*Currently suspended until further notice
Information accurate as of 18 May 2021; pre-Covid refers to Jan’20 data
Slide 30
The copyright in this material (other than in respect of information from external sources) is owned by Singapore Airlines Lt d. Singapore Airlines Ltd has not independently verified the information from external sources. This material may
not be modified, reproduced, distributed, republished or transmitted in whole or in part in any manner or by any means without prior permission of Singapore Airlines Ltd.Response to Covid-19
Aggressively pursuing opportunities to tap on strong cargo demand
Operated cargo-only passenger flights Removed aircraft seats Launched new products to capture
to supplement fall in bellyhold capacity to load cargo in cabin new verticals
1st airline in Southeast Asia
to obtain IATA CEIV Fresh
certification
Launched new service to transport time- and
temperature- sensitive perishables with
speed and reliability
53% 93% Removed passenger seats from four aircraft
of pre-Covid of pre-Covid (2x SIA 777-300ERs, 2x Scoot A320s) to
capacity restored carriage restored create modified freighters
in Mar’21 in Mar’21 Joins THRUCOOL, a cold chain airfreight service
Agility to capture ad-hoc charter launched in 2018 that transports high value,
opportunities time-sensitive and temperature-controlled
Includes flights on freighter, passenger, and cargo-only passenger networks
pharmaceuticals
Pre-Covid refers to Jan’20 data
Slide 31
The copyright in this material (other than in respect of information from external sources) is owned by Singapore Airlines Lt d. Singapore Airlines Ltd has not independently verified the information from external sources. This material may
not be modified, reproduced, distributed, republished or transmitted in whole or in part in any manner or by any means without prior permission of Singapore Airlines Ltd.Response to Covid-19
Playing our part in the global effort against Covid-19
Transporting Proud partner of
1stvaccine vaccines and UNICEF Airfreight
shipment essential Humanitarian
supplies to Initiative & World
to Asia other countries Food Programme
Flying to bring loved ones home Engaging communities at home
2,100 staff deployed as SIA Group
Ambassadors to 32 organisations
Maintaining hub Assembled internal Delivered new 4,500 SIN-based volunteers engaged
network and key charter taskforce solutions, such as with distributing masks, hand sanitisers,
city links open to respond to same-plane transit and meals
demand services
Slide 32
The copyright in this material (other than in respect of information from external sources) is owned by Singapore Airlines Lt d. Singapore Airlines Ltd has not independently verified the information from external sources. This material may
not be modified, reproduced, distributed, republished or transmitted in whole or in part in any manner or by any means without prior permission of Singapore Airlines Ltd.Response to Covid-19
Harnessing the Group portfolio and multi-hub airlines
SilkAir is in its final stages of integration into Strong foundation allows Vistara to be
Singapore Airlines resilient and capitalise on opportunities
Full
Service Domestic operations 70% 65%
Pre-Covid Passenger load
resumed domestic capacity factor achieved
in Mar’21 in Mar’21
Positioning
International London Doha
destinations planned Frankfurt Sharjah
under Air Travel Bubble Dubai Dhaka
arrangements* Male Tokyo
Low
Cost
Regional
Markets
Long-Haul Fleet growth plans 47 70
remain on track Aircraft at 31 Aircraft by mid-
Mar’21 2023
SQ narrowbody operations commenced
in Mar’21
* Operations are currently suspended until further notice
Slide 33
The copyright in this material (other than in respect of information from external sources) is owned by Singapore Airlines Lt d. Singapore Airlines Ltd has not independently verified the information from external sources. This material may
not be modified, reproduced, distributed, republished or transmitted in whole or in part in any manner or by any means without prior permission of Singapore Airlines Ltd.Response to Covid-19
Growing new businesses to diversify revenue streams and increase customer mindshare
Expanding existing new businesses Building synergies within the ecosystem
90% YoY non-air KrisFlyer transactions
▪ Continued to grow KrisFlyer membership base in FY20/21 despite 100% YoY KrisFlyer redemptions on KrisShop
low flying activity
▪ Kris+ has >190 partners with >800 outlets in Singapore
▪ Expanding Kris+’s footprint into Australia, India, Indonesia, South 90% YoY KrisFlyer redemptions on Kris+
Korea
Developing new initiatives in adjacencies
▪ E-Commerce sales grew 121% YoY in pivot to cushion loss of travel Launched in FY20/21:
retail
▪ Traffic to KrisShop.com grew 120% YoY; average transaction value is
25% higher YoY
▪ Increased # of brands by 250% vs pre-Covid
Slide 34
The copyright in this material (other than in respect of information from external sources) is owned by Singapore Airlines Lt d. Singapore Airlines Ltd has not independently verified the information from external sources. This material may
not be modified, reproduced, distributed, republished or transmitted in whole or in part in any manner or by any means without prior permission of Singapore Airlines Ltd.Response to Covid-19
Continuing our sustainability journey
Modern and
fuel-efficient fleet
Exploring Sustainable Aviation Fuel
Collaborating with (SAF) Adoption
SIN-ecosystem to develop:
• World’s first green package flights
• CORSIA eligible carbon credit projects
• Uplift of biofuel ex-Sweden
• A trusted carbon exchange platform
• 6-party study group on commercialisation
and deployment of biofuel
Environmental
Sustainability
Efforts Compliance with
New Short-Haul international standards
Economy Catering
• >50% weight reduction
• 309 tonnes of carbon
emissions avoided
Solar panels installed in
SIN offices
Slide 35
The copyright in this material (other than in respect of information from external sources) is owned by Singapore Airlines Lt d. Singapore Airlines Ltd has not independently verified the information from external sources. This material may
not be modified, reproduced, distributed, republished or transmitted in whole or in part in any manner or by any means without prior permission of Singapore Airlines Ltd.Response to Covid-19
Investing in our people and strengthening digital capabilities
Uplifting for the New World
Demo Days Cultivating a
Encouraging ground-up digital
▪ UPLIFT is a 2-year upskilling plan to equip ground staff worldwide with
ideas from staff Digital Culture
key Change Management and Digital Skills
10th
Demo Day
held in Mar’21 Trailblazer
Groomweek to provide
50+ intrapreneurs hands-on and
Prototypes structured learning
since 2018
▪ Also provides functional upskilling in key Commercial and
Operational expert domains
LIFE 2021
Learning and Innovation for
Upskilling Our Staff Through e-Learning Everyone – Biennale Festival
Launched in Jan’21
>14,000
Ground staff, pilots, and cabin
Sign-ups across
crew completed 3.6x more e- 55 events and many
learning hours YoY more…
Slide 36
The copyright in this material (other than in respect of information from external sources) is owned by Singapore Airlines Lt d. Singapore Airlines Ltd has not independently verified the information from external sources. This material may
not be modified, reproduced, distributed, republished or transmitted in whole or in part in any manner or by any means without prior permission of Singapore Airlines Ltd.Lead the New World
Slide 37
The copyright in this material (other than in respect of information from external sources) is owned by Singapore Airlines Lt d. Singapore Airlines Ltd has not independently verified the information from external sources. This material may
not be modified, reproduced, distributed, republished or transmitted in whole or in part in any manner or by any means without prior permission of Singapore Airlines Ltd.Lead the New World
We have made progress in our new Transformation chapter
Customer Experience Financial Sustainability Staff Productivity & Upskilling
33% >250 initiatives >400,000 staff hrs >1,000 ideas
improvement in to achieve a competitive cost saved from business generated by staff
responsiveness to calls base and stronger revenue process reviews & to support our
generating capabilities digital initiatives Transformation Vision
Digital Transformation
Speed Quality
52% 89% 200% >50,000 hrs
increase in total learning of learning completed
increase speed of reduction in hours for Ground Staff in digital related
development cycle time coding defect density compared to FY1920 courses
Slide 38
The copyright in this material (other than in respect of information from external sources) is owned by Singapore Airlines Lt d. Singapore Airlines Ltd has not independently verified the information from external sources. This material may
not be modified, reproduced, distributed, republished or transmitted in whole or in part in any manner or by any means without prior permission of Singapore Airlines Ltd.Lead the New World
Our robust fundamentals and agile pandemic response will put us
on track to Lead the New World
World Class Leader Financial Sustainability Dynamic and Resilient Team
Pre-Covid foundations
We continue have put
to strengthen us infoundations
these good stead during
to handle the crisis
Covid-19
The Singapore Skilled and Talented
Financial Strength Digital Capabilities
Airlines Brand People
Slide 39
The copyright in this material (other than in respect of information from external sources) is owned by Singapore Airlines Lt d. Singapore Airlines Ltd has not independently verified the information from external sources. This material may
not be modified, reproduced, distributed, republished or transmitted in whole or in part in any manner or by any means without prior permission of Singapore Airlines Ltd.Thank You The copyright in this material (other than in respect of information from external sources) is owned by Singapore Airlines Lt d. Singapore Airlines Ltd has not independently verified the information from external sources. This material may not be modified, reproduced, distributed, republished or transmitted in whole or in part in any manner or by any means without prior permission of Singapore Airlines Ltd.
You can also read