SINGAPORE Q2 2020 - REAL ESTATE TIMES - Edmund Tie
←
→
Page content transcription
If your browser does not render page correctly, please read the page content below

REAL ESTATE
                                            TIMES

                                            JULY 2020

SINGAPORE Q2 2020
Liquidity amid low-interest environment
continues to support transactions even as
overall market remains subdued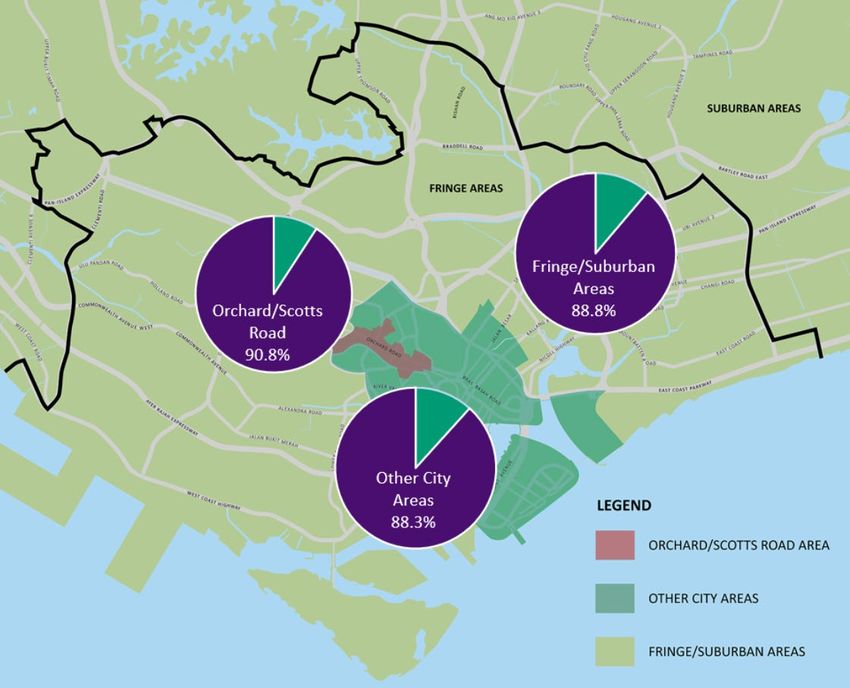
ECONOMY

Market commentary

Key economic indicators
• The International Monetary Fund (IMF)         • Based on advanced estimates released by the Ministry of Trade and
  has forecasted in June 2020 that the global     Industry (MTI) on 14 July 2020, the Singapore economy contracted
  economy is expected to contract sharply         by 12.6 per cent year-on-year (y-o-y) in Q2 2020, extending from
  by 4.9 per cent in 2020 due to the impact       the 0.3 per cent y-o-y decline in Q1 2020 (Table 1). The greater
  of the Covid-19 pandemic (previously -3.0       plunge in GDP in Q2 2020 was due to the Circuit Breaker measures
  per cent). If the pandemic stabilises in H2     that were implemented from 7 April to 1 June 2020 to control the
  2020, the global economy is projected to        spread of the Covid-19 pandemic, as well as subdued external
  grow by 5.4 per cent in 2021 as economic        demand amidst a global economic downturn. The construction
  activity normalises amid policy support.        sector trended downwards by 54.7 per cent y-o-y in Q2 2020
  However, as the pandemic situation is           due to a cessation of most construction activities and manpower
  still evolving, the global growth forecast      disruptions. For the full year of 2020, MTI has forecasted that there
  is still very much uncertain. For the           will be a 4 to 7 per cent contraction in GDP.
  Asean-5 countries (Indonesia, Malaysia,
  Philippines, Singapore and Thailand), the     Table 1: Singapore’s Gross Domestic Product (GDP)
  IMF has revised down the growth rate to
  minus 2.0 per cent in 2020 (previously                                               Year-on-year (y-o-y) change (%)
                                                  Selected
  -1.3 per cent). In particular, Singapore’s                                  Q2             Q3     Q4         Q1          Q2
                                                  indicators
  economic contraction is projected to be                                    2019           2019   2019       2020        2020*
  3.5 per cent in 2020, with a recovery to 3
                                                  Overall GDP                 0.2           0.7     1.0        -0.3       -12.6
  per cent growth in 2021.
                                                  Manufacturing               -2.7          -0.7    -2.3       8.2         2.5

                                                  Construction                2.3           3.1     4.3        -1.1       -54.7

                                                  Services producing
                                                                              1.1           0.8     1.5        -2.4       -13.6
                                                  industries

                                                * Based on advanced estimates released by          Source: MTI, EDMUND TIE Research
                                                  MTI on 14 July 2020

EDMUND TIE RESEARCH                                                                                                   1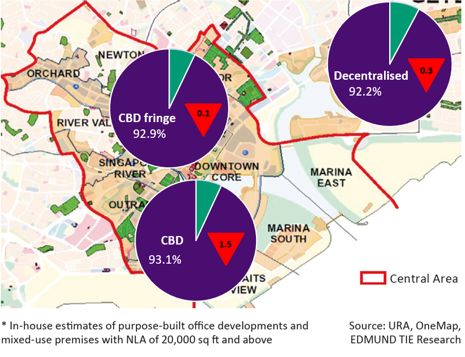
• As a result of market contraction compounded by cautious                                Many businesses have been facing difficulties
  sentiments, inflation (both core and all-items) has decelerated and                     due to the overall weakened global business
  unemployment rate increased. However, fixed-asset investment                            climate. As such, the government has
  commitments of some S$12.4bn was recorded in Q1 2020,                                   introduced the Jobs Support Scheme to
  compared to 2019’s S$15.2 billion over the entire year (Table 2).                       cover employee wages till August 2020. The
  These was largely contributed by the manufacturing, chemicals and                       foreign worker levy has also been waived
  electronics clusters in Q1 2020.                                                        in April 2020. This waiver extended to
                                                                                          June and July 2020 as well, for businesses
Table 2: Inflation, unemployment rate and fixed asset investments                         that are not allowed to resume operations
                                                                                          after the circuit breaker. The government
                                       Q2          Q3            Q4           Q1          has also introduced rental waivers and
  Selected indicators
                                      2019        2019          2019         2020
                                                                                          property tax rebates to non-residential
  Consumer Price Index                                                                    tenants (summarised in Appendices 1 and
  (Core inflation)                     1.3         0.6           0.5          0.2         2). However, global weakness, technology
  Y-o-y % change
                                                                                          disruption and ongoing business uncertainty
  Consumer Price Index                                                                    will likely cause further job losses.
  (All items inflation) S.A.           0.5         0.5           0.8          -0.1
  Y-o-y % change                                                                          The retail sector was one of the hardest-hit
  Unemployment rate, S.A.                                                                 sectors, and the rental waivers will go some
                                       2.2         2.3           2.3          2.4
  (per cent)                                                                              way in helping retailers’ tide through this
                                                                                          period. However, besides rents and taxes,
  Fixed asset investments
                                       4.3         0.2           6.9         12.4         retailers will still need to grapple with other
  (S$bn)
                                                                                          costs, such as overheads and advertising
              Source: Singapore Department of Statistics, MAS, MTI, EDMUND TIE Research
                                                                                          costs that are beyond near-term relief.

                                                                                          For the residential sector, the deferment of
The Singapore Government is dedicating S$93bn, or nearly 20 per
                                                                                          mortgage payments till the end of the year
cent of GDP, comprising the Unity, Resilience, Solidarity and Fortitude
                                                                                          will help homebuyers that are struggling with
Budgets to support Singaporeans in this battle against the Covid-19
                                                                                          their finances. Additionally, the extension of
pandemic. The first Unity Budget announced on February 18 saw
                                                                                          the project completion period and extension
S$6.4bn set aside. On March 26, Deputy Prime Minister Heng added
                                                                                          of the sale of housing units relating to the
S$48.4bn to the effort in a supplementary Resilience Budget. On
                                                                                          Additional Buyer’s Stamp Duty (ABSD)
April 6, he announced a further S$5.1bn in support measures under
                                                                                          remission will also assist developers who
the Solidarity Budget. On May 26, a S$33bn Fortitude Budget was
                                                                                          were affected by manpower constraints.
announced aimed primarily at helping workers and businesses.

EDMUND TIE RESEARCH                                                                                                        2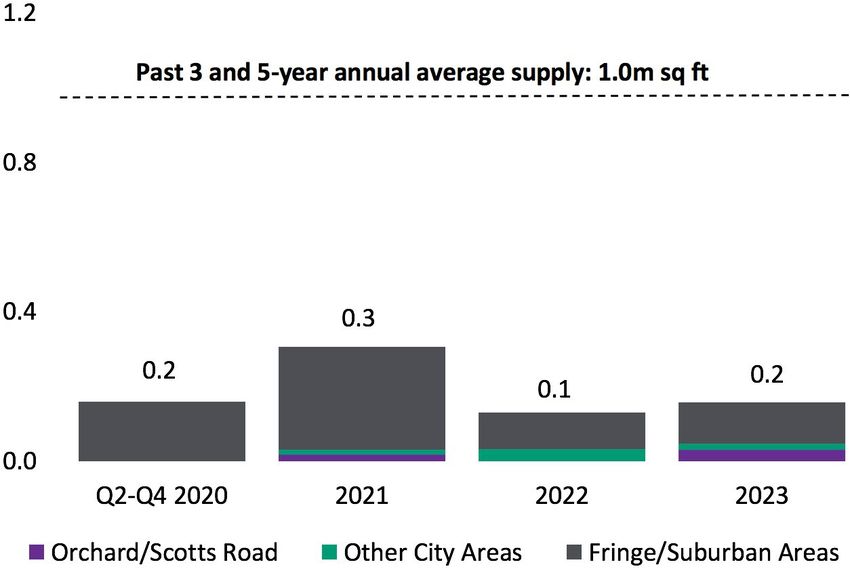
INVESTMENT

Market commentary                                                       Figure 1: Total investment sales (S$bn)
                                                                        40
Investment sales
                                                                        35
With the continual threat of the Covid-19                                                         Past 3-year annual average: $31.8bn
                                                                        30
pandemic, market sentiments have been                                                             Past 5-year annual average: $26.7bn
greatly dampened. As the global economic                                25
outlook remains uncertain, investors adopted                            20
a wait-and-see approach towards investment
                                                                        15
decisions. Additionally, transactions in Q2
2020 were generally of lower price quantum                              10
as investors were wary about their spending.                                 5
Hence, investment sales declined for the                                     0
third consecutive quarter, by a steep 53.5 per                                      2011

                                                                                           2012

                                                                                                    2013

                                                                                                              2014

                                                                                                                         2015

                                                                                                                                2016

                                                                                                                                        2017

                                                                                                                                                  2018

                                                                                                                                                              2019

                                                                                                                                                                     2020
cent quarter-on-quarter (q-o-q) to S$1.9bn
in Q2 2020 (Figure 1).                                                                                         Q1        Q2      Q3     Q4
                                                                                                                           Source: Various sources, EDMUND TIE Research
With no significant GLS sites being awarded,
there were no public investment sales in
Q2 2020, in contrast to the S$1.6bn public                              In comparison, three deals in the private investment sales market
investment sales in Q1 2020 (Table 3).                                  exceeded S$100m in Q1 2020, and two of the transactions were above
In the private investment sales market,                                 S$500m. The larger deals in Q2 2020 were from the office sector,
three transactions exceeded S$100m in                                   indicating sustained investor confidence in Singapore’s economy and
Q2 2020, of which one was above S$500m.                                 office market in the long term.

Table 3: Investment sales summary* (S$m)
 Key investment sale type                                           Q1 2020                                  Q2 2020                           Q-o-q change (%)
 Private                                                        2,399 (60.2%)                              1,853 (100%)                           -22.8
 Residential/Residential mixed-use                                615 (15.4%)                              261 (14.1%)                            -57.6
 Office/Office mixed-use                                          784 (19.7%)                              1,324 (71.5%)                          68.9
 Industrial/Industrial mixed-use                                  910 (22.8%)                               174 (9.4%)                            -80.9
 Retail/retail mixed-use                                           22 (0.6%)                                 43 (2.3%)                            95.5
 Hospitality/Hospitality mixed-use                                       -                                       -                                  -
 Shophouses                                                        15 (0.4%)                                 50 (2.7%)                            228.9
 Others                                                            53 (1.3%)                                     -                                  -
 Public (GLS)                                                    1,587 (39.8%)                                   -                                  -
 Residential/Residential mixed-use                               1,363 (34.2%)                                   -                                  -
 Office/Office mixed-use                                                 -                                       -                                  -
 Industrial/Industrial mixed-use                                   224 (5.6%)                                    -                                  -
 Hospitality/Hospitality mixed-use                                       -                                       -                                  -
 Total                                                           3,986 (100%)                              1,853 (100%)                           -53.5

* Refers to the sale of land, building and multiple units with value above S$10m.                                          Source: Various sources, EDMUND TIE Research

EDMUND TIE RESEARCH                                                                                                                                       3
Sector trends and outlook Table 4: Key private investment sale transactions in Q2 2020
• Office (and office mixed-use) investment Development Tenure/ Purchase Purchaser/
name/location (remaining tenure) price (S$) investor type
sales made up the bulk, or 71.5 per cent, of
total investment sales in Q2 2020 (Figure Office/Office mixed-use
2), with investment sales increasing by AXA Tower 99 years
840.0m
Alibaba Group
68.9 per cent q-o-q to S$1.3bn. This was (S$1,600
(50% stake) (61 years) (Listed company)
psf GFA)
mainly contributed by the sale of 30 and
50 per cent stakes of TripleOne Somerset Retail podium
315.0m
and office units 99 years Olayan Group
and AXA Tower respectively, as well as ($2,596 psf
at 30 Raffles (32 years) (Listed company)
strata area)
sale of retail and office units at 30 Raffles Place
Place (Table 4). With the sale of the 30 TripleOne 155.1m
99 years Shun Tak Holdings
per cent stake in TripleOne Somerset Somerset
(54 years)
(S$2,250 psf
(Listed company)
for S$155.1m (S$2,250 psf strata area), (30% stake) strata area)
the purchaser, Shun Tak Holdings, will Industrial/Industrial mixed-use
own 100 per cent of the building, having 66.1m
30+30 years
previously acquired 70 per cent stake in Luxasia Building
(44 years)
(S$772 psf Unknown
January 2017 from a consortium led by land area)
Perennial Holdings. The purchase came Retail/Retail mixed-use
after an asset enhancement initiative of Retail unit at 43.0m
D’League Pte Ltd
the development in 2019. The largest St Martin’s Freehold (S$4,586 psf
(Private company)
transaction in Q1 2020 was the sale of 50 Apartment strata area)
per cent stake of AXA Tower for S$840m Source: Various sources, EDMUND TIE Research
to Alibaba Group, an anchor tenant of the
building, from a Perennial-led consortium
which included Singapore Press Holdings, Figure 2: Total investment sales by asset type
HPRY Holdings and Piermont Holdings. Q1 2020 Q2 2020
Shophouse Shophouse
Once the deal is completed, AXA Tower Retail
0.4% 5.0%
0.6% Industrial Retail Residential
will commence its redevelopment. At 30 Others
Industrial 9.4% 2.3% 14.1% Office
1.3%
Raffles Place, formerly known as Chevron Mixed Use 0.8%
23.4%
House, Saudi Arabia-based Olayan Group Residential
was reported to purchase the retail 49.6%
Industrial
podium and the three lowest office floors 5.0% Office
Office
for S$315.0m ($2,596 psf strata area). Mixed Use
Mixed Use
70.7%
16.3% Office
3.4%
Source: URA, EDMUND TIE Research
EDMUND TIE RESEARCH 4• Similarly, retail investment sales almost doubled from S$22.2m While there was a slight improvement in the
in Q1 2020 to S$43.0m in Q2 2020. Nevertheless, activity in the business sentiment outlook among local firms
retail investment market was still lacklustre, as there was only for Q3 2020 from the record-low sentiments
one transaction in the quarter. In Q2 2020, a freehold retail unit in Q2 2020, forecasts for the overall business
at St Martin’s Apartment was reportedly sold to D’League Pte environment remained in contraction
Ltd, which holds the Asia distributorship for Richard Mille, and is territory, according to the Singapore
likely to become another watch showroom for the watch brand. Commercial Credit Bureau’s Business
The site is rare, with a large carpark space at the frontage. As the Optimism Index in June 2020. Despite some
commercial unit constitutes around 42 per cent share value in the optimism from the gradual reopening of
development, the purchaser will be pivotal to any en bloc sale of Singapore’s economy, uncertainties still
the development. remain, given the threat of a second wave
of Covid-19 infections, continued global
• On the other hand, industrial investment sales declined by 80.9 per
social unrest and trade tensions between US
cent q-o-q to S$174.3m in Q2 2020. This was largely contributed by
and mainland China. Nevertheless, foreign
two transactions: Luxasia Building (S$66.1m, or S$772 psf land area)
companies and investors are still seen as
and 65 Tech Park Crescent (S$25m, or S$291 psf land area). However,
confident of Singapore’s economy in the long
this sum excluded the acquisition of a four-storey warehouse at 11
term. In the first four months of 2020, a total
Sunview Way by Deutsche Bank for an undisclosed sum, which is
of S$13bn in investment commitments was
understood to be within the range of S$75m to S$100m. With the
secured, which was higher than the annual
inclusion of this transaction, the decline in industrial sales would
average amount from 2013 to 2018, as well
have been lesser. Demand for warehouse space remains strong,
as the initial forecast of S$8bn to S$10bn for
particularly due to disruption to supply chains during the Covid-19
2020. This can be attributed to the openness
pandemic, resulting in tenants requiring additional space for
and connectivity of Singapore’s economy,
stockpiling as, well as increased demand for e-commerce.
absence of export restrictions and its robust
• Residential investment sales were muted due to the lack of awarded network of free trade agreements. With
GLS sites in Q2 2020 and dampened market sentiments amid the Singapore topping the ranks as the world’s
economic uncertainties. Moreover, in contrast to four Good Class most competitive economy, investors remain
Bungalows (GCBs) being transacted in Q1 2020, there were two keen to acquire investment assets for long-
GCBs sold in Q2 2020, which was 53 Windsor Park Road at S$21.7m term stable returns, with net yields ranging
(S$1,028 psf land area) during the Circuit Breaker period and 76 from 3.0 to 6.0 per cent.
Windsor Park Road at $21.3m ($1,063 psf land area). The residential
collective sales market remained subdued as well with no collective
sales concluded in Q2 2020. However, some activity was observed,
as Wing Fong Mansions and Wing Fong Court were put up for
tender for the second time in 2020 in June, with the tenders closing
in August 2020. Residential investment sales plunged to S$261.3m
in Q2 2020 from nearly S$2.0bn in Q1 2020, with the Circuit Breaker
period limiting viewing opportunities in Q2.
EDMUND TIE RESEARCH 5OFFICE
Office demand and occupancy rates
• In Q2 2020, office demand softened due • Based on EDMUND TIE Research estimates, occupancy rates of
to the uncertain business climate and office developments* islandwide contracted by 0.8 percentage
the economic contraction. In particular, points q-o-q to 92.8 per cent in Q2 2020 (Figure 3). The decline
travel-based and hospitality-related in occupancy rates was largely due to the contraction of demand
industries were impacted greatly. for office space in the CBD and CBD Fringe subzones with net
absorption reporting negative figures of 463,000 sq ft and 12,000
• Many employees worked from home
sq ft respectively.
and adopted various teleconferencing
tools to communicate. Even though the
Figure 3: Office occupancy rates* and q-o-q percentage point change (in
Circuit Breaker measures were lifted in
arrows) in Q2 2020
June 2020, the economy did not return to
the pre-Covid-19 state. There were three
stages to the re-opening of Singapore.
Phase 1 comprised the safe re-opening
of Singapore from 2 to 18 June 2020
and employees were still encouraged
to work from home unless required to
operate machinery/software or complete
a contract/transaction that is legally
required to be done in person. It was
announced on 15 June 2020 that working
from home should continue to be a default
option even as Phase 2 of Singapore’s
economy began on 19 June 2020.
• Besides the government and landlords
supporting office tenants by waiving
their rents through the various budgets,
landlords were also more flexible on
tenants’ rent-free periods in this climate.
EDMUND TIE RESEARCH 6• Despite the current cautious and soft market, there • On the other hand, travel-based and hospitality
were still several new companies who established companies have been hardest-hit from the Covid-19
their offices in Singapore in Q2 2020, most of which pandemic due to travel restrictions and lockdowns
were from the technology and financial sectors (Table imposed by many countries. One example is Uber,
5). Technology firms are faring well in this business a multinational ride-hailing company, which will be
climate as companies push for more teleconferencing closing its Asia-Pacific HQ in Frasers Tower in the next
tools and digitalisation of work processes. 12 months.
Table 5: Key tenant movements in Q2 2020
Building Location Tenant Sector Remarks
Marina Bay Financial HSBC Finance and banking
Centre Tower 2
Marina Bay Financial CapGemini Business Services
Marina Bay (CBD) Relocation
Centre Tower 3 Here Solutions Technology
One Raffles Quay North ByteDance/Tik Tok Technology
Tower
One George Street Raffles Place (CBD) AJ Capital Finance Relocation
City House Shenton Way/ Verifone Electronic Payments
Robinson Road/ Relocation
79 Anson Road Tanjong Pagar (CBD) Inchcape Shipping Shipping
Envysion Wealth
Centennial Tower Finance New office in Singapore
Management Pte. Ltd.
CBD Fringe
Maritime catering and
Suntec Tower 2 MCTC New office in Singapore
training
Source: Various sources, EDMUND TIE Research
EDMUND TIE RESEARCH 7Rental rates Table 6: Average monthly gross office rents (S$ per sq ft)
Q-o-q
All the various subzones in the office sector Location Grade Q1 2020 Q2 2020 change
(%)
showed q-o-q declines in monthly average
rental rates in Q2 2020 (Table 6). Most Marina Bay A+ 11.30 – 13.35 11.20 – 13.25 -0.9
companies were affected by the preventive Raffles Place A 9.60 – 11.70 9.50 – 11.50 -1.5
measures taken to contain Covid-19 CBD A+ 10.20 – 12.30 10.10 – 12.15 -1.0
Shenton Way/
outbreak. Within the CBD, Grade B offices at
Robinson Road/ A 8.05 – 10.05 8.00 – 9.95 -1.0
Shenton Way/Robinson Road/Tanjong Pagar Tanjong Pagar
B 6.80 – 8.90 6.65 – 8.65 -2.0
showed the greatest rental contraction of 2.0
per cent q-o-q. Older office developments Marina Centre A 8.95 – 10.95 8.90 – 10.90 -0.5
in this subzone did not hold up so well as Beach Road/ A 9.80 – 11.80 9.75 – 11.75 -0.6
tenants relocated to more efficient and CBD fringe North Bridge
Road B 6.55 – 8.00 6.50 – 8. 00 -0.4
better quality buildings.
Orchard Road * 8.50 – 10.50 8.40 – 10.40 -0.9
Supply pipeline Decentralised Decentralised
* 5.10 – 7.80 5.10 – 7.65 -0.9
areas** areas
Total supply pipeline from Q2 2020 to 2024 is * Ungraded office space Source: EDMUND TIE Research
** Key purpose-built offices outside of CBD and CBD fringe
estimated to be approximately 4.3m sq ft (or
905,000 sq ft per annum), with most of the
supply completing in 2022 (Figure 4). In 2021, Figure 4: Office development pipeline, million (m) sq ft
pre-committed rates for most buildings in the
2.4
CBD are healthy. For instance, CapitaSpring
currently has a pre-committed rate of around 2.0
35 per cent (comprising tenants such as The
Past 3-year annual net supply: 1.6m sq ft
Work Project and J.P. Morgan). However, the 1.6
Past 5-year annual net supply: 1.4m sq ft
market will have to grapple with the huge
1.2
supply coming on board in 2022 such as
Central Boulevard Towers (NLA: 1.3m sq ft) 0.8
and Guoco Midtown (NLA: 650,000 sq ft).
0.4
Outlook 0.0
Q2-Q4 2020 2021 2022 2023 2024
The office leasing market in Singapore is Marina Bay Raffles Place
facing downward pressure. Companies are Shenton Way/Robinson Rd/Tanjong Pagar CBD Fringe
currently working hard to shore up their Decentralised areas
Source: URA, EDMUND TIE Research
cash flows as business sentiment weakens
substantially. As enterprises currently plan
Safe Management practices mandated by The current debate is the role of the office, as Work-from-Home (WFH)
the Ministry of Manpower, they are still and flexible work arrangements become more widely accepted. The
weighing their options on lease renewal and new normal of work and the role of office space will only get clearer
expansion plans in the longer term. In our over the next few months as enterprises monitor the impact on public
view, risks are on the downside for take-up health, productivity, and corporate culture of their workforce between
and rents for the rest of 2020. WFH and work-in-office options.
EDMUND TIE RESEARCH 8INDUSTRIAL
Market commentary Table 7: Singapore’s NODX and PMI
Key
Key indicators Q1 Q2
economic Key trends
2020 2020
According to the PMI reading, the indicators
manufacturing sector contracted for the • NODX declined by 4.5 per cent y-o-y
fourth straight month in May 2020 (Table 7). in May 2020, from the 9.7 per cent
This was also reflected in the sharply weaker y-o-y growth in April 2020 due to the
-4.5%
NODX performance. The implementation of contraction in the global economy
NODX 17.6% (May
the Circuit Breaker in Singapore from 7 April and trade. While the electronics
2020)
to 1 June 2020, together with the disruption segment grew, the non-electronics
sectors contracted mainly due to the
of global production and supply chains
petrochemicals cluster.
worsened the already weak industrial market.
• The PMI increased by 2.1 points from
Private demand, 45.4 in April 2020 to 46.8 in May 2020.
occupancy and supply May’s PMI reading was attributed to
46.8 slower contractions in the key indexes of
• Based on JTC’s estimates, islandwide net PMI* 45.4 (May new orders, new exports, factory output
absorption expanded from 1.3m sq ft in 2020) and employment.
Q1 2020 to 1.6m sq ft in Q2 2020. However, • The electronics sector PMI also remained
net supply reversed from 2.1m sq ft in Q1 in the contractionary territory at 46.2 in
2020 to -301,000 sq ft in Q2 2020. May 2020.
• The occupancy for warehouse space * Reading above 50 indicates an expansion, Source: MTI, Enterprise Singapore,
while below 50 indicates a contraction. SIPMM, EDMUND TIE Research
increased by 0.8 percentage points q-o-q
to 88.3 per cent in Q2 2020 (Figure 5).
• This was largely due to the increase in Figure 5: Occupancy rates of private industrial space by type
overall e-commerce sales and stockpiling
100%
by supermarkets.
• Notable leases secured in Q2 2020 95%
included: 90%
– Techcross, a ballast water management 85%
system manufacturer, which relocated
to Tradehub 21 80%
– Smart WFM, a HR workforce 75%
management consultancy, which 70%
opened its first Singapore office at
Q2 2011
Q2 2012
Q2 2013
Q2 2014
Q2 2016
Q2 2017
Q2 2018
Q2 2019
Q2 2020
Q2 2015
Mega@Woodlands
Multiple-user factory space Single-user factory space
Business park space Warehouse space
Source: JTC, EDMUND TIE Research
EDMUND TIE RESEARCH 9Rental rates Table 8: Average monthly gross rents (islandwide) (S$ per sq ft)
• According to EDMUND TIE research, Industrial Q-o-q
the monthly average rental rates for Subcategory Q1 2020 Q2 2020
type* change (%)
most market segments declined q-o-q
in Q2 2020 due to weak manufacturing Multiple- First-storey 1.70 – 2.00 1.75 – 2.00 0.2
performance (Table 8, Figure 6). The user factory Upper-storey 1.35 – 1.55 1.30 – 1.50 -0.2
location of the developments is a key
factor in determining the extent of Warehouse/
Overall 1.55 – 1.70 1.50 – 1.65 -0.1
decline of rents. For instance, the average logistics
monthly rents for business parks in the
High-tech
Central Region held up, while those in industrial
Overall 2.90 – 3.10 2.85 – 3.05 -0.4
the suburban areas contracted by 0.2 per
cent q-o-q in Q2 2020. Business Central Region 4.40 – 4.95 4.40 – 4.95 0.0
park
Supply pipeline Suburban 3.55 – 3.85 3.50 – 3.80 -0.2
• The supply pipeline from Q2 2020 to 2023 * In-house estimates of key selected Source: EDMUND TIE Research
is around 27.9 m sq ft (NLA) or an average private industrial premises.
of 7.4m sq ft per annum, staying below
the 3- and 5-year annual average of 8.2m Figure 6: Private monthly industrial gross rents (S$ psf) by type
and 12.4m sq ft respectively (Figure 7). 6
• The majority of the supply pipeline will
be completed between Q2 and Q4 2020 5
(41.8 per cent), followed by 2022 with
4
8.5m sq ft (30.4 per cent). The bulk of
the pipeline supply will be single-user 3
factories between Q2 and Q4 2020.
2
Outlook
The outlook of the industrial sector is 1
Q2 2011
Q2 2012
Q2 2013
Q2 2014
Q2 2015
Q2 2016
Q2 2017
Q2 2018
Q2 2019
Q2 2020
envisaged to remain markedly uncertain
in 2020, considering the fluid and
unpredictable nature of the pandemic, a
possibly steep global economic slowdown First-storey multiple-user factory Upper-storey multiple-user factory
and resultant ramifications on Singapore’s Hi-tech industrial space Business park (Central Region)
open manufacturing sector. Source: EDMUND TIE Research
The high number of Covid-19 infections in
many worker dormitories has contributed to Figure 7: Private industrial development pipeline (with planning approvals
disruptions in production and construction and GLS sites which are pending approvals), million(m) sq ft
capacities, as well as to a certain extent, 16
logistics efficiency and workflow. As 14
companies review their demand needs Past 5-year annual average supply: 12.4m sq ft
12
and expansion plans in the wake of the
weakened economic outlook, we expect the 10 Past 3-year annual average supply: 8.2m sq ft
impact on the industrial property market 8
to be felt in the next few quarters. Overall 6
rents of factories are likely to post an overall 4
decline for 2020. Rents in the business park 2
and hi-tech sectors could also ease further 0
in the near term owing to the pandemic. Q2-Q4 2020 2021 2022 2023
Nonetheless, the bright spot for the industrial Extensions, additions and alterations to industrial properties
sector is the warehouse sector, as rising Warehouse developments
online sales and the increase in groceries Multiple-user industrial developments
sales incentivise retailers to stockpile and Single-user industrial developments
expand their warehouse facilities to cater to Business park developments
the surge in demand. Source: EDMUND TIE Research
EDMUND TIE RESEARCH 10RETAIL
Market commentary Figure 8: Y-o-y change in retail sales index (excluding motor vehicles)
15%
Key indicators
• The retail sector is facing one of its greatest 10%
challenges as the pandemic necessitated
the temporary closure of many retail 5%
outlets with the exception of essential
services, such as F&B, supermarkets, 0%
clinics and approved healthcare-related
trades during the Circuit Breaker period -5%
(7 April to 1 June 2020) as well as in Phase 1
of Singapore’s reopening (2 to 18 June 2020). -10%
2003 1Q
2004 1Q
2005 1Q
2006 1Q
2007 1Q
2008 1Q
2009 1Q
2010 1Q
2011 1Q
2012 1Q
2013 1Q
2014 1Q
2015 1Q
2016 1Q
2017 1Q
2018 1Q
2019 1Q
2020 1Q
• Due to travel restrictions, visitor arrivals
plunged to around 2.7m visitors in Q1 2020,
the lowest since Q4 2009. It was reported Source: Department of Statistics Singapore
by the Singapore Tourism Board (STB)
in February 2020 that Singapore lost an
average of 18,000 to 20,000 international Figure 9: Y-o-y change in food and beverage services index
visitor arrivals daily and this loss is 25%
expected to increase further. In April 2020, 20%
there were only 748 visitors to Singapore. 15%
• As international visitor arrivals fell and 10%
residents were forced to stay home except 5%
when going out for essential services, 0%
retailers faced increasing pressures to -5%
sustain their businesses while coping -10%
with fixed overhead costs. The Covid-19 -15%
(Temporary Measures) Act was passed -20%
to ensure a pass-through of property tax -25%
2003 1Q
2004 1Q
2005 1Q
2006 1Q
2007 1Q
2008 1Q
2009 1Q
2010 1Q
2011 1Q
2012 1Q
2013 1Q
2014 1Q
2015 1Q
2016 1Q
2017 1Q
2018 1Q
2019 1Q
2020 1Q
rebate from property owners to tenants.
A new Bill on rental rebates, involving
landlords and the government, was also Source: Department of Statistics Singapore
dished out to help retailers. This will add
cashflow strains on landlords, especially
for smaller landlords.
• Retail sales index (excluding motor
vehicles) fell for the sixth consecutive
quarter by 6.2 per cent y-o-y in Q1 2020
(Figure 8). The F&B services index also
contracted by 10.5 per cent y-o-y in Q1
2020, after seven consecutive quarters of
increases (Figure 9).
EDMUND TIE RESEARCH 11• In April 2020, the worst performing sectors Figure 10: Retail sales index (Apr 2020), y-o-y change
were watches and jewellery and wearing
Watches & Jewellery -87.8%
apparel and footwear (Figure 10) as
Wearing Apparel & Footwear -85.3%
people shopped for essential goods rather Department Stores -84.5%
than luxury items in view of the sober Optical Goods & Books -64.4%
economic climate. Overall, the total retail Recreational Goods -63.3%
sales (excluding motor vehicles) declined Others -58.9%
by 33.4 per cent y-o-y in April 2020. Food & Alcohol -53.5%
Cosmetics, Toiletries & Medical Goods -46.2%
Furniture & Household Equipment -37.9%
TotalTotal
(Excluding Motor
(Excluding Vehicles)
Motor Vehicles) -33.4%
Computer & Telecommunications Equipment -1.3%
Mini-marts & Convenience Stores 10.7%
Supermarkets & Hypermarkets 77.4%
-100% -80% -60% -40% -20% 0% 20% 40% 60% 80% 100%
Source: Retail Sales Index at Current Prices (SSIC 2015 Version 2018)
from Department of Statistics Singapore
• The food and beverage index trended Figure 11: Food and Beverage index (Apr 2020), y-o-y change
downwards by 53.2 per cent y-o-y in
April 2020, and restaurants (which were Restaurants -66.9%
largely relying on takeaway sales) were
the hardest hit, contracting by 66.9 per
Food Caterers -59.8%
cent y-o-y (Figure 11).
Total
Total -53.2%
Cafes, Food Courts & Other Eating Places -45.5%
Fast Food Outlets -27.7%
-80% -70% -60% -50% -40% -30% -20% -10% 0%
Source: Food & Beverage Services Index at Current Prices
(SSIC 2015 Version 2018) from Department of Statistics Singapore
EDMUND TIE RESEARCH 12• As people started to shop online due Figure 12: Retail sales value (S$ millions) and proportion of online retail
to the temporary closure of many retail sales (%)
outlets, the online retail sales proportion 5,000 20
increased to 17.8 per cent in April 2020 4,500 18
4,000 16
(Figure 12).
3,500 14
3,000 12
2,500 10
2,000 8
1,500 6
1,000 4
500 2
0 0
2018 Jul
2019 Jul
2018 Jan
2018 Feb
2018 Mar
2018 Apr
2018 May
2018 Jun
2018 Aug
2018 Sep
2018 Oct
2018 Nov
2018 Dec
2019 Jan
2019 Feb
2019 Mar
2019 Apr
2019 May
2019 Jun
2019 Aug
2019 Sep
2019 Oct
2019 Nov
2019 Dec
2020 Jan
2020 Feb
2020 Mar
2020 Apr
Retail Sales Value - Estimated (S$ millions) (LHS)
Online Retail Sales Proportion (%) (RHS)
Source: Department of Statistics Singapore, EDMUND TIE Research
Private demand and occupancy
• Based on URA statistics, islandwide net absorption declined further to -798,000 sq ft in Q2 2020 from -561,000 sq ft
in Q1 2020. The food & beverage sector was one of the more badly affected sectors due to the preventive measures
implemented to contain the Covid-19 pandemic.
Orchard/Scotts Road (OSR) Other city areas 1 (OCA) Fringe/Suburban areas2 (FSA)
Net • The net absorption was reversed • Net absorption contracted by • Net absorption declined further
absorption from 5,000 sq ft in Q1 2020 to -243,000 sq ft in Q2 2020 to -456,000 sq ft in Q2 2020,
-99,000 sq ft in Q2 2020 • As people started to carry out remote from -202,000 sq ft in Q1 2020
• The lack of tourist arrivals in Q2 2020 working and avoided going out, retail • Retailers in FSA were affected
contributed to the decline in demand outlets in the OCA were impacted greatly due to the lack of sales as
greatly by the decline in sales people avoided going to malls
Occupancy • Occupancy contracted by 1.2 • Occupancy trended downwards by 1.9 • Occupancy rates declined by 2.1
percentage points q-o-q to 90.8 per percentage points q-o-q to 88.3 per percentage points q-o-q to 88.8
cent in Q2 2020 (Figure 13) cent in Q2 2020 per cent in Q2 2020
Closures • Modesto’s @ Orchard (F&B) at • China Club (F&B) at Capital Tower • Esprit (fashion and apparel)
(Q2 2020) Orchard Rendezvous Hotel • Rookery (F&B) at Capital Tower closing all outlets
• Salt Grill & Sky Bar (F&B) at • Tao Seafood (F&B) at Asia Square • The Chophouse (F&B) at Vivocity
ION Orchard Tower 2
• Imperial Treasure Nan Bei • Muji (household and consumer goods)
Restaurant (F&B) at Ngee Ann City at Marina Square
¹ Other City Areas refer to Downtown Core and Rest of Central Area Source: URA, EDMUND TIE Research
² Fringe/Suburban Areas refer to Fringe Areas and Suburban Areas (Outside Central Region)
EDMUND TIE RESEARCH 13Rental rates Figure 13: Retail occupancy rates (Q2 2020)
Monthly retail rents contracted further in
Q2 2020 amidst the preventive measures
taken to contain the Covid-19 pandemic.
First, the number of short-term visitors to
Singapore plummeted to a historic low of
748 in April 2020, after the ban on short-
term visitors was put in place on 23 March
2020 (entry allowed only under extenuating
circumstances). Second, the implementation
of the Circuit Breaker from 7 April to 1 June
2020 also dampened the already weak
retail market, as only essential retailers
such as supermarkets or food and beverage
outlets could operate. On 21 April 2020, the
government also announced that the list of
essential services has been tightened, with
shops selling snacks, drinks and desserts, as
Source: URA, EDMUND TIE Research
well as barber and hairdressing shops being
prohibited from operation. From 12 May
2020, businesses like home-based bakeries,
Table 9: Average monthly gross rents (S$ per sq ft)
selected food shops, barbers, manufacturing
of confectionery and laundry services were Q-o-q
Location Level Q1 2020 Q2 2020
allowed to operate. Most retail outlets change (%)
continued to remain closed in Phase 1 of Orchard/ First-storey 34.10 – 39.10 34.00 – 39.05 -0.2
Singapore’s reopening. On 19 June 2020, Scotts Road
(OSR) Upper-storey 13.80 – 17.80 13.40 – 17.30 -3.0
most retail outlets were allowed to resume
operations. Other city First-storey 16.20 – 22.15 16.10 – 22.10 -0.3
areas (OCA) Upper-storey 8.10 – 12.10 8.00 – 12.00 -0.6
In terms of rental performance, upper-
storey monthly average rents in the OSR Fringe/ First-storey 25.35 – 31.35 25.25 – 31.25 -0.2
Suburban
declined the most as compared to the other areas (FSA) Upper-storey 14.80 – 19.60 14.50 – 19.30 -2.0
subzones, largely due to the lack of visitor
Source: EDMUND TIE Research
arrivals (Table 9). On the other hand, the
average monthly rents for first-storey retail
in the FSA held up relatively well in Q2 2020,
due to the proximity of these outlets to
residential estates. People were encouraged
to do most of their daily activities at home
and only visited nearby retail outlets to get
their essential necessities.
EDMUND TIE RESEARCH 14Supply pipeline Figure 14: Retail development pipeline, million (m) sq ft The supply pipeline from Q2 2020 to 2023 is projected to be limited, comprising some 750,000 sq ft NLA (Figure 14). This is lower as compared to the past 3- and 5-year annual average supply of 1.0m sq ft. The additions/ alterations to existing i12 Katong mall is the largest development with an NLA of 189,000 sq ft, and the works are estimated to complete in 2021. Outlook Moving forward, it will be some time before the retail market finds a footing. We expect cautious behaviour to prevail Source: URA, EDMUND TIE Research among consumers even as Singapore starts reopening itself as there may be a second wave of infection as seen from other countries. Retailers will also need to uphold strict safety distancing measures and new guidelines when most of them reopen to a new normal during Phase 2, thereby limiting sales volume. The poor business climate fuelled by the increase in retrenchments as well as the lack of tourism spending will weigh on the luxury and discretionary retail segments, while the sales of groceries retailers and food services are anticipated to grow. EDMUND TIE RESEARCH 15
RESIDENTIAL

Market commentary                               Table 10: URA Residential Price Indices in Q2 2020

                                                 Type/Market          Price Index
Key indicators                                                                          Q-o-q change (%)          Y-o-y change (%)
                                                 segment               (Q2 2020)
• Based on Q2 2020 Urban Redevelopment           All Residential
  Authority (URA) statistics, private home                               152.6                0.3                      1.2
                                                 property
  prices registered a slight q-o-q uptick of
                                                 Non-Landed
  0.3 per cent, after a decline of 1.0 per       property
                                                                         148.7                0.4                      0.4
  cent in Q1 2020 (Table 10).
                                                 Core Central
                                                                         134.6                2.7                      -0.5
• Private non-landed property prices rose        Region (CCR)
  by 0.4 per cent q-o-q in Q2 2020 after         Rest of Central
                                                                         150.0                -1.7                     -2.2
  two consecutive quarters of decline.           Region (RCR)
  All market segments except the RCR             Outside Central
  registered growths in prices, with prices                               177.4               0.1                      3.3
                                                 Region (OCR)
  of non-landed properties in the CCR
                                                 Landed
  and OCR increasing by 2.7 per cent and                                 170.3                0.0                      3.7
                                                 property
  0.1 per cent q-o-q respectively. Prices of
  non-landed properties in the RCR fell by                                                           Source: URA, EDMUND TIE Research

  1.7 per cent on a q-o-q basis in Q2 2020.

• Similarly, URA Landed Property Price          Figure 15: New housing loans limits granted (S$m)
  Index remained unchanged q-o-q in Q2          $m
  2020, after a q-o-q drop of 0.9 per cent in    14,000
  Q1 2020.                                       12,000
• Relief is provided for Singaporean married     10,000
  couples who seek ABSD remission for the         8,000
  joint purchase of their second residential      6,000
  property, with an extension of six months
                                                  4,000
  for the sale of their first residential
  property. This will help contain selling        2,000
  pressures in the market.                            0
                                                            Q1 2015
                                                            Q2 2015
                                                            Q3 2015
                                                            Q4 2015
                                                            Q1 2016
                                                            Q2 2016
                                                            Q3 2016
                                                            Q4 2016
                                                            Q1 2017
                                                            Q2 2017
                                                            Q3 2017
                                                            Q4 2017
                                                            Q1 2018
                                                            Q2 2018
                                                            Q3 2018
                                                            Q4 2018
                                                            Q1 2019
                                                            Q2 2019
                                                            Q3 2019
                                                            Q4 2019
• Housing loans continued to grow for the                   Q1 2020
  third consecutive quarter by 49.2 per
  cent y-o-y in Q1 2020 (Figure 15), which             Source: Monetary Authority of Singapore (as of 15 June 2020), EDMUND TIE Research
  may be attributed to lower interest rates,
  allowing homeowners to secure loans at
  favourable terms.

EDMUND TIE RESEARCH                                                                                                    16
• New sales volume dominated the private Figure 16: Private homes sales volume (excluding ECs) and URA All
residential market in Q2 2020 (Figure 16), Residential Price Index
as homebuyers purchased homes with 12,000 160
the aid of virtual showflats or had visited 10,000
152.6 155
the showflats before the Circuit Breaker 150
8,000
period. Nevertheless, new sales declined
145
by 27.1 per cent y-o-y and 20.3 per cent 6,000
140
q-o-q to 1,713 units in Q2 2020, despite
4,000
an uptick in new sales in June 2020 due 135
to pent-up demand. The lower new sales 2,000 130
in Q2 2020 was largely attributed to a 0 125
reduction in new launches, closure of
Q2 2011
Q2 2012
Q2 2013
Q2 2014
Q2 2015
Q2 2016
Q2 2017
Q2 2018
Q2 2019
Q2 2020
show galleries during the Circuit Breaker
period as well as dampened sentiment Units Sold in Secondary Market (subsale and resale) (LHS)
with the gloomy economic outlook. New Sales Units Sold by Developers (LHS)
Property Price Index of All Residential Properties (RHS)
• In Q2 2020, there were three new Source: URA REALIS, EDMUND TIE Research
launches. Kopar at Newton, which was
launched before the Circuit Breaker
period from 7 April to 1 June 2020, after its 7 April 2020. Most of the units sold were the smaller one-bedroom
sale preview in late March 2020, was the and two-bedroom apartment units.
largest project. Despite uncertainty amid
• Resale volume fell by a larger magnitude of 55.1 per cent on a q-o-q
anticipated recession, the take-up rate of
basis to 951 units in Q2 2020. This may be due to the prohibition of
31.7 per cent (120 of 378 units sold) in Q2
home-viewing during the Circuit Breaker period and sellers may hence
2020 of Kopar at Newton was relatively
withhold their selling decisions until the easing of the Circuit Breaker
encouraging (Table 11). Transacted prices
measures, as viewing is more important for completed properties.
at Kopar at Newton ranged from S$2,083
to S$2,531 per sq ft. Out of the 120 units • Total private homes sales volume in Q2 2020 amounted to 2,664
sold, 70 units were transacted before the units, a q-o-q drop of 37.6 per cent. This followed sales volume of
commencement of the Circuit Breaker on 4,269 units in Q1 2020, which was 12.5 per cent lower q-o-q.
Table 11: Non-landed private residential launches (excluding ECs) in Q2 2020
Launch Initial sell- Indicative
District Total Units
Development Developer month in down rate average price
(market segment) units sold
2020 (%) (S$ psf)
Kopar at Newton Chip Eng Seng 9 (CCR) 378 April³ 120 31.7 2,272
15 Holland Hill Kheng Leong 10 (CCR) 59 April 3 5.1 2,797
Parkwood
Oxley Holdings 19 (OCR) 18 June 1 5.6 1,323
Residences
³ The sales preview for Kopar at Newton was in March 2020 and it was officially launched in the start of April 2020. Source: URA, EDMUND TIE Research
EDMUND TIE RESEARCH 17• In the private residential leasing market, Figure 17: Number of private home rental transactions (excluding ECs)
total rental volume fell by 18.4 per cent 100,000
y-o-y and 10.0 per cent q-o-q to 19,506
transactions in Q2 2020 (Figure 17). This 80,000
was attributed to the Circuit Breaker,
which prevented prospective tenants 60,000
from visiting and viewing properties
40,000
for lease, as well as travel restrictions/
lockdowns that reduced the rental 20,000
demand. The URA Rental Index for All
Residential Property declined by 1.2 0
2011
2012
2013
2014
2015
2016
2017
2018
2019
2020
per cent q-o-q in Q2 2020 after a q-o-q
rebound of 1.1 per cent in Q1 2020,
Q1 Q2 Q3 Q4
which may be due to the reduction of
Source: REALIS, EDMUND TIE Research
companies’ rental budgets and salaries
amid the economic uncertainties. Figure 18: Number of private homes in the pipeline (excluding ECs)
• As at Q1 2020, there are nearly 52,100 20,000
units in the pipeline. The bulk of the
pipeline supply is slated to complete in 16,000 5-year annual average completions: 13,991 units
2022 and 2023 (Figure 18). Around 4,500
units will be expected to complete from 12,000 3-year annual average completions: 10,437 units
Q2 to Q4 2020. About 37.9 per cent of the
8,000
pipeline supply (around 19,700 units) are
sold while the remaining 62.1 per cent 4,000
(around 32,000 units) are unsold. Based
on the five-year annual average take-up 0
of new sale units of around 8,900 units,
2023
Q2-Q4 2020
2021
2022
2024
the unsold units will take around 3.6 years
to be absorbed. However, a prolonged
climate of lower sales will reduce the
absorption rate. Source: REALIS, EDMUND TIE Research
Outlook mainland Chinese homebuyers were reported to have snapped up
• To provide support for the construction luxury properties in Singapore through online marketing platforms,
industry which was impacted by stop as they seek to divert their funds overseas as a hedge against
work orders arising from the Covid-19 inflation and devaluation risks. With countries gradually easing their
pandemic, the government announced on lockdown measures, foreign demand for residential properties may
7 May 2020 that the Project Completion be expected to improve over time.
Period for eligible residential, commercial • After the Circuit Breaker period of nearly two months, Phase 1
and industrial developments would be of Singapore’s reopening began on 2 June 2020, while Phase 2
extended by six months, providing some commenced on 19 June 2020. As such, the sales galleries as well as
relief for developers as they faced delays physical viewings and interactions are able to take place. The pent-
in construction progress. up demand is expected to lead to an increase in buying activity,
• Despite overseas travel restrictions/ with new projects launching in H2 2020. We expect projects that
lockdowns, foreign demand for are well-located, attractively priced and possessing strong project
residential properties in Singapore is attributes to continue to attract buyers. The resale market is also
not absent altogether. High-net worth expected to see stronger sales as viewings resume.
EDMUND TIE RESEARCH 18APPENDIX
Appendix 1: Covid-19 Preventive Measures (Jan till Jun 2020)
Date of Details Affected Sector(s)
announcement
23 Jan 2020 • Travel restrictions were imposed on visitors from Wuhan. From 1 February 2020, travel or transit into Singapore was banned • All
for all visitors with recent travel history to mainland China within the last 14 days.
22 Mar 2020 • Singapore announced a ban on all short-term visitors arriving or transiting through Singapore. • Retail/Hospitality
24 Mar 2020 • Any residents returning from the US or the UK would be required to serve out their Stay-Home Notices (SHN) in dedicated hotels. • Retail/Hospitality
• Under the Infectious Diseases (Measures to Prevent Spread of Covid-19) Regulations 2020, all sporting events, exhibitions, • Retail/Hospitality
trade fairs, and public entertainment at cinemas, theatres, amusement or computer games centres, among other venues,
were prohibited between 27 March and 30 April 2020, both dates inclusive.
• Enrichment activities for children at an enrichment or tuition centre or sporting facility, and the provision of goods, • Retail/Hospitality
entertainment or services at bars, karaoke lounges, nightclubs or discotheques were also prohibited.
• Owners or occupiers of places such as eateries and malls must also ensure that seats that are not fixed must always be at • Retail
least 1m apart. Public places such as transit stations and shopping centres were required to reduce crowd density to one
person per 16 square metres of space. If the seats are fixed to the floor, alternate seats must be demarcated as seats not to
be occupied.
• Groups other than for work and school purposes would be limited to 10 people at any time, as well as for groups for diners • All
and private worship.
28 Mar 2020 • The government issued an advisory that people should stay at home and avoid malls except for buying essentials such as • Retail
food and groceries - which could also be bought via online channels.
4 Apr 2020 • The 14-day Stay-Home Notice (SHN) at dedicated hotels was expanded to include returnees/residents coming back from • Retail/Hospitality
ASEAN countries, France, India and Switzerland, in addition to those coming back from the USA and UK.
7 Apr 2020 • Most workplaces except for essential services and key economic sectors would be shut down temporarily from 7 April 2020 • All
as part of the government’s stricter measures to “minimise physical contact” and keep the Covid-19 outbreak in check. It
was also known as the Circuit Breaker period.
• Food establishments, markets and supermarkets, clinics, hospitals, utilities, transport and key banking services would • Retail
however remain open.
• People should go out only to do essential things - to buy food at markets, or to take out from restaurants and hawker • Retail
centres, or to exercise in neighbourhood parks, keeping a safe distance from others. Only takeaway was allowed, and
dining in was prohibited.
• Under The Covid-19 (Temporary Measures) Act, there was a ban on social gatherings of any size in private or public areas • All
from 7 April 2020 and that would be valid for up to 6-12 months.
9 Apr 2020 • All travellers returning to Singapore from overseas will have to serve their 14-day SHN at dedicated facilities instead of in • All
their homes. The Ministry of Health announced that the rule had been extended to all Singaporeans, permanent residents
and long-term pass holders regardless of the country they were coming from.
11 Apr 2020 • People using public transport will be required to wear masks as safe distancing would not be possible. The Singapore Food • All
Agency said that masks would be required for anyone who sells or prepares food. Anyone who went to supermarkets,
convenience stores, pharmacies or shopping malls would need to wear a mask.
21 Apr 2020 • The circuit breaker period was extended to 1 June, partly due to a sustained number of unlinked cases in the community. • All
Existing measures would also be tightened until 4 May, including tightening the list of essential services, and restricting
entry to certain hotspots such as wet markets. In addition, all workers residing in dormitories would not be allowed to
resume work until 4 May.
• Crowd control will be implemented at four wet markets, with the last digit of NRICs to control entry. • Retail
• The list of essential services was tightened, with shops selling snacks, drinks and desserts, as well as barber and hairdressing • Retail
shops disallowed to operate. Eateries and vending machines in parks would also be shut. Optician shops would no longer
allow walk-ins. Pet and laundry shops were ordered to close their physical shops, with only online services available. The
number of staff in shops were reduced and a ban on cross-deployment was imposed. Temperature taking would be taken
before entry to all supermarkets and malls, along with particulars for contact tracing.
1 May 2020 • SHN for those holding construction work permits and S Passes was extended to 18 May. • All
5 May 2020 • Some Circuit Breaker measures was eased, with Traditional Chinese Medicine shops and essential condo activities allowed. • Retail
12 May 2020 • Businesses like home-based bakeries, some food shops, barbers, manufacturing of confectionery, and laundry was • Retail
permitted to operate.
19 May 2020 • Phase 1 of Singapore’s reopening begun on 2 Jun 2020, with more workers returning to work, starting with businesses in • All
critical sectors. Most retail outlets remain closed with people allowed to visit parents or grandparents (limited to 2 people
from same household in a day). Selected healthcare services could also resume.
15 Jun 2020 • Phase 2 of Singapore’s reopening begun on 19 Jun 2020. Dining in, personal wellness services such as massages and spas, • Retail
as well as home-based services like private tuition could resume, except for singing or voice training classes.
• Retail shops, parks, beaches, and sports and other public facilities, including stadiums, swimming pools, playgrounds and • Retail
fitness studios, could also reopen, as could similar facilities in condominiums.
• Singapore residents and long-term pass holders entering Singapore from selected countries, including Australia, mainland • All
China and South Korea, were allowed to serve their SHN at home, instead of at dedicated facilities, but they would be
subject to a compulsory Covid-19 test towards the end of their SHN, for which they must pay.
• Employees should not mix socially and working from home should remain the default option.
28 Jun 2020 • Social gatherings of up to five people are allowed.
• Residential showflats were allowed to resume operations. • Residential
• The tourism businesses in Singapore will be permitted to resume operations in stages from July 1, starting with 13 • Retail/Hospitality
attractions. They are:
– Bounce – Madame Tussauds – ArtScience Museum, Sands SkyPark and
– Flower Dome at – River Safari Observation Deck and Casino at Marina Bay Sands
Gardens by the Bay – Singapore Zoo – Universal Studios Singapore, S.E.A. Aquarium and
– Jurong Bird Park – Zero Latency Casino at Resorts World Sentosa.
• As a further precautionary measure, most attractions would be restricted to no more than 25 per cent of their operating
capacity at any given time.
• Access to the casinos would be limited to existing casino members and annual levy holders only.
Source: Ministry of Trade and Industry, Ministry of Finance, Ministry of Health, Singapore Tourism Board, EDMUND TIE Research
EDMUND TIE RESEARCH 19Appendix 2: Government Support Measures (Jan till Jun 2020)
Affected
Government support
sector(s)
All sectors Ease Labour Costs for Employers
• Waiver of monthly Foreign Worker Levy due in April and May 2020
• Foreign Worker Levy Rebate of S$750 in April and May 2020 from levies paid this year, for each Work Permit or S Pass holder
Enhance Financing Support
• Increase Government’s risk share of loans from 80 per cent to 90 per cent for loans initiated from 8 April 2020 till 31 Mar 2021, under the
Temporary Bridging Loan Programme, Enterprise Financing Scheme – Working Capital Loan, and Enterprise Financing Scheme – Trade Loan
Ensure Pass-through of Property Tax Rebate
• Up to 100 per cent property tax rebate for non-residential properties, for tax payable in 2020.
– Retail/Hospitality - 100% – Integrated Resorts - 60% – Office/Industrial - 30%
• The COVID-19 (Temporary Measures) Act to ensure pass-through of property tax rebate from property owners to tenants.
Rental Relief for Government Tenants
– Retail - 4 months – Industrial/Office - 2 months
Expanding Rental Relief for SMEs
– Offset 2 months’ rental for qualifying SME tenants of commercial properties
– Offset 1 month’s rental for qualifying SME tenants of industrial and office properties
Amended Covid-19 laws (for SMEs)
As part of the changes that will be implemented at the end of July 2020, commercial property owners must give eligible tenants a waiver of base
rent for June and July. Landlords that own industrial and office properties will have to waive the base rent for the month of May.
Jobs Support Scheme
• The government will pay 75 per cent of the first S$4,600 of monthly wages paid in April and May 2020 for every local worker in employment.
• Wage support levels will be differentiated by sectors for the remaining qualifying months⁴.
• Firms will receive the first payout in April 2020, including the enhanced payout for April wages.
• Extended for 1 more month to cover wages in August 2020, bringing total coverage to 10 months of wages.
– 25% to 75% of the first S$4,600 of wages for each local employee
• For firms that are not allowed to resume operations, the government will continue providing wage support at 75% until August 2020 or when
allowed to reopen, whichever is earlier.
• Increased support for some affected sectors (e.g. aerospace, retail, marine and offshore) from 25% to 50% or 75%.
Self-Employed Person (SEP) Income Relief Scheme (SIRS)
• Annual value threshold raised from S$13,000 to S$21,000, to support more SEPs
• Automatic inclusion of SEPs who also earn a small income from employment work
• Other criteria remain unchanged
• Eligible SEPs will receive three quarterly cash payouts of S$3,000 each in May, July, and Oct 2020
COVID-19 Support Grant
• The government to roll out Covid-19 Support Grant from May 2020 to give those who lose their jobs because of the crisis, an S$800 monthly grant
for three months.
Solidarity Utilities Credit
• One-off S$100 Solidarity Utilities Credit for each household with at least one Singapore Citizen.
• Covers all property types.
• Will be credited in households’ July or August 2020 utilities bills with SP Group.
• Comes on top of the Solidarity Payment and Care & Support Package.
Residential • Six-month extension of the project completion period (PCP) for residential, commercial and industrial development projects.
• Six-month extension for the commencement, completion and sale of housing units in residential development projects relating to Additional
Buyer’s Stamp Duty (ABSD) remission for housing developers.
• An extension of the PCP and/or disposal period by up to six months for residential development projects under the Qualifying Certificate regime
for foreign housing developers; and
• A six-month extension for the sale of the first residential property in relation to ABSD remission for the second residential property bought by a
Singaporean married couple.
• The Ministry of Law will enhance the relief afforded by the Covid-19 (Temporary Measures) Act in two ways. First, two new contracts will be
covered under the Act. These are (i) options to purchase (“OTPs”); and (ii) sale and purchase agreements (“S&P Agreements”) or agreements for
lease (“AFLs”) for residential property. Only OTPs and S&P Agreements / AFLs between housing developers (both private housing developers and
the Housing & Development Board) and buyers will be covered. Second, additional actions relating to the unilateral increase of charges will be
prohibited under the Act.
• Homeowners who have difficulty paying their mortgage can get help in deferring payment of principal and interest up to 31 December 2020. The
scheme covers purchase loans and mortgage equity withdrawal loans, including debt reduction plans, for owner-occupied property as well as
investment residential properties.
Retail Digital Resilience Bonus
• Pilot starting with food services and retail sectors
• Payout of up to S$5,000 to help businesses digitalise with:
– PayNow Corporate, e-invoicing, business process or e-commerce solutions
• Additional payout of S$5,000 for businesses that use advanced solutions.
⁴75 per cent wage support for aviation, accommodation, and tourism sectors, Source: Ministry of Trade and Industry, Ministry of Finance,
50 per cent for food services sectors, and 25 per cent for all other sectors. Ministry of Health, EDMUND TIE Research
EDMUND TIE RESEARCH 20CONTACTS Ong Choon Fah
Chief Executive Officer
+65 6393 2318
choonfah.ong@etcsea.com
PROFESSIONAL SERVICES
Valuation Advisory Property Tax Advisory & Hospitality Property Management
Poh Kwee Eng Statutory Valuation Nicholas Cheng Kwok Sai Kuai
Executive Director Ng Poh Chue Executive Director Executive Director
Regional Head of Executive Director +65 6393 2317 Regional Head of
Valuation Advisory +65 6393 2515 nicholas.cheng@etcsea.com Property Management
+65 6393 2312 pohchue.ng@etcsea.com +65 6417 9229
kweeeng.poh@etcsea.com Heng Hua Thong saikuai.kwok@etcsea.com
Senior Advisor
Nicholas Cheng Research & Consulting +65 6393 2398 Paul Wong
Executive Director huathong.heng@etcsea.com Senior Director
Ong Choon Fah
+65 6393 2317 +65 6417 9225
Chief Executive Officer Tay Hock Soon
nicholas.cheng@etcsea.com paul.wong@etcsea.com
+65 6393 2318 Senior Director
choonfah.ong@etcsea.com +65 6887 0088
tayhs@treetops.com.sg
Lam Chern Woon
Senior Director
+65 6393 2340
chernwoon.lam@etcsea.com
AGENCY SERVICES REGIONAL OFFICES
Investment Advisory Business Space & Retail Malaysia
Ong Choon Fah Heng Hua Thong Chua Wei Lin Eddy Wong
Chief Executive Officer Senior Advisor Executive Director Managing Director
+65 6393 2318 +65 6393 2398 Regional Head of +603 2024 6380
choonfah.ong@etcsea.com huathong.heng@etcsea.com Business Space eddy.wong@ntl.my
+65 6393 2326
Poh Kwee Eng Swee Shou Fern weilin.chua@etcsea.com
Executive Director Executive Director
+65 6393 2312 +65 6393 2523
kweeeng.poh@etcsea.com shoufern.swee@etcsea.com China Desk Thailand
Yam Kah Heng Tan Chun Ming Ong Choon Fah Ong Choon Fah
Senior Advisor Executive Director Chief Executive Officer Chief Executive Officer
+65 6393 2368 Regional Investment Advisory +65 6393 2318 +65 6393 2318
kahheng.yam@etcsea.com +65 6393 2360 choonfah.ong@etcsea.com choonfah.ong@etcsea.com
chunming.tan@etcsea.com
Yam Kah Heng Punnee Sritanyalucksana
Senior Advisor Chief Operating Officer
Auction & Sales Residential +65 6393 2368 +66 2257 0499 ext 101
kahheng.yam@etcsea.com punnee.s@etcthailand.co.th
Nicholas Cheng Margaret Thean
Executive Director Executive Director Heng Hua Thong
+65 6393 2317 Regional Head of Residential Senior Advisor
nicholas.cheng@etcsea.com +65 6393 2383 +65 6393 2398
margaret.thean@etcsea.com huathong.heng@etcsea.com
Joy Tan
Senior Director Karen Ong Tan Chun Ming
+65 6393 2505 Senior Director Executive Director
joy.tan@etcsea.com +65 6393 2366 +65 6393 2360
karen.ong@etcsea.com chunming.tan@etcsea.com
Editor: Authors:
Saleha Yusoff Lam Chern Woon Leong Kin Mun Isabelle Seto
Executive Director Senior Director Assistant Manager Senior Research Analyst
Regional Head of Research & Consulting Research Research
Research & Consulting +65 6393 2340 +65 6393 2548 +65 6393 2382
+603 2161 7228 ext 302 chernwoon.lam@etcsea.com kinmun.leong@etcsea.com isabelle.seto@etcsea.com
saleha.yusoff@etcsea.com
For more information, please contact us at research.sg@etcsea.com.
Disclaimer: The information contained in this document and all accompanying presentations (the “Materials”) are approximates only, is subject to change
without prior notice, and is provided solely for general information purposes only. While all reasonable skill and care has been taken in the production of the
Materials, EDMUND TIE (the “Company”) make no representations or warranties, express or implied, regarding the completeness, accuracy, correctness,
reliability, suitability, or availability of the Materials, and the Company is under no obligation to subsequently correct it. You should not rely on the Materials
as a basis for making any legal, business, or any other decisions. Where you rely on the Materials, you do so at your own risk and shall hold the Company,
its employees, subsidiaries, related corporations, associates, and affiliates harmless to you to and any third parties to the fullest extent permitted by law for any losses,
damages, or harm arising directly or indirectly from your reliance on the Materials, including any liability arising out of or in connection with any fault or negligence. Any
disclosure, use, copying, dissemination, or circulation of the Materials is strictly prohibited, unless you have obtained prior consent from the Company, and have credited
the Company for the Materials. © EDMUND TIE 2020
We are now on
Edmund Tie & Company (SEA) Pte Ltd Scan the QR code
5 Shenton Way, #13-05 UIC Building, Singapore 068808. with WeChat app
to visit our WeChat
T. +65 6293 3228 | F. +65 6298 9328 | mail.sg@etcsea.com | Please visit www.etcsea.com and follow us on account.You can also read