SLOWDOWN OF ECONOMIES AND RISE OF INEQUALITIES - 1st Meeting of the G20 Employment Working Group 20 - 21 February 2019 Tokyo, Japan - OECD.org
←
→
Page content transcription
If your browser does not render page correctly, please read the page content below
1st Meeting of the G20 Employment Working Group
                                                                           20 - 21 February 2019
                                                                                    Tokyo, Japan

            SLOWDOWN OF ECONOMIES
            AND RISE OF INEQUALITIES

Stefano Scarpetta
Director for Employment, Labour and Social Affairs
OECD
CURRENT STANCE OF ECONOMIES

SLOWING DOWN

                              2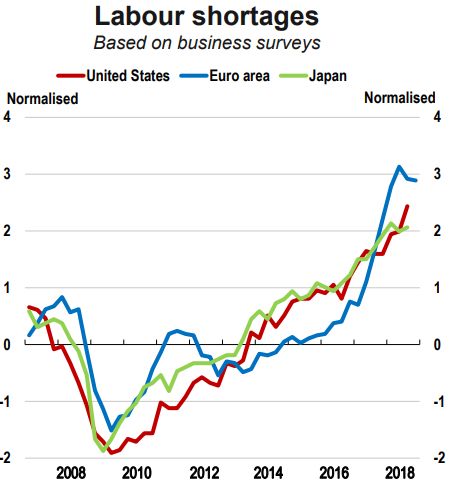
Global GDP growth is losing momentum

Note: G-20 advanced economies are Australia, Canada, France, Germany, Italy, Japan, Korea, the United Kingdom and the United States. G-20 emerging
economies are Argentina, Brazil, China, India, Indonesia, Mexico, Russia, Saudi Arabia, South Africa and Turkey.
Source: OECD Economic Outlook database; and OECD calculations.                                                                                       3
OECD Economic Outlook projections
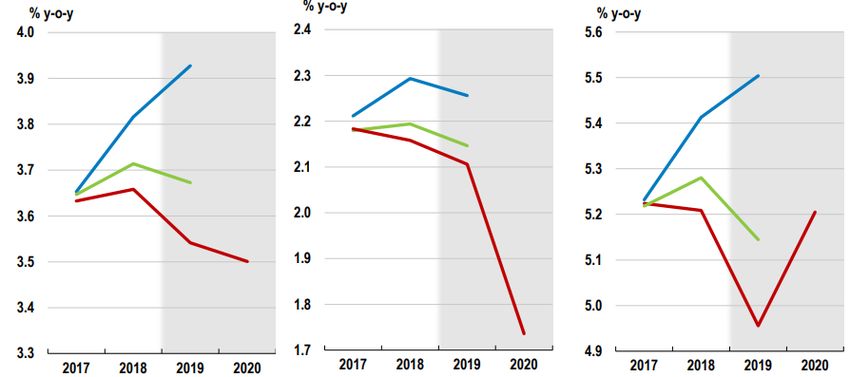
Real GDP growth revised down
Year-on-year, %. Arrows for 2018 and 2019 indicate the direction of revisions since
September 2018.*
2018 2019 2020 2018 2019 2020
World 3.7 3.5 3.5
G-20 3.8 3.7 3.7
Australia 3.1 2.9 2.6 Argentina -2.8 -1.9 2.3
Canada 2.1 2.2 1.9 Brazil 1.2 2.1 2.4
Euro area 1.9 1.8 1.6 China 6.6 6.3 6.0
Germany 1.6 1.6 1.4 India1 7.5 7.3 7.4
France 1.6 1.6 1.5 Indonesia 5.2 5.2 5.1
Italy 1.0 0.9 0.9 Mexico 2.2 2.5 2.8
Japan 0.9 1.0 0.7 Russia 1.6 1.5 1.8
Korea 2.7 2.0 2.9 Saudia Arabia 1.7 2.6 2.5
United Kingdom 1.3 1.4 1.1 South Africa 0.7 1.7 1.8
United States 2.9 2.7 2.1 Turkey 3.3 -0.4 2.7
*The OECD Economic Outlook includes for the first time projections up to 2020.
Note: Dark orange for downward revisions of 0.3 percentage points and more. Light green and light orange for, respectively, upward and downward revisions of less than 0.3
percentage point. Difference in percentage points based on rounded figures. The European Union is a full member of the G-20, but the G-20 aggregate only includes countries that
are also members in their own right. 4
1. Fiscal years starting in April.At the same time, shortages have been rising in
the labour market…
Employment rates
Change between Q4 2007 and Q4 2018 or latest
% pts % pts
10 10
8 8
6 6
4 4
2 2
0 0
-2 -2
-4 -4
Note: Left panel: Data normalised over the 2002-2018 period. Right panel: the employment rate is defined as the number of employed people as a share of
the working-age population (15 to 64 years old). Q4 2018 refers to Q3 2018 for the European Union, France, Germany, Italy, Mexico, OECD, Turkey and
the United Kingdom.
Source: OECD Short-Term Labour Market Statistics database, National Federation of Independent Business; European Commission; Bank of Japan; and 5
OECD calculations…but without boosting wages
Real hourly wage growth
Year-on-year percentage change
Q3 2018 Q4 2007 Q1 2010
%
3.5
3
2.5
2
1.5
1
0.5
0
-0.5
-1
-1.5
-2
Note: Total wages divided by total hours worked of employees and deflated using the private consumption price index.
Source: OECD calculations based on quarterly national accounts.
6In most (advanced) countries, the
occupational structure is “polarising”
Labour market polarisation, selected OECD countries, 1995 to 2015
Percentage point change in share of total employment
High skill Middle skill Low skill
15
10
5
0
-5
-10
-15
France United Italy OECD Germany United Canada Japan India
Kingdom Average States
7PERSPECTIVE TAKING
MORE INEQUALITIES
8In many countries employment is much higher
than 20 years ago but..
Employment-to-population ratios, persons aged 15-64
1997 and 2018 or latest value available
2018 (↗) 1997
%
80
75
70
65
60
55
50
45
40
Note: Selected urban areas for Argentina. No data available in 1997 for Argentina, China, India, Indonesia, Saudi Arabia and South Africa. 2018 refers to
2010 for China; 2011/12 for India; Q1 2018 for Indonesia; and Q3 2018 for Argentina, Brazil, European Union, France, Germany, Italy, Mexico, Saudi 9
Arabia, Turkey and the United Kingdom.Large country differences in levels of income
inequality
Gini Coefficient of income
inequality
0.7
0.62
0.6
0.56
0.49
0.5
0.47
0.46
0.40
0.39
0.4 0.38 0.38
0.35 0.34 0.34 0.33 0.33
0.32
0.30 0.30 0.30 0.29
0.3
0.2
Note The Gini coefficient takes values between 0 (where every person has the same income), and 1 (where all income goes to one person). It is ased on based on equivalised
household disposable income. 10
Source: OECD Income Distribution Database (IDD) www.oecd.org/social/income-distribution-database.htm.Income inequality is growing rapidly
Real income trends at the bottom, middle and top of the income distribution
since the 1980s, OECD-17
Mean Bottom 10% Median Top 10%
Index 1985=1
1.7
1.6
1.5
1.4
1.3
1.2
1.1
1.0
0.9
1985 1990 1995 2000 2005 2010 2015
Note: Income refers to real household disposable income. OECD-17 refers to the unweighted average of the 17 OECD countries for which data are
available: Canada, Denmark, Finland, France, Germany, Greece, Israel, Italy, Japan, Luxembourg, Mexico, the Netherlands, New Zealand, Norway,
Sweden, the United Kingdom and the United States. Some data points have been interpolated or use the value from the closest available year. .
Source: OECD Income Distribution Database, http://oe.cd/idd. 11The middle class is larger in higher-income countries,
but emerging economies are catching up
Share of the population in middle-income households and annual median income, 2016
or most recent year
Middle-income share (%)
80
CZE ISL FRA
SVK DNK NOR
NLD
70 HUN SVN AUT
POL FIN SWE CHE LUX
KOR
GRC LVA PRT ITA CAN
60 DEU BEL
CHN TUR IRL AUS USA
EST ESP GBR
50 MEX ISR
RUS LTU
IND
40 BRA CHL
ZAF
30
0 5000 10000 15000 20000 25000 30000 35000 40000
Median income (USD per year, PPP adjusted)
12In most countries, earnings mobility across
generations is higher when income
inequality is lower
Earnings mobility across
generations today
0.95
0.85
0.75 Australia
Spain
Canada
0.65 Japan
Korea United States
0.55 Italy
United Argentina
Kingdom
France India
0.45 Germany
China
0.35 Brazil
More mobility
0.25 South Africa
0.15
0.15 0.25 0.35 0.45 0.55 0.65
More inequality Inequality 25 years ago (Gini coefficient)
Source: OECD (2018), A Broken Social Elevator?
Note: Earnings mobility = 1 - elasticity of earnings between fathers and sons 13Sliding down the ladder into poverty
also needs to be tackled
Risk for middle-income households of sliding down to the bottom
40
35
30
25
20
15
10
5
0
Germany Italy Korea United States Australia France Turkey Spain United Kingdom Japan
Share of individuals from middle three income quintiles moving down to the lowest income quintile, 4 years, early 2010s or latest, working-age population
These risks have increased for the lower middle class (Q2) but decreased for the more affluent among the middle class.
Source: OECD (2018), A Broken Social Elevator?
14Gender differences in social mobility
Gender differences in social mobility
• Mobility of educational attainment between mothers and
daughters tends to be lower than between fathers and sons, in
particular in southern Europe and emerging economies.
• Occupational mobility is also lower for women than for men,
meaning that parents influence their daughters’ social position
more than their sons’.
• However, intergenerational earnings mobility by gender more
similar, especially when considering incomes rather than
individual earnings.
15No sign of greater income and social
mobility today than three decades ago
• Education: across generations, upward mobility for people with
lower educated parents tended to increase for individuals born
between 1955 and 1975, but then stagnated for those born after
1975 – sticky floors persist.
• Absolute occupational mobility across generations has declined
in half of the countries and not changed much in the other half.
• For mobility over the life course, since the 1990s, there is a
general trend towards more persistence of income positions at
the bottom and at the top of the distribution.
16Public policies can foster greater social mobility
Countries that in the past spent Countries that devoted more
more on public education tend to resources to health tend to have
have higher educational mobility higher health mobility
Intergenerational educational mobility
Health status mobility
0.8 0.95
Canada
0.9
0.7
United States 0.85
France
0.6 Spain France
0.8
Germany
Italy Australia
Spain United Kingdom United Kingdom
0.75
0.5
Korea United States
0.7
0.4 Germany
0.65
0.3 0.6
3 3.5 4 4.5 5 5.5 6 6.5 7 7.5 0 10 20 30 40 50 60 70 80 90 100
Public expenditure on education as a percentage of the GDP in 1995 Health resources 2005
Source: OECD (2018), A Broken Social Elevator?
17Thank you
Contact: Stefano.Scarpetta@oecd.org
Read more about our work Follow us on Twitter: @OECD_Social; @stescarpetta
Website: www.oecd.org/els
Newsletter: www.oecd.org/els/newsletter
18You can also read