SOCIAL AND ECONOMIC DATA IN THE COVID-19 PERIOD - January 2021 Produced by: Performance, Consultation & Insight Unit, Stratford-on-Avon District ...
←
→
Page content transcription
If your browser does not render page correctly, please read the page content below
SOCIAL AND ECONOMIC
 DATA IN THE COVID-19
               PERIOD
                                            January 2021

A monthly digest of relevant data to assist in the Recovery Stage

Produced by: Performance, Consultation & Insight Unit,
      Stratford-on-Avon District Council in March 2021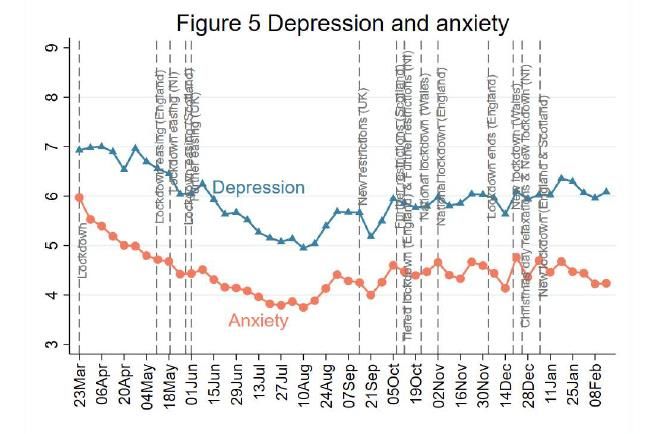
Contents
                                                          Page
1.     Claimant Counts Data                               2
2.     Universal Credit Claimants in Stratford District   8
3.     Housing Benefit/Council Tax Reduction Claims       10
4.     Furlough Data                                      12
5.     Homeless Applications                              13
6.     Covid-19 in Stratford District                     14
7.     Citizens Advice Stratford                          15
8.     National Social Studies                            17
9.     Other Studies                                      23

                                   1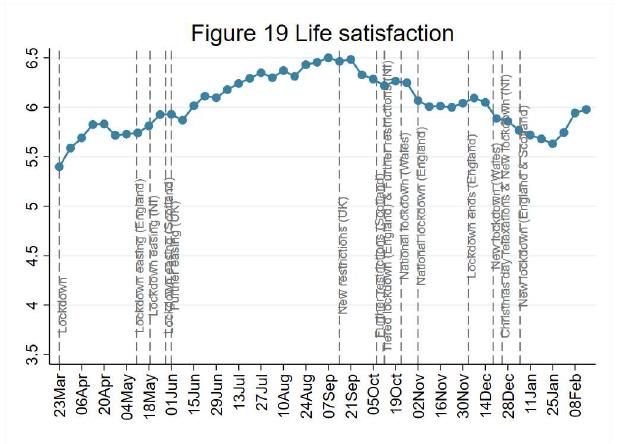
1. Claimant Count Data
Source: NOMIS January 2021 for the following four charts.

It is the number of claimants of universal credit and job seekers allowance of the resident population
of the area aged 16 and over.
The number of male claimants in January fell slightly this month by 60 to 1,540. However, this is still
approximately three times the number of male claimants in March 2020.

                                      Male Claimants SOA
 2,000
                                                            1,790
 1,800
                                                                                                1,540
 1,600
 1,400
 1,200          March-August
 1,000
                    +214%
   800
                        570
   600
   400
   200
     0

The number of female claimants in January fell by 40 to 1,315. Again, this is still almost three times
the number seen in March 2020.

                                     Female Claimants SOA
 1,600
                                                            1,410
 1,400                                                                                         1,315

 1,200

 1,000

   800   March-August
   600       +194%      480
   400

   200

     0

                                                  2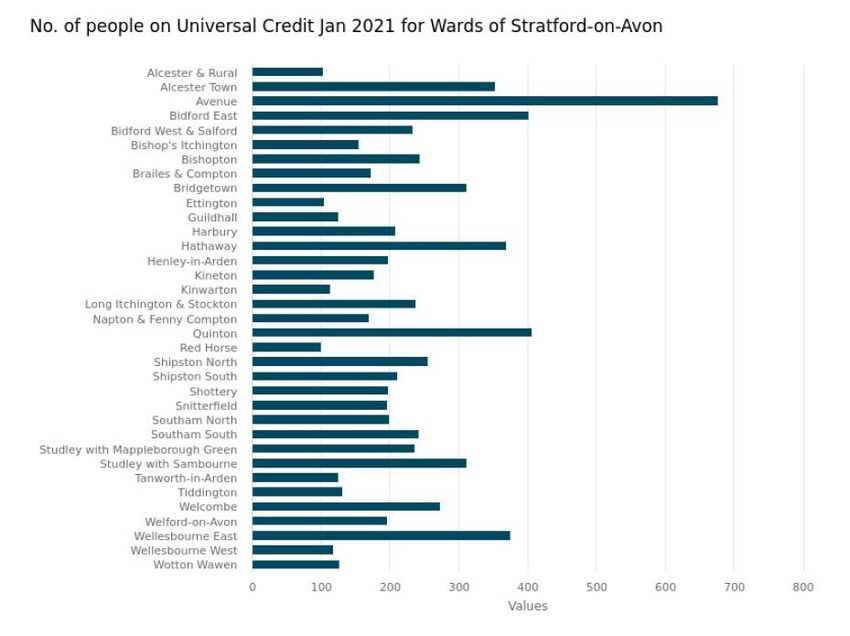
The number of claimants aged 18 to 24 years in January saw another slight drop down 30 from 490 to
460.

                                Claimants aged 18-24 years
 600                                              560

 500                                                                                      460

 400
              March-July
 300
               +250%
 200                  160

 100

   0

Overall, the number claimants in Stratford District in January dropped by 100 to 2,855.

                                       All claimants SOA
 3,500                                                   3,200

 3,000                                                                                    2,855

 2,500

 2,000
           March-August
 1,500
              +205% 1,050
 1,000

   500

       0

                                                  3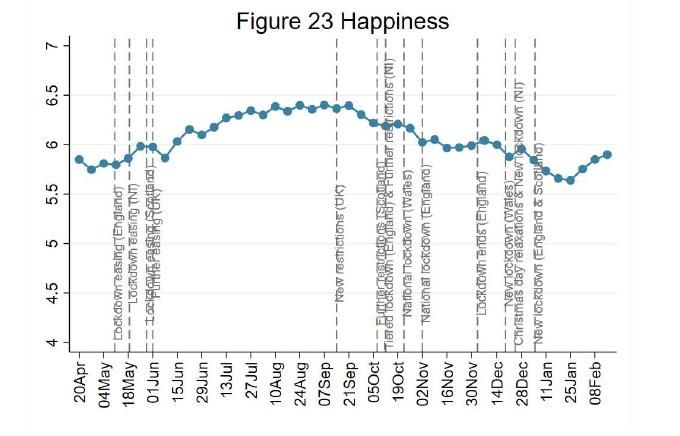
% Claimant count (unadjusted) by West Midlands Local Authorities January 2021 (16 and
over)
The following table compares the claimant count across all West Midlands local authorities in January
2021.

At local authority level, the number of claimants as a proportion of residents aged 16 to 64 years old
varies from 11.1% in Birmingham and 10.3% in Wolverhampton, to 3.6% in Staffordshire Moorlands
and 3.8% in Stratford-on-Avon and Warwick.
 LOCAL AUTHORITY                                                  %
 Birmingham                                                     11.1
 Wolverhampton                                                  10.3
 Sandwell                                                        9.4
 Walsall                                                         8.5
 Stoke-on-Trent                                                  7.8
 Dudley                                                          7.3
 Coventry                                                        6.5
 Nuneaton and Bedworth                                           6.2
 Redditch                                                        5.9
 Tamworth                                                        5.9
 Telford and Wrekin                                              5.9
 Wyre Forest                                                     5.9
 Solihull                                                        5.8
 Worcester                                                       5.4
 Cannock Chase                                                   5.3
 East Staffordshire                                              5.0
 North Warwickshire                                              4.8
 Malvern Hills                                                   4.5
 Bromsgrove                                                      4.5
 Newcastle-under-Lyme                                            4.5
 Rugby                                                           4.5
 Shropshire                                                      4.4
 Lichfield                                                       4.3
 South Staffordshire                                             4.3
 Wychavon                                                        4.3
 Herefordshire                                                   4.0
 Stafford                                                        4.0
 Stratford-on-Avon                                               3.8
 Warwick                                                         3.8
 Staffordshire Moorlands                                         3.6

Source: ONS claimant count [January 2021] via NOMIS

Note: % is number of claimants as a proportion of resident population of area aged 16-64.

                                                  4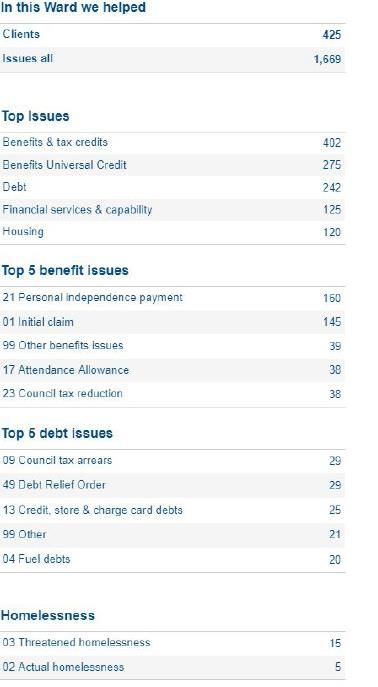
Local Authority Claimant Count Levels (unadjusted) by West Midlands Local Authorities
Comparing March 2020 against January 2021 (16 and over)

The geographical variations at local authority level across the West Midlands is large, where increases
since March range from 61% in Wolverhampton, to a rise of 172% in Stratford-on-Avon district.

Source: ONS via Nomis (January 2021)

                                                  5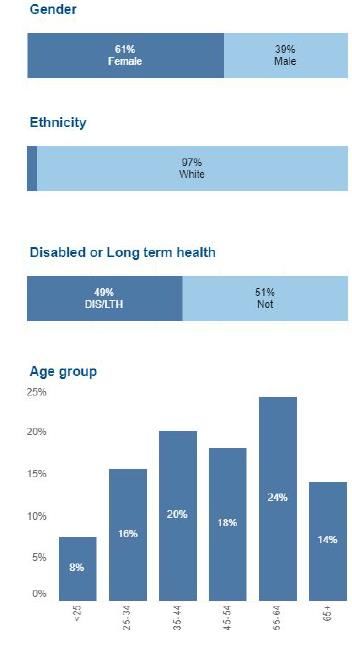
Stratford District Council JSA + partial Universal Credit Claimant Count Levels (unadjusted)
by Ward Comparing Last Two Months (16 and over)

The highest claimant count levels whilst comparing Stratford District Council wards are in Avenue
(8.2%) and Hathaway (6.9%). The lowest levels are in Ettington (1.6%) and Wellesbourne West (1.9%).
Data for Clopton ward is not available.

 Ward Name                                  Claimant     Claimant        Claimant        Claimant
                                             Count           %            Count              %
                                             Dec 20       Dec 20          Jan 21          Jan 21
 Alcester & Rural                              40          2.0%             45             2.2%
 Alcester Town                                 130         5.8%             105            4.7%
 Avenue                                        195         7.8%             205            8.2%
 Bidford East                                  125         5.2%             125            5.2%
 Bidford West & Salford                        95          4.1%             95             4.1%
 Bishop's Itchington                           70          2.7%             70             2.7%
 Bishopton                                     75          3.6%             80             3.9%
 Brailes & Compton                             80          4.4%             80             4.4%
 Bridgetown                                    110         3.7%             110            3.7%
 Ettington                                     40          1.9%             35             1.6%
 Guildhall                                     45          2.3%             40             2.0%
 Harbury                                       90          4.4%             90             4.4%
 Hathaway                                      125         7.2%             120            6.9%
 Henley-in-Arden                               85          4.0%             90             4.2%
 Kineton                                       65          3.4%             65             3.4%
 Kinwarton                                     45          2.9%             40             2.6%
 Long Itchington & Stockton                    105         4.2%             85             3.4%
 Napton & Fenny Compton                        80          3.8%             80             3.8%
 Quinton                                       110         5.4%             110            5.4%
 Red Horse                                     35          1.9%             40             2.1%
 Shipston North                                85          3.9%             85             3.9%
 Shipston South                                65          3.3%             70             3.6%
 Shottery                                      75          3.9%             75             3.9%
 Snitterfield                                  85          4.2%             80             4.0%
 Southam North                                 65          3.0%             65             3.0%
 Southam South                                 85          4.1%             80             3.8%
 Studley with Mappleborough Green              90          4.1%             75             3.4%
 Studley with Sambourne                        120         5.5%             100            4.6%
 Tanworth-in-Arden                             65          3.7%             60             3.4%
 Tiddington                                    70          4.1%             70             4.1%
 Welcombe                                      100         4.6%             100            4.6%
 Welford-on-Avon                               75          3.4%             80             3.7%
 Wellesbourne East                             125         5.7%             110            5.0%
 Wellesbourne West                             45          2.1%             40             1.9%
 Wotton Wawen                                  50          2.8%             50             2.8%
Source: DWP via LG Inform Plus (January 2021)

                                                  6
Youth Claimant Count Levels
Number of Youth Claimants and Change by Selected Months across the WMCA (16-24)
4.4% of those aged 16-24 years are claiming in Stratford-on-Avon District. The rise over the twelve
months from December 2019 to December 2020 was the highest of any council area, with a 233.0%
increase. All but two authorities have seen a drop in the number of youth claimants this month.
Source: ONS/DWP via Nomis, January 2021
Change in
December March December January
Local Authority % claimant no's
2019 2020 2020 2021 Nov-Dec 2020
Birmingham 8,740 9,220 16,110 15,835 9.3% -275
Bromsgrove 210 220 525 515 6.3% -10
Cannock Chase 325 370 770 740 7.9% -30
Coventry 1,445 1,550 3,255 3,160 5.2% -95
Dudley 1,720 1,755 3,090 3,020 9.7% -70
East Staffordshire 275 320 690 675 6.0% -15
Herefordshire, County of 390 415 845 825 5.1% -20
Lichfield 245 275 550 505 5.4% -45
Malvern Hills 180 185 420 410 6.5% -10
Newcastle-under-Lyme 405 430 795 760 4.6% -35
North Warwickshire 165 165 395 380 6.6% -15
Nuneaton and Bedworth 540 570 995 960 7.8% -35
Redditch 310 310 580 565 7.3% -25
Rugby 250 245 525 535 5.5% 10
Sandwell 1,995 2,130 4,050 3,925 11.4% -125
Shropshire 795 830 1,700 1,660 5.9% -40
Solihull 820 830 1,730 1,680 8.3% -50
South Staffordshire 230 250 600 595 5.8% -5
Stafford 280 320 610 615 5.2% 5
Staffordshire Moorlands 180 180 400 395 4.6% -5
Stoke-on-Trent 1,275 1,415 2,435 2,395 8.5% -40
Stratford-on-Avon 150 160 500 470 4.4% -30
Tamworth 275 305 640 625 8.4% -15
Telford and Wrekin 740 780 1,560 1,485 7.8% -75
Walsall 1,790 1,940 3,195 3,140 10.5% -55
Warwick 235 230 660 650 3.4% -10
Wolverhampton 1,840 1,925 3,265 3,200 11.8% -65
Worcester 315 325 755 700 5.5% -55
Wyre Forest 310 315 690 650 7.6% -40
72. Universal Credit Claimants in Stratford District
Source: Dept for Work and Pensions
8,062 people were claiming Universal Credit in Stratford-on-Avon in January 2021. For the latest
month available with a breakdown (December 2020), 4,453 of these claimants were not in
employment, whilst 3,516 were in employment. The total number of claims has changed by 124%
compared to January 2020.
10.7% of people are on universal credit compared with the working age population in Stratford district.
Percentage of Working Age Population Compared with Universal Credit Claimants for
Selected Authorites – December 2020
Local Authority Number of people on Working Age The % of People on
Universal Credit Population (16-64) Universal Credit
compared with
Working Age
Population
Stratford 8,062 75,200 10.7
North Warwickshire 4,997 39,600 12.6
Nuneaton 12,785 79,200 16.1
Rugby 9,133 66,200 13.8
Warwick 8,188 91,900 8.9
Coventry 36,154 249,000 14.5
Total number of people on Universal Credit - Number of people claiming Universal Credit. This total includes both
claimants who are not in employment and those eligible who are in employment.
8The chart below shows the total number of people claiming Universal Credit across the wards of
Stratford District. Clopton is the only ward not listed due to the population level not being high
enough. Stratford Avenue ward has by far the most number of people claiming Universal Credit. Data
is available to LSOA level if required.
Source: Stat-Explore: People on Universal Credit
93. Housing Benefit/Council Tax Reduction Claims
Source: Stratford-on-Avon District Council
Housing benefit only claims rose slightly again in January from 145 to 146. The figures exclude cases
where the claim fails to qualify for benefit.
The joint Housing Benefit and Local Council Tax Reduction claims for pension-age residents have
remained fairly static over the year. Those from working-age residents fell back again in January to
1,139.
Council Tax Reduction only claims have again remained fairly static for those of pension-age, but have
risen consistently over the year for working-age residents, from 1,724 in January 2020 to 2,588 in
January 2021.
Housing Benefit Claims only 2020-21
600
500
400
300
200 146
100
0
Jan Feb March April May June July Aug Sept Oct Nov Dec Jan
2020 2021
Housing Benefit and Council tax reduction claims 2020-21
2,500
2,000
1,500
1,139
1,000
500
0
Jan Feb Mar Apr May Jun Jul Aug Sept Oct Nov Dec Jan
2020 2021
pension-age working-age
10Council Tax Reduction claims only 2020-21
3,000
2,588
2,500
2,000
1,500
1,000
500
0
Jan Feb Mar Apr May Jun Jul Aug Sept Oct Nov Dec Jan
2020 2021
pension-age working-age
114. Furlough Data
Coronavirus Job Retention Scheme (CJRS) Statistics: February 2021
Claims received up to 15 February 2021
Date published: 25 February 2021
Source: HM Revenue & Customs
Figures for furloughing supported by the Job Retention Scheme as at 31 December 2020 and
provisional figures for 31 January 2021.
Based on claims made by the 15 February. The January figures are provisional and may be revised due
to late and amended claims. A high percentage figure is more of a concern.
For Stratford District
Female Male Total
employments employments employments
eligible for eligible for eligible for
furlough furlough furlough
30,400 29,700 60,100
As at 31 December 2020 (Actual)
Female Female take Male Male take Total Total take
employments up-rate employments up-rate employments up-rate
furloughed furloughed furloughed
4,500 15% 4,000 13% 8,500 14%
Compared with all UK authorities (including unitaries, London boroughs etc.) the 14% total
take up rate is the 58th highest percentage. Compared with all English districts it is the 26th
highest percentage.
The female furloughed take up rate is 35th highest compared with all UK authorities and 16th
highest compared with all English districts.
The male furloughed take up rate is 85st highest compared with the UK and 30th when
compared with all districts.
As at 31 January 2021 (Provisional)
Female Female take Male Male take Total Total take
employments up-rate employments up-rate employments up-rate
furloughed furloughed furloughed
5,700 19% 4,600 16% 10,300 17%
Compared with all UK authorities (including unitaries, London boroughs etc.) the 17% total
take up rate is the 40th highest. Compared with all English districts it is the 17th highest
percentage.
The female furloughed take up rate is 23rd highest compared with all UK authorities and 13th
highest compared with all English districts.
The male furloughed take up rate is 53rd highest compared with the UK and 18th when
compared with all districts.
125. Homeless Applications
Homeless Applications Since July 2018
Source: Stratford-on-Avon District Council
January saw a rise in the number of applications from 41 to 65. A rise in January has typically been
seen over the last few years, as shown in the chart below.
The mean average number of applications per month for the financial year 2020-21 stands at 63 so
far, which is lower than that for 2019-20 (67), but higher than 2018-19 (56).
Homeless applications taken per month 2018-2021
90
80 71
67 65
70
60
50
40
30
20
10
0
July
July
July
March
May
March
May
April
April
January
January
January
November
December
June
November
December
June
August
February
February
November
December
August
September
August
September
September
October
October
October
Q2 Q3 Q4 Q1 Q2 Q3 Q4 Q1 Q2 Q3 Q4
2019 2020 2021
136. Covid-19 in Stratford District
Source: Coventry City Council
https://coventry-city-council.github.io/covid-19/dashboard/
The number of Covid-19 cases for the month has risen again from 974 in December to 1,356 in January
2021. The rate per 100,000 at the end of the month has dropped, however, to 150 down from 312 at
the end of December 2020.
Covid-19 Cases and Rate per 100,000 by Month for Stratford District
Month Lab-confirmed cases for the Rate per 100,000 population
month as at end of the month
March 2020 73 33.82
April 311 66.87
May 116 9.99
June 18 4.61
July 14 3.07
August 26 6.92
September 125 35.36
October 646 157.57
November 674 58.42
December 974 312
January 2021 1,356 149.89
Covid-19 Cases and Rate per 100,000 by Month for Warwickshire Districts
District/Borough Council Lab-confirmed Cases for Rate per 100,000 population
January 2021 as at end of the month
North Warwickshire 1,072 274.27
Warwick 1,569 160
Nuneaton & Bedworth 2,197 278.71
Stratford-on-Avon 1,356 149.89
Rugby 1,791 249.69
Total cases in Stratford District March 10th to January 31st 2021 = 4,333
Number of people with at least one lab-confirmed positive COVID-19 test result, by specimen date.
Individuals tested positive more than once are only counted once, on the date of their first positive
test.
Total number of deaths in Stratford District since pandemic started up until January 31st 2021 = 293
Total number of deaths since the start of the pandemic of people who had had a positive test result
for COVID-19 and died within 28 days of the first positive test. The actual cause of death may not be
COVID-19 in all cases. People who died from COVID-19 but had not tested positive are not included
and people who died from COVID-19 more than 28 days after their first positive test are not included.
147. Citizens Advice Stratford
Extract From Citizens Advice Stratford District Monthly Report January 2021
Source: Citizens Advice South Warwickshire
The charts show some information about how we assisted our clients in Stratford District in January
2021 and the analysis compares 2021 with January 2020.
1516
8. Social Studies
Covid-19 Social Study – Results Release 31
This report provides data from the last 48 weeks of the UK COVID-19 Social Study run by University
College London: a panel study of over 70,000 respondents focusing on the psychological and social
experiences of adults living in the UK during the Covid-19 pandemic (21/03/20 to 21/02/21).
The full report can be found via this link https://www.covidsocialstudy.org/results and clicking Week
48-49. This report focuses on psychological responses to the first 48 weeks since just before the UK
Lockdown was first announced.
Findings
Over half (57%) of adults are concerned that cases of Covid-19 will increase after the current
lockdown restrictions are eased. This is down from 78% in May 2020 when these questions
were asked at an almost identical time point as in the current lockdown. A similar proportion
of adults across age groups are also concerned that people will not adhere to social distancing
guidelines once restrictions start to lift (53%). NB these data were collected before the 22
February 2021 announcement on the timing of lockdown restriction easing in England.
People are as worried about hospitals being overwhelmed (43%) after the current lockdown
restrictions are eased as they were in May 2020 (44%). Young adults are more worried about
this happening than adults aged 30 and over.
Around 1 in 3 people are expressing concerns about an economic recession and increasing
unemployment levels once the current lockdown restrictions are lifted. Adults of working age
are more affected by economic concerns than those aged 60 and up. One-quarter of young
adults are currently concerned about pollution increasing once restrictions are lifted.
The activities people are missing the most during the latest lockdown are the same as they
were in May 2020. Nearly 2 in 3 reported missing meeting up with friends and family, and
these proportions were similar across age groups. Over half of adults are reporting missing
going out for meals, coffee or drinks, and on holiday, but just 13% miss going to the office.
Young adults are missing usual activities the most. 1 in 3 young adults miss going to the gym,
spending time in nature, and having time alone. Over half (58%) miss going to cultural venues,
compared to 49% of adults aged 30- 59 and 42% of older adults. However, in general adults
are reporting missing usual activities less than they did in first lockdown in 2020.
Confidence in the central government to handle the Covid-19 pandemic has increased since
the start of the year in England. Whilst levels remain lower in England than devolved nations,
they are now back to levels recorded in mid-May 2020.
Compliance continues to be at its highest levels since May of 2020. Majority compliance is
being reported by around 96% of people, while complete compliance (no bending of the rules)
by 3 in 5 people. Compliance has maintained a steady rate since the start of the New Year.
Stress about catching or becoming seriously ill from Covid-19 is similar to what it was in the
autumn but has been decreasing since late December. Worries about accessing sufficient food
have slightly decreased in the past several weeks but are still affecting approximately 1 in 10
people.
Although mental health is worse than during the summer, there are some signs of
improvement. Happiness and life satisfaction levels have increased over the last several weeks
17but remain at levels similar to those of the late spring of 2020 when lockdown restrictions had
eased. There is also some indication that the previously recorded increases in depression and
anxiety are stabilising, with possible improvements.
Loneliness levels are still roughly the same as they were during first lockdown, although they
appear to have been slightly decreasing over the past several weeks. Loneliness remains
highest in people living alone, those with a mental health condition, people with lower
household income, and people from ethnic minority backgrounds
Mental Health
Respondents were asked about depression levels during the past week using the Patient Health
Questionnaire (PHQ-9) and anxiety using the Generalised Anxiety Disorder assessment (GAD-7);
standard instruments for diagnosing depression and anxiety in primary care. These are 9 and 7 items
respectively with 4-point responses ranging from “not at all” to “nearly every day”, with higher overall
scores indicating more symptoms. Scores of higher than 10 can indicate major depression or moderate
anxiety.
There is some indication that the rises recorded in anxiety and depression levels since the end of the
summer may be stabilising and anxiety levels may be beginning to decline. Although this study focuses
on trajectories rather than prevalence, the levels overall are higher than usual reported averages using
the same scales (2.7-3.2 for anxiety and 2.7-3.7 for depression).
Depression and anxiety are still highest in young adults, women, people with lower household income,
people with a long-term physical health condition, people from ethnic minority backgrounds, and
people living with children. People with a diagnosed mental illness have still been reporting higher
levels of depression and anxiety symptoms (as might be expected), especially since the latest
lockdown was announced.
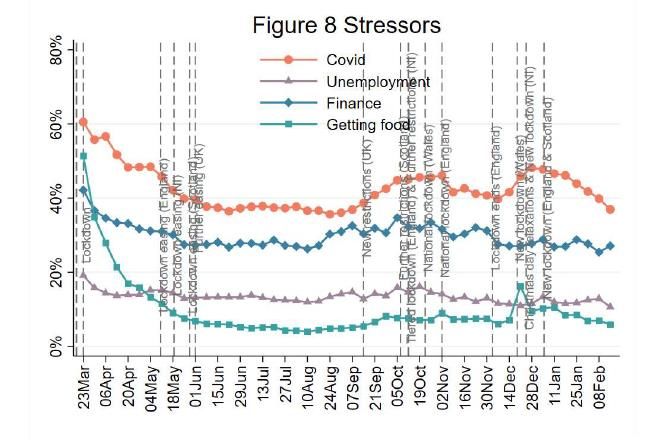
18Stress
We asked participants to report which factors were causing them stress in the last week, either minor
stress or major stress (which was defined as stress that was constantly on their mind or kept them
awake at night).
Although stress about catching Covid-19 or becoming seriously ill from it is similar to what it was in
the autumn, it has decreased substantially since the start of the year with just under 40% of people
reporting being worried. This decrease has followed the increase that was seen after the news of the
new more contagious variant at the end of last year. When separated by age group, however, these
decreases were only seen in adults aged 30-59 years and 60 years and older, who are more likely to
have already received the Covid-19 vaccine or are nearer to doing so.
Worries about finance have remained relatively stable since the latest lockdown started, comparable
to their lowest levels of around 1 in 4 people over the summer. Worries about unemployment remain
relatively low, concerning just 1 in 8 people. Worries about accessing food have slightly decreased in
the past several weeks, affecting approximately 1 in 10 people; comparable to when lockdown easing
began in May 2020.
People with diagnosed mental illness have been more worried about all factors. But stressors in other
demographic groups have varied. Specifically in relation to worries about Covid-19, these levels are
highest in adults over the age of 30, women, and people with diagnosed physical health conditions,
but have been decreasing across these groups in the last weeks.
Concerns about unemployment and finances remain highest amongst adults of working age and are
comparable to their levels in the summer. Unemployment and financial stress are still higher in those
living with children. Most groups are showing similar concern about accessing food, although these
concerns are higher in people with a diagnosed mental health condition and those in ethnic minority
groups. People with physical health conditions are also more concerned about accessing food, which
may be due to greater concerns about going to supermarkets.
19Life Satisfaction
Respondents were asked to rate their life satisfaction during the past week using the ONS wellbeing
scale, which asks respondents about how satisfied they are with their life, using a scale from 0 (not at
all) to 10 (completely).
There has been an increase in life satisfaction in the last month seen across all age groups. Life
satisfaction remains lower than during the summer, but levels are now similar to June 2020 when
lockdown restrictions were being lifted.
However, younger adults and women continue to have lower levels of life satisfaction, as are people
living alone, those with a mental health condition, those with lower household incomes, people with
a long-term physical health condition, and people from ethnic minority backgrounds (although smaller
sample sizes compared to people with white ethnicity mean there has been greater volatility in these
data).
Although this study focuses on trajectories rather than prevalence, the levels of life satisfaction are
lower than usual reported averages using the same scale (7.7).
20Happiness
Respondents were asked to rate to what extent they felt happy during the past week using the Office
for National Statistics wellbeing scale on a scale from 0 (not at all) to 10 (completely). Happiness
ratings are only available from 21st April onwards.
Happiness levels have increased somewhat in recent weeks in all age groups, showing similar levels to
during first lockdown in 2020. However, they remain lower than they were in the summer. Happiness
levels over the past several weeks are similar to levels early in the pandemic in the UK. There continue
to be differences in reported levels of happiness across demographic groups.
Levels of happiness remain lower in adults under the age of 60, people living alone, people with lower
household incomes, people with a diagnosed mental or physical health condition, in urban areas, in
females, and people from ethnic minority backgrounds.
21Coronavirus and the social impacts on Great Britain: 26 February 2021
This contains data and indicators from the Office for National Statistics' (ONS's) Opinions and Lifestyle
Survey (OPN) to understand the impact of the coronavirus (COVID-19) pandemic on British society.
The statistics below are based on a survey of 6,017 adults aged 16 years and over in Great Britain
conducted between 17 and 21 February 2021 (inclusive). Results this week are based on 4,113
responding adults (68% response rate).
Source: ONS
Coronavirus and the social impacts on Great Britain - Office for National Statistics (ons.gov.uk)
Main Points
Compliance with most measures to stop the spread of the coronavirus (COVID-19) remained high, with
the proportions reporting always or often handwashing after returning home (89%) and using a face
covering (96%) both unchanged from last week; however, 86% of adults reported always or often
maintaining social distance when meeting up with people outside their support bubble, which was
lower than last week (91%).
This week, the proportion of adults reporting staying at home or only leaving for work, exercise,
essential shopping or medical needs in the past seven days fell to 54% (56% last week) but remains
higher than the mid-November peak (43%) when governments introduced tighter restrictions across
Great Britain.
A similar proportion of adults reported exclusively working from home in the last seven days (35%) to
those who reported to have exclusively travelled to work in the last seven days (36%); this is in
comparison with 16 to 20 September 2020 when the proportion of adults reported travelling to work
was considerably higher (53%) than those working from home (21% over the same period).
Personal well-being measures including life satisfaction (6.4), the feeling that things done in life are
worthwhile (7.0) and anxiety (4.1) were at similar levels to last week; however the level of happiness
(6.6) has increased slowly from the low level seen at the end of January (6.4).
This week, over 3 in 10 (35%) adults in Great Britain reported they had received at least one dose of
COVID-19 vaccine, compared with 26% last week; this increased with age with the majority (97%) of
adults aged 70 years and over reporting they had received at least one dose of the vaccine.
Positive sentiment towards the COVID-19 vaccine increased this week with 94% of adults reporting
they had now either received the vaccine or would be likely to have the vaccine if offered; an increase
from the 91% reported last week.
229. Other Studies – Business Impact of Coronavirus
Office for National Statistics – Business Impact of Coronavirus Survey: 25 February 2021
Source: ONS
Business insights and impacts on the UK - Office for National Statistics (ons.gov.uk)
The business indicators are based on responses from the voluntary, fortnightly BICS, which captures
businesses' views on the impact on turnover, workforce, prices, trade and business resilience. The
Wave 24 survey was live for the period 8 to 21 February 2021, and businesses were asked about their
experience for the two-week survey reference period, 25 January 2021 to 7 February 2021.
Wave 24 of BICS saw a sample of 39,278, with 10,351 businesses responding.
Main Points
The percentage of businesses currently trading has remained low in mid-February 2021 at 72%, which
has been stable since early January 2021 when lockdown restrictions were imposed.
Of businesses not permanently ceased trading, approximately 6.5 million employees (20% of their
workforce) were on furlough leave in early February 2021, increasing from 6 million (18%) in the
previous month.
Both the arts, entertainment and recreation industry and the accommodation and food service
activities industry had more than half of their workforce on furlough leave in early February 2021.
Approximately half of all businesses that have temporarily closed or paused trading reported cash
reserves will last three months or less in mid-February 2021.
Half of the businesses not permanently ceased trading in the accommodation and food service
activities industry and other service activities industry had cash reserves to last three months or less,
and are the industries with consistently lower cash reserves.
The main challenge reported by internationally trading businesses for both exporting and importing
was additional paperwork, at 38% and 39% respectively.
23You can also read