Solar energy Energy Centre summer school in Energy Economics 18-21 February 2019 - Kiti Suomalainen
←
→
Page content transcription
If your browser does not render page correctly, please read the page content below
Solar energy
Energy Centre summer school in Energy Economics
              18-21 February 2019
                                       Kiti Suomalainen
                          k.suomalainen@auckland.ac.nz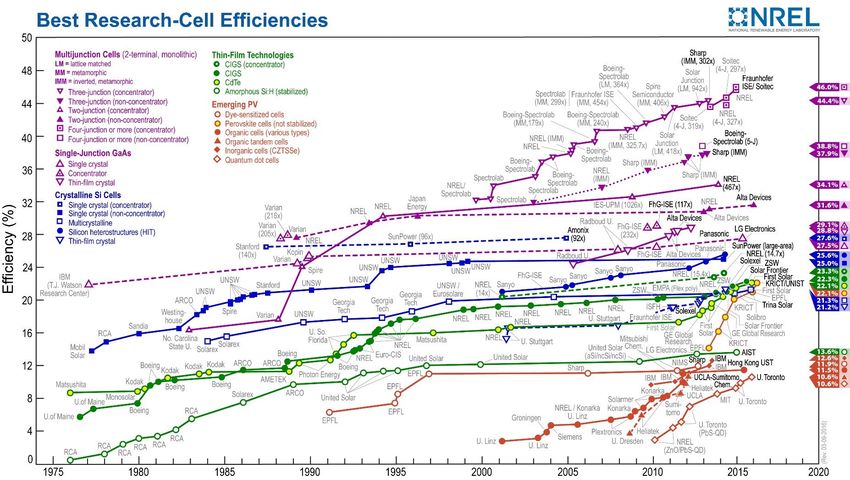
Outline

  The resource

  The technologies, status & costs

  Solar energy in the world

  Solar energy in New Zealand

  Research at the Energy Centre
The resource
                                                                                                WORLD ENERGY USE:
                                                                                                18.5 TWy/y

                                                                                                RENEWABLES [TWy/y]:
                                                                                                Solar           23,000
                                                                                                Wind            75-130
                                                                                                Waves           0.2-2
                                                                                                OTEC            3-11
                                                                                                Biomass         2-6
                                                                                                Hydro           3-4
                                                                                                Geothermal 0.2-3++
                                                                                                Tidal           0.3

                                                                                                FINITE [TWy]:
                                                                                                Nat. Gas        220
                                                                                                Petroleum       335
                                                                                                Uranium         185++
                                                                                                Coal            830

                                                                                                •   Sun > 1000 x world energy
                                                                                                    demand
                                                                                                •   6 hr of sun ~ 1 yr of world
                                                                                                    energy demand
                                                                                                •   All petroleum < 4 days of sun
                                                                                                •   All coal ~ 2 weeks of sun

Source: https://www.iea-shc.org/data/sites/1/publications/2015-11-A-Fundamental-Look-at-Supply-Side-Energy-Reserves-for-the-Planet.pdf
The resource
Capturing solar energy
  • Heat – through absorption
      • Pools & sanitary water
      • Drying (water evaporation) e.g. crops, other foods
      • Passive space heating
      • Mechanical work -> electricity (solar thermal electricity /
        concentrating solar power)

  • Photoreaction
      • Photosynthesis
      • Photovoltaic (PV) effect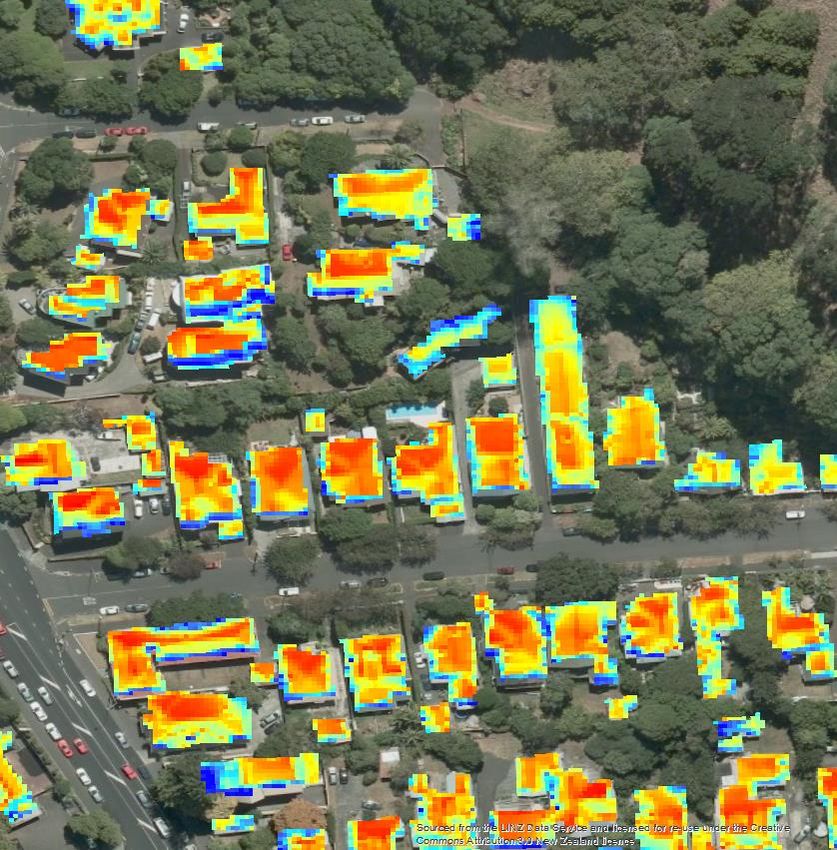
Solar photovoltaics (PV)

                  • Absorption of incident photons to
                    creates electron-hole pairs.
                  • Electron-hole pairs will be generated in
                    the solar cell (provided that the
                    incident photon has an energy greater
                    than that of the band gap).
                  • The pair is separated due to the
                    electric field existing at the p-n
                    junction -> electrons flow one way,
                    holes the other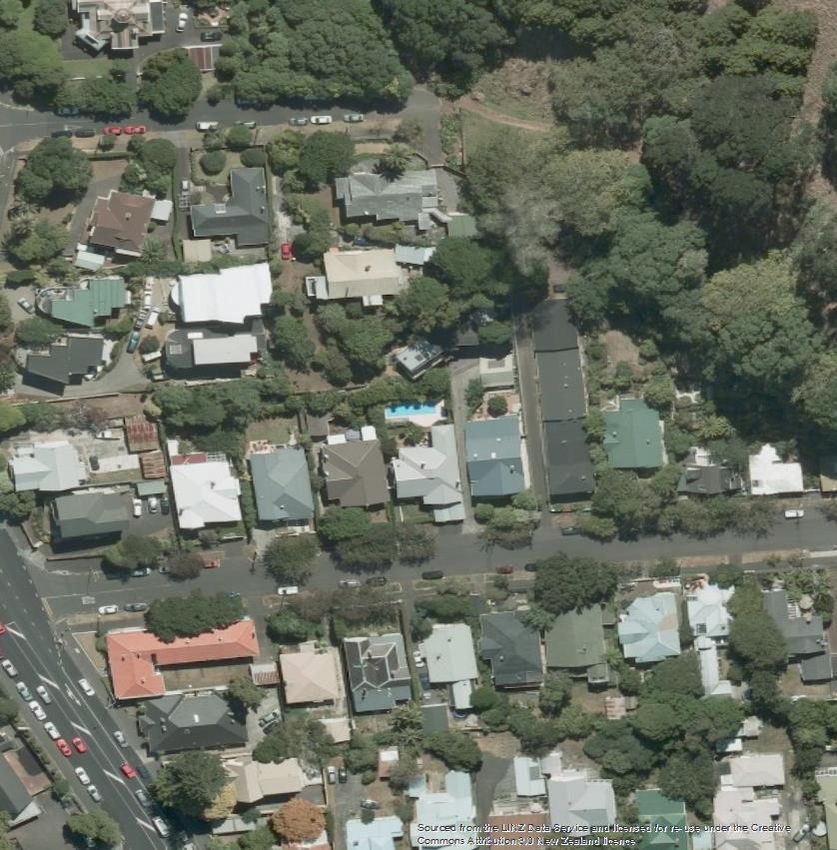
PV technologies
                      Most widely used and developed in the world:
      Crystalline
                      95% of global production in 2017
      Silicon PV
      (c-Si)          Efficiency: 16-18%.

                      5% of global production in 2017
      Thin films      Costs less in energy and material than c-Si
      (a-Si, CdTe,    (above)
      CIGS)           Efficiency: 12-16%

      Concentrating   Still under development!
      solar PV /
                      Aim: high efficiency using materials that are
      advanced thin   non-toxic and abundant
      films
                      Efficiency: 20-60%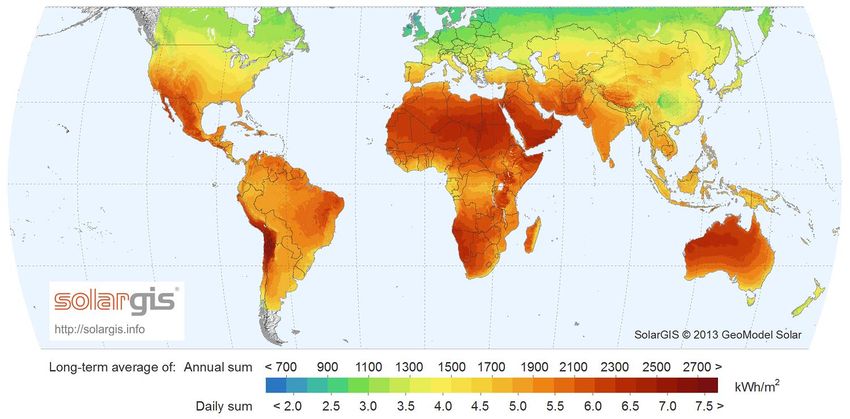
The solar spectrum

Concentrating solar power
(solar thermal electricity)
• Generating solar power by using mirrors or lenses to concentrate a large
  area of sunlight, or solar thermal energy, onto a small area.
• Electricity is generated when the concentrated light is converted to heat,
  which drives a heat engine (usually a steam turbine) connected to an
  electrical power generator.
Concentrated solar power
with storage

                      https://www.solarpaces.org/how-
                      csp-thermal-energy-storage-works/
Large solar power plants (45 MW)
Large solar
power plants

      “the largest single-
      site project will
      generate 700
      megawatts (MW) of
      power when
      completed”
Large solar power plants
Solar PV in the world

                        Source: REN21, 2018
European solar PV module Average yearly module
PV Costs: prices by technology and
manufacturer
prices by market in 2015
and 2016
Modules
• Reduction in
processing costs
• Fall in polysilicon costs
• Improvement in PV
efficiencies
Source: IRENA, 2018.PV costs: Detailed breakdown of utility-scale solar PV costs
by country, 2016
breakdown
Source: IRENA, 2018.Concentrated solar power in the world
Source: REN21, 2018CSP cost trends
Source: IRENA, 2018.Solar energy in New Zealand
Installed solar capacity
  in NZ: 89 MW                                       Residential
                                                                   49.4 MW

                                                                   25.4 MW
    Installed solar capacity in
    New Zealand per island

                                        Dec 2018                   5.7 MW
                                        58.2 MW
                                                     SMEs          3.9 MW

                                        31.0 MW

                                                                   5.3 MW

                                                     Commercial    3.1 MW

Source: Electricity Authority,
                                  --- North Island
Electricity Market Information,                                    3.5 MW
                                  --- South Island
website visited Feb 2019.                            Industrial    2.6 MW
Solar research at the Energy Centre Solar potential of Auckland rooftops using LiDAR data Solar energy and Pacific island grids
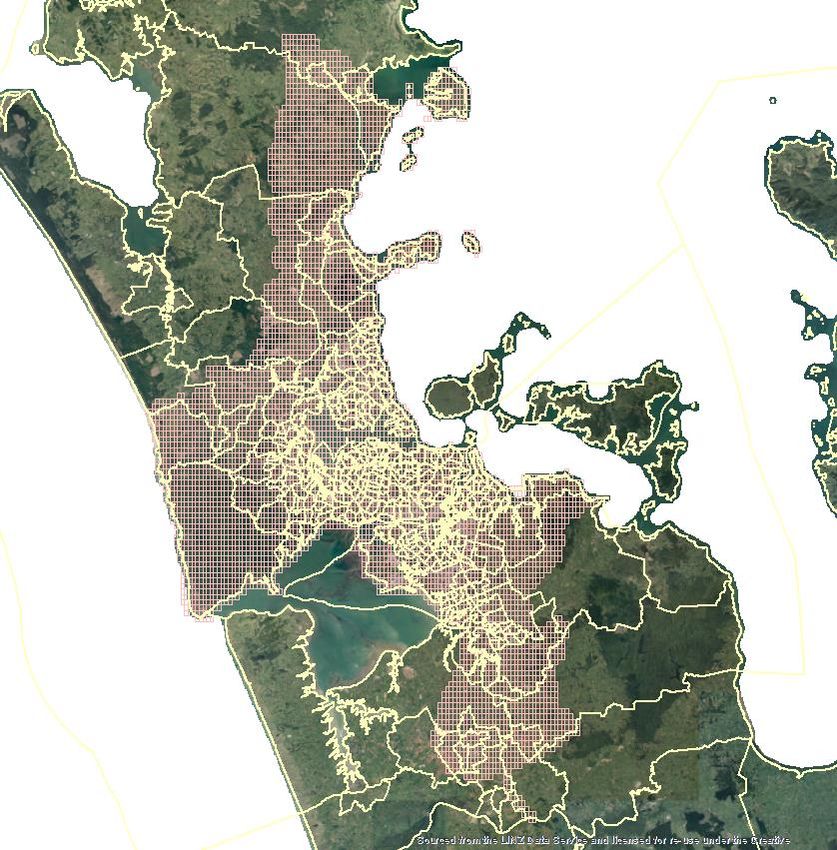
Solar potential in Auckland
rooftops using LiDAR data
LiDAR (light detection and ranging) is an optical
remote-sensing technique that uses laser light to
densely sample the surface of the earth, producing
highly accurate x,y,z measurements.
Laser pulses emitted from a LiDAR system reflect
from objects both on and above the ground surface:
vegetation, buildings, bridges, and so on.
One emitted laser pulse can return to the LiDAR
sensor as one or many returns (reflect from multiple
surfaces).
The first returned laser pulse is the most significant
return and will be associated with the highest
feature in the landscape like a treetop or the top of
a building. The first return can also represent the
ground, in which case only one return will be
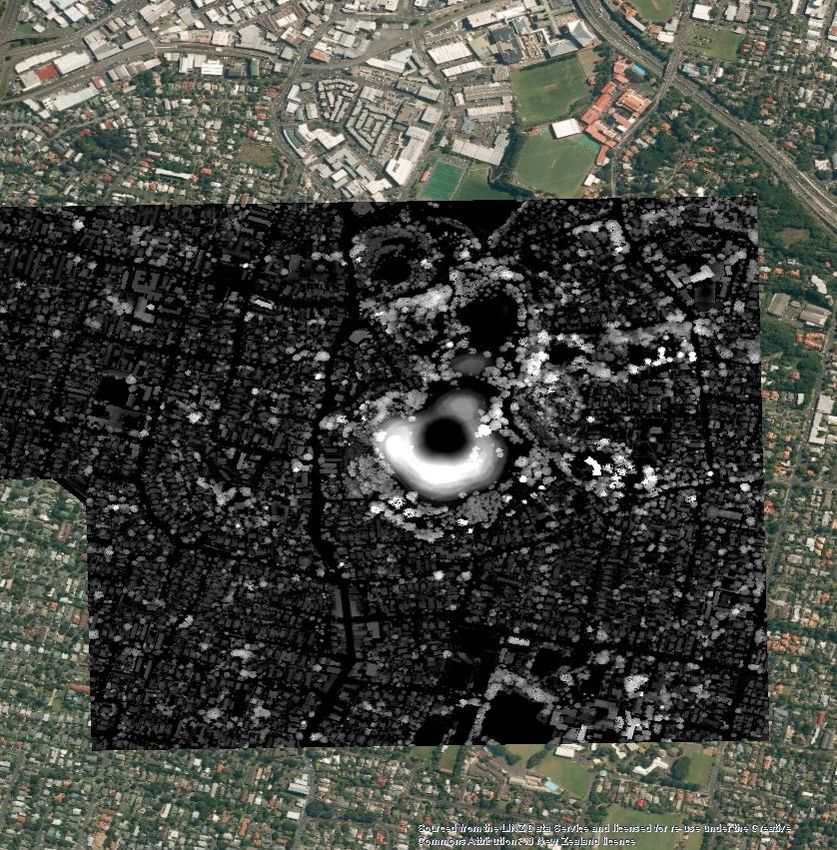
detected by the LiDAR system.LiDAR data example
LiDAR data
Collected by NZ Aerial Mapping and
Aerial Surveys Limited for Auckland
Council in 2013/2014.

Flight info:
Altitude 900m, 1600m, 1000m
Scan frequency 36Hz, 45Hz, 42.9Hz

Average point spacing:
minimum 1.5 points per m2

Vertical accuracy: +/-0.1m
LiDAR -> Digital surface model
• Elevation data
• Resolution: 1 m2
• Used to calculate roof
• Slope
• Orientation
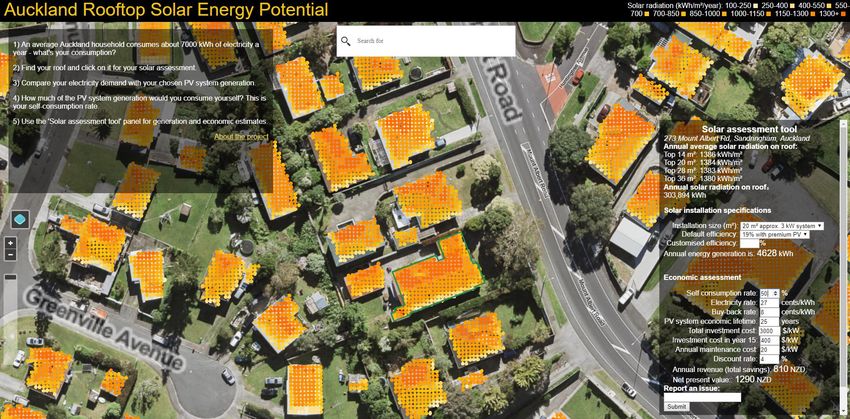
Solar radiationSolar potential
Solar webtool: solarpower.cer.auckland.ac.nz
Latest developments:
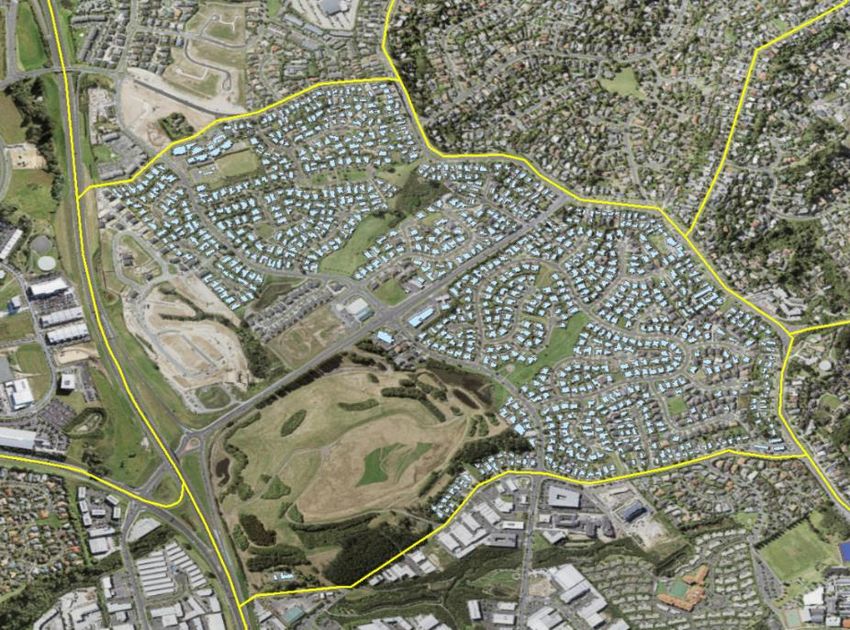
Investigating PV deployment strategies
Pinehill, Auckland
• New approach:
• Measured solar radiation data as input
• Results saved at hourly level
12 representative days for a year
• Tested on 1 suburb: Pinehill
• Roughly 1000 housesSmall PV systems on all roofs vs. larger systems on “best” 50% of all roofs? Results: PV output
Small PV systems on all roofs vs.
larger systems on “best” 50% of all roofs?

Results: Economic assessment
Solar and grids:
  Challenges in island energy systems

Many island states have high renewable energy         Where should the new tech go?
targets, 100%: e.g. Cook Islands, Samoa, Tuvalu,
Vanuatu.

Projects focused on isolated solar/wind/battery
systems – omitting (economic) impacts on grid.

Grids are costly to build and maintain.
Solar + battery project costs vary significantly by
location.

We need to understand how to transition to a
resilient, low-carbon energy system at lowest
system cost.
                                                                             Source: www.epa.gov
Future
research
Solar in island grids
• Develop economic assessment model for exploring optimal deployment path for
solar/distributed generation with option of phasing out the grid.
• Test for one island, produce a model that can be applied to other islands.
• Introduce stochasticity for uncertainty in fuel/carbon price, technology costs, climate change
impacts.
Solar in urban environments
• Investigate optimal deployment strategies under different cost scenarios
• Include demand patternsThank you!
You can also read