SANJAY VERMA DIRECTOR - DECARBONIZATION SOLUTIONS 3RD MARCH 2021
←
→
Page content transcription
If your browser does not render page correctly, please read the page content below
SANJAY VERMA
       DIRECTOR – DECARBONIZATION SOLUTIONS
       3RD MARCH 2021

1   © Wärtsilä   I N T E R NA L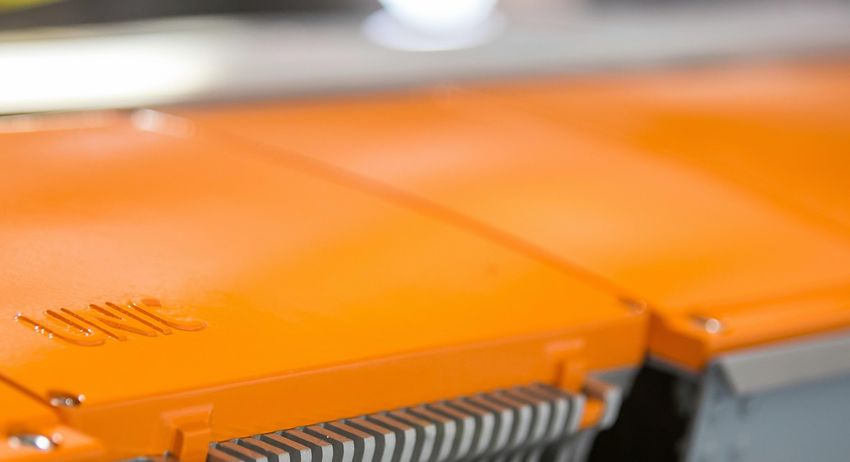
CONTENTS

    •      Wartsila In Brief
    •      Drivers for Decarbonisation
    •      The Path to Decarbonisation
    •      Fuel Options for the Marine Industry
    •      Wartsila and Future Fuels
    •      Case Study - Hybrid Tug
    •      Key takeaways

2   © Wärtsilä   I N T E R NA L   3.3.2021   INTERNAL ONLY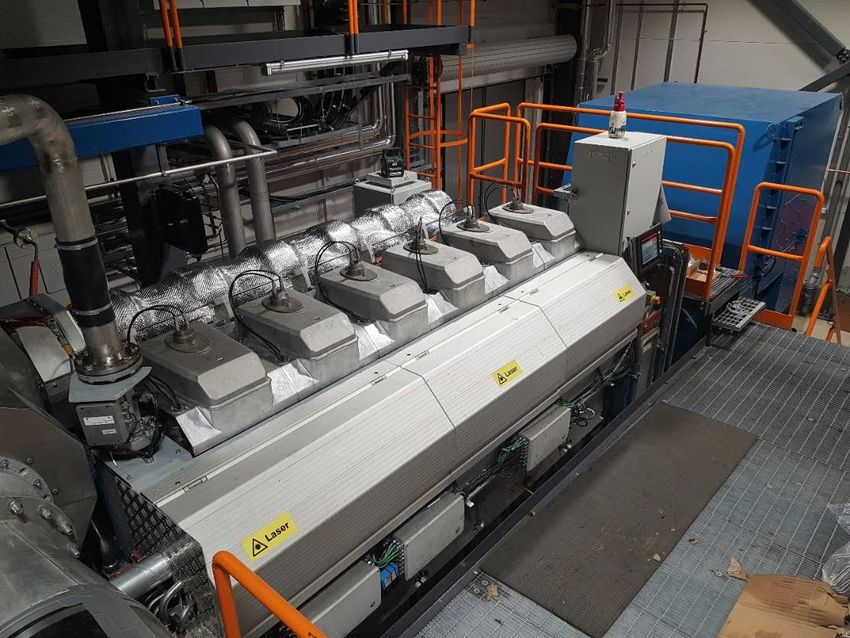
FUEL FLEXIBILITY                     OPTIMISING                        TOWARDS ZERO        NEW TECHNOLOGY TO
        AND FUTURE FUELS                     ENERGY SYSTEMS                    EMISSION MARITIME   ENABLE A SMART
                                                                                                   MARINE ECOSYSTEM

3   © Wärtsilä   I N T E R NA L   3.3.2021         LNG Marine Fuel Institute
DRIVERS FOR
        DECARBONISATION

4   © Wärtsilä   I N T E R NA L   3.3.2021   LNG Marine Fuel Institute
Emissions from engines can be divided in two categories

  Category 1: Local emissions:                              Category 2: GHG emissions:
  health & environment related                              climate related
  • Contribute to deterioration of human health,            • Contribute to global warming / climate change
    loss of wellbeing                                       • Mainly CO2, CH4 (methane) and N2O (laughing
  • Mainly NOx, SOx and particulates                          gas)
  • Also impact the natural environment                     • Low to no impact on human health or
    (flora & fauna) on short term                             the natural environment on short term
  • Impact depends very much on location of                 • Impact is not dependent on location of
    emission. Focus on densely populated areas                emission, as climate change is a global
    and sensitive ecosystems                                  problem

               Sometimes conflicting interests exist between the two. Optimize for one or the other?

  © Wärtsilä    I N T E R NA L                                     Document ID     Revision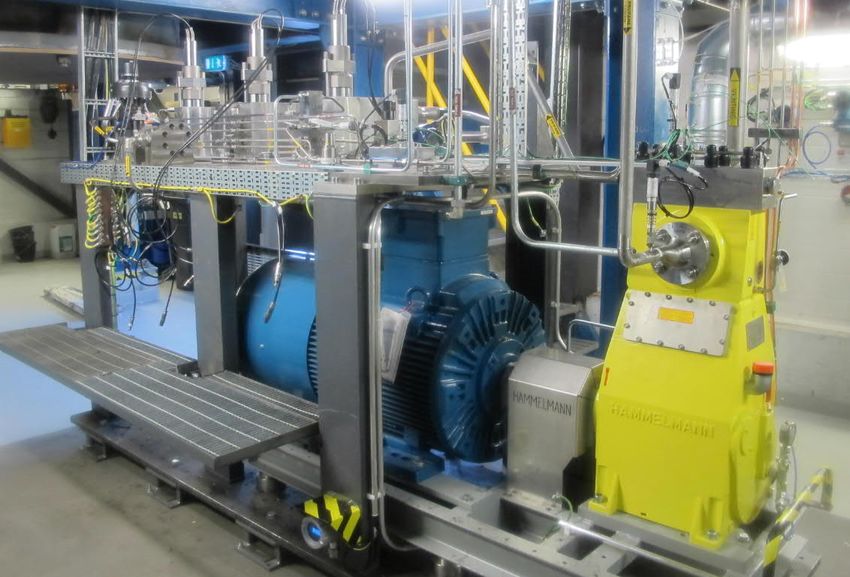
IMO TARGETS
                          Vessel emissions   -40%                -70%

                                 1                         0,6                        0,3

                          Fleet emissions                               -50%

                        2008                        2030                       2050

© Wärtsilä   INTERNAL
THE PATH TO
        DECARBONISATION

7   © Wärtsilä   I N T E R NA L   3.3.2021   LNG Marine Fuel Institute
THE PATH TO DECARBONISATION

                                                                                                                                    The fuel perspective
                                          Switch to gas possible?                                                 Synthetic
                                                                          LNG                 Biogas
                                                                                                                  methane
                           Efficient               yes
                           Energy
                          Generation
 The vessel perspective

                                                                         HFO                  Liquid                Synthetic
                                                                         MGO                  biofuel              liquid fuel
                            Power
                          Distribution

                                                                      Compatible with todays ships, bunkering infra, safety
                                                                     experience and regulations. Key to fast market takeup.
                                                                    Methanol is the dark horse in this discussion. Easy to store,
                            Vessel
                            Energy
                                                                         bunker and burn, it may leapfrog other fuels.
                             Need

                          Optimized
                           Voyage

      © Wärtsilä          I N TE R N AL
FUEL OPTIONS FOR THE MARINE
        INDUSTRY

9   © Wärtsilä   I N T E R NA L   3.3.2021   LNG Marine Fuel Institute
FUEL ROADMAP – FOCUS ON RENEWABLE FUELS
                 2020                       2030                    2050         Pros                                    Cons
                                                                       •   Cleanest fossil fuel, -5 to -20%     •      Methane slip, must be
  Fossil LNG                                                               GHG depending on engine type                reduced with on/off engine
          Bio LNG                                                          (well-to-wake/power) LNG                    techs as novel combustion
                                  Synthetic LNG                            infrastructure, rules and                   (NextDF), Oxicat or
                                                                           regulations exist, fuel is available        Sandbed
                                                                       •   Bio/syn GHG -70 to -100%
  Fossil liquid                                                            depending on source (well to
           Bio liquid                                                      wake/power)
                    Synthetic liquid                                   •   Clear transition pathway as same
                                                                           infra can be used for all
                                                                                                                   •   NOx emissions
                                                                       •   No CO2 emissions
                                                                                                                   •   Challenges in handling,
                           *)               green Hydrogen             •   Can be blended with LNG
                                                                                                                       spec if liquid (minus
                                                                                                                       253°C)
                                                                       •   No CO2 emissions                        •   NOx emissions
                           *)               green Ammonia              •   Can be blended with liquids or          •   Toxic, not available, no
                                                                           gases                                       rules & regulations
                                                                       •   Carbon neutral                          •   NOx emissions
                           *)               green Methanol             •   Can be blended with liquids             •   Toxic
                           *) timing depends on the market demand
INTERNAL
3 June 2020
        10    © Wärtsilä   I N T E R NA L                                           Document ID         Revision
FUEL OPTIONS FOR INDUSTRY 11 © Wärtsilä I N T E R NA L 25 September 2019 Wärtsilä Marine Business / Sebastiaan Bleuanus
GENERAL PROPERTIES

12   © Wärtsilä   I N T E R NA L   25 September 2019   Wärtsilä Marine Business / Sebastiaan Bleuanus
ENDURANCE – ON A GIVEN SET UP

13   © Wärtsilä   I N T E R NA L   25 September 2019   Wärtsilä Marine Business / Sebastiaan Bleuanus
Development of Engine Technology is ongoing

     Time schedule for engine performance

                  Verified: 2003                     Verified: 2015       Indicative: 2020, Verified*: 2022   Indicative: 2020, Verified*: 2025

                    CH4                          MeOH                                  NH3                                   H2
             Bio- or Synthetic                        Methanol                        Ammonia                             Hydrogen
                 methane
                                      A methanol conversion package                 We have already               Our gas engines are already
          Contains about 99%          is available for the ZA40 engine            technologies that are           able to blend LNG with up to
       methane and can readily be      and we have the technology to           capable of using Ammonia.              25% hydrogen, and
        used in liquid form with               burn methanol.                                                       combustion concepts are
       equipment made for LNG.                                                  The needed combustion             specified for 100% hydrogen.
                                      The next step is to industrialise       concepts to maximise engine
                                      this technology on the relevant           performance and related              Our future efforts will be
                                       portfolio engines according to            safety technologies are          directed towards maximising
                                                market needs.                  currently being investigated           engine performance.

                                                                                                                               * timing depends on the market demand

14   © Wärtsilä      I N T E R NA L    3 June 2020
                                                             INTERNAL
Hydrogen mixed in natural gas
• Target to study the effect of
hydrogen mixed in NG in lean-
burn DF and SG engines
• Specific caution on safety
• Hydrogen sniffers for gas pipes
• Protective hood above the
engine
• Improved gas ventilation
• Up to 30% of hydrogen in NG
could be used as fuel in Wärtsilä
gas engine after optimized
controls
© Wärtsilä I N T E R NA LLPG, Methanol and Ammonia testing facility in Vasa, Finland
W6L32
Test engine
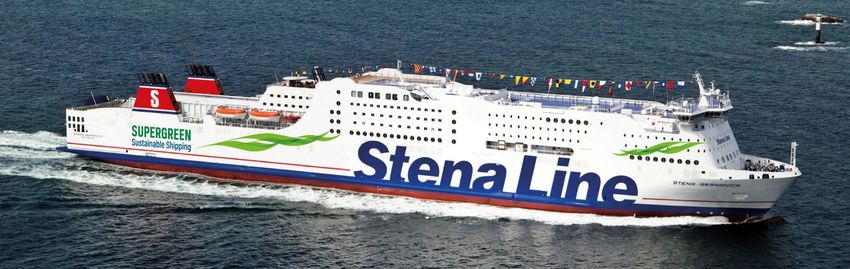
16 © Wärtsilä I N T E R NA L 3.3.2021 Document ID RevisionSTENA GERMANICA – CONVERSION SCOPE
© Wärtsilä I N T E R NA L 3/3/2021 Toni Stojcevski / Wärtsilä Document ID RevisionGRIEG STAR & WARTSILA 18 © Wärtsilä I N T E R NA L 25 September 2019 Wärtsilä Marine Business / Sebastiaan Bleuanus Document ID Revision
ZEEDS & WARTSILA

                                    Zero Emission Energy Distribution at Sea (ZEEDS)
19   © Wärtsilä   I N T E R NA L   25 September 2019   Wärtsilä Marine Business / Sebastiaan Bleuanus   Document ID   Revision
THE DECARBONIZATION FORMULA FOR SHIPPING
SHIP
Alternative (green) fuels Electrification
As the combustion engine is Hybrid, Pure Electric, Fuel
an efficient power source Cell
Efficiency
Best is to use less Energy in the
first place
ECO SYSTEM
Logistic Port
Fleet Efficiency Ship Routing Just In Time Port Efficiency
Efficiency Electrification
© Wärtsilä I N T E R NA L Electrical & Integrated Solutions as enabler for decarbonizationWHY ELECTRIFICATION? THE GRID IS ALREADY 50% GREEN IN MANY
COUNTRIES TODAY AND GETTING GREENER IN OTHERS
• National grids have more
and more green energy
sources
• Whenever a vessel is
ashore using and „fueling“
by this grid saves loads of
CO2
• Most ports will have a
shore connection
opportunity in the future
• This needs consideration
for any newbuild
© Wärtsilä I N T E R NA L Electrical & Integrated Solutions as enabler for decarbonizationCASE STUDY
60T Hybrid TUG
22 © Wärtsilä I N T E R NA L 3 March 2021Comparison of Propulsion Configuration
DM DM FPP DM CPP DE FPP Installed Power
Comparison Conventional Hybrid Hybrid Hybrid
Main Engines Battery Power
Total Installed Mechanical Power: kWm 4,015 3,299 3,396 2,640 4 500
Available Battery Power kW - 1,000 1,000 1,600 4 015
4 000
Battery Capacity kWh - 339 339 565
Main Engine running hours: Hours/year 5,200 3,120 3,094 2,034 3 500 3 396
3 299
Aux. Engines running hours Hours/year 4,068 52 52 -
3 000
Fuel Type MGO MGO MGO MGO 2 640
2 500
2 000
Engines Running Hours 1 600
1 500
6 000
5 200 1 000 1 000
1 000
5 000
4 068 500
4 000 -
3 120 -
3 094
Main Engines DM DM FPP DM CPP DE FPP
3 000
Conventional Hybrid Hybrid Hybrid
2 034 Auxilliary Engines
2 000
1 000
52 52 -
-
DM Conventional DM FPP Hybrid DM CPP Hybrid DE FPP Hybrid
23 © Wärtsilä I N T E R NA L 3 March 2021Comparison of Propulsion Configuration (Cont.)
DM DM FPP DM CPP DE FPP
Comparison Conventional Hybrid Hybrid Hybrid
Fuel Type MGO MGO MGO MGO
Fuel Consumption
Fuel consumption in GJ: GJ/year 32,440 22,250 22,120 20,347
800 745
Fuel consumption in Ton: Ton/year 745 505 502 460
700
Comparison relative to Alt. 1 % 100.0 % 67.8 % 67.4 % 61.7 %
600
El. Power consumption from shore MWh/year 175 200 200 200
505 502
Max Bollard Pull continous (Main Engines only) T BP 63 54 54 40 500 460
Max Time in Peak Bollard Pull Min No limit 22 20 16 400
Max Time in Transit Eco 10kn on Battery Min - 19 19 33
300
Max Time in Transit Eco 8kn on Battery Min - 48 50 83
200
100
DM DM FPP DM CPP DE FPP
Fuel Cost 523
Conventional Hybrid Hybrid Hybrid
-
DM DM FPP DM CPP DE FPP
Conventional Hybrid Hybrid Hybrid
Fuel consumption in Ton: Ton/year 745 505 502 460
Fuel Cost in USD: USD 389,607 264,130 262,715 240,381
Reduced Fuel consumption: Ton - 240 243 285
Reduced Fuel cost: USD - 125,477 126,891 149,226
24 © Wärtsilä I N T E R NA L 3 March 2021Comparison of Emissions
DM DM FPP DM CPP DE FPP
Emissions Conventional Hybrid Hybrid Hybrid
Summary of Yearly consumption of MGO Ton/year 745 505 502 460
Emissions, CO2 Ton/year 2,481 1,656 1,648 1,485
Comparison CO2 - relative to Alt. 1.0 % 100.0% 66.8% 66.4% 59.8%
Emissions, NOx - Tier II (without SCR) Ton/year 58.1 31.5 31.3 22.1
Fuel Consumtion and Emissions Comparison NOx - relative to Alt. 1.0 % 100.0% 54.2% 53.9% 38.0%
Emissions, Sox (without Scrubber) Ton/year 1.5 1.0 1.0 0.9
100,0%
Comparison SOx - relative to Alt. 1.0 % 100.0% 67.8% 67.4% 61.7%
90,0%
Emissions, Particles Ton/year 0.489 0.248 0.247 0.151
80,0% Comparison particles - relative to Alt. 1.0 % 100.0% 50.8% 50.6% 30.8%
70,0%
60,0% DM Conventional Benefits:
50,0% DM FPP Hybrid
• Lower Installed Power 35%
DM CPP Hybrid
40,0%
DE FPP Hybrid • Lower Energy Consumption 40%
30,0%
• Lower Operating Cost 40%
20,0%
• Lower Emission 45%
10,0%
• Improved Performance
0,0%
Fuel CO2 Nox Sox Particles
25 © Wärtsilä I N T E R NA L 3 March 2021FOLGEFONN PROJECT Wireless Charging: 26 © Wärtsilä I N T E R NA L ZERO seminar 2016
JUST-IN-TIME ARRIVAL

         VOYAGE
         OPTIMISATION
         • Simulation of potential
           in the port of Singapore

     1 600 000 T                         540 000 T                             160 000 000 €       SAFETY
     CO2 emissions cut                   fuel reduction                        fuel bill savings   thanks to reduced
                                                                                                   congestion

27   © Wärtsilä   I N T E R NA L   3.3.2021      Smart Marine Ecosystem 2020
KEY
TAKEAWAYS
1. There is no one single future fuel – there will be a whole variety of fuels in use
2. Investing in fuel flexibility and the combustion engine will mitigate compliance and
business risks introduced by future fuels
3. The Wärtsilä DF engine is an excellent choice for introducing future fuels
4. For Port decarbonization electrification will play important role, cold ironing, charging
infrastructure needs to be developed
5. Electric cranes, trucks, lifts, mooring boats, pilot boats, ferries, hybrid tugs etc
6. Use of data on port to promote Just In Time arrival and transparency in port services
7. Policies on chartering and evaluation of tenders needs to be aligned with the
decarbonization agenda
8. Early adopters needs to be rewarded and non compliance to be penalised
9. Government policies need to be aligned with the new tomorrow
28 © Wärtsilä I N T E R NA L 3.3.2021 INTERNAL ONLYYou can also read