Sonoma County Community Climate Action Plan
←
→
Page content transcription
If your browser does not render page correctly, please read the page content below
Sonoma County
Community Climate Action Plan

                                  Blueprint for the Future

                                            October 2008
                                        by the
                             Climate Protection Campaign
                           www.climateprotectioncampaign.org

                                 Support from the following made this Plan possible:
Cities of Cloverdale, Cotati, Healdsburg, Petaluma, Rohnert Park, Santa Rosa, Sebastopol, Sonoma, and Windsor;
     the County of Sonoma; the Sonoma County Water Agency; the Sonoma County Transportation Authority;
 the Sonoma County Agriculture Preservation and Open Space District; Catalyst for a Sustainable Future and the
James McGreen and Nancy Cadigan Fund (both donor-advised funds of Community Foundation Sonoma County);
 Donald andMaureen Green; the Codding Foundation; Ken Martin; James Keegan, Clem Carinelli; Dennis Hunter;
             Brenda and Keith Christopherson; Jean Schulz; and many other private donors. Thank you!
Introduction to the
         Sonoma County Community Climate Action Plan
                From the Steering Committee
Dear Reader:

This Plan is a call for change.

People hear this call differently. Some feel they can postpone action, while others are
firmly convinced we must act today — if not yesterday.

To all readers of this Plan we offer a view of change that helps us begin the task ahead,
be it the person who feels immobilized by the scale of the effort, or the one who is ready
to storm the Capitol demanding draconian remediation.

The process of change is often unpredictable. Sometimes it moves incredibly swiftly.
Other times it seems to stall completely, only to surprise us with its reappearance like
new leaves on a plant we thought was dead.

History is filled with mighty examples of positive change. But what causes it? Where
was the first crack in the Berlin wall? What put an end to apartheid in South Africa?
When was the first step taken toward the moon? Did the Civil Rights Act of 1964
become inevitable when Rosa Parks refused to give up her seat on the bus?

Every historic change is preceded by a massive collection of individual actions.
Because we cannot foresee how change will occur, each action is critical. The main
thing is to act.

This Plan offers a set of solutions to meet the challenge in Sonoma County to protect
our climate. Readers may not agree with all the solutions presented in the following
pages. That is okay. Plans adjust and evolve as they are put into action.

But it is not okay to continue life as usual. Non-action will create severe implications for
our future.

Thank you in advance for reading this Plan. We hope you find it inspiring, challenging,
and, ultimately, a compelling roadmap of the needed change ahead. For change is what
it is about.

Steering Committee of the Sonoma County Community Climate Action Plan:
   Jane Bender, Santa Rosa City Councilmember
   Jim Leddy, President of the Board, Santa Rosa City Schools
   Tanya Narath, Executive Director, Leadership Institute for Ecology and the Economy
   Chris Thomas, Deputy County Administrator, County of Sonoma (ex-officio)
EXECUTIVE SUMMARY                               resources, and technology to initiate
                                                change that will not only reduce our
Sonoma County’s commitment to the               GHG emissions, but also will also result
future and its pressing desire for ex-          in a more robust and secure economy
traordinary action brought this Com-            powered by local, reliable energy; a
munity Climate Action Plan (Plan) into          healthier environment with cleaner air
being.                                          and water; healthier people; and preser-
                                                vation of the natural world.
“Climate change is not just another
issue in this complicated world of pro-          •   Global warming is a manmade
liferating issues. Climate change is THE             crisis that is happening now.
issue which, unchecked, will swamp all           •   It is an unintended consequence
other issues,” declared Pulitzer winning             of using fossil fuels and of
journalist Ross Gelbspan.                            deforestation.
                                                 •   The need to act is urgent.
This Plan presents a package of solu-            •   It is not too late.
tions that, when implemented as a large          •   People are waking up and taking
scale public works project, will meet                action.
Sonoma County’s bold goal for reducing
                                                 •   You are part of the solution.
greenhouse gas (GHG) emissions —
25 percent below 1990 levels by 2015.
All nine Sonoma cities and the County
established this goal in 2005. Mean-            Analytic Process Is the
while, Sonoma County’s emissions                Foundation of the Plan
continue to rise.
                                                Informed by best available models —
Achieving Sonoma County’s climate               We searched nationwide for the most
goal requires a monumental and                  powerful community climate action plans
extremely challenging intervention in           and solutions to help with the Plan.
business as usual. We must move
together at tremendous speed and                Tapped expertise — Over fifteen tech-
scale. Individual actions and volunteer-        nical experts prepared over 500 pages
ism, while essential, are insufficient.         of Source Material that form the founda-
                                                tion of the Plan. They considered a
Transforming our energy infrastructure          comprehensive range of solutions and
from fossil fuels to renewables entails a       included those that best met the Plan’s
unity of purpose, ingenuity, and com-           criteria.
mitment similar to this country’s mobili-
zation during World War II and the New          Engaged the community — The Plan
Deal era. Just as the Agricultural Revo-        incorporates input from 50 representa-
lution and the Industrial Revolution            tives from government, business, youth,
remade the world, so will the Energy            and the community at large, as well as a
Revolution.                                     Steering Committee and many ad hoc
                                                advisors from business and other
Although our challenge is great, this           sectors.
crisis also presents us with huge op-
portunities. We have the knowledge,

                                            i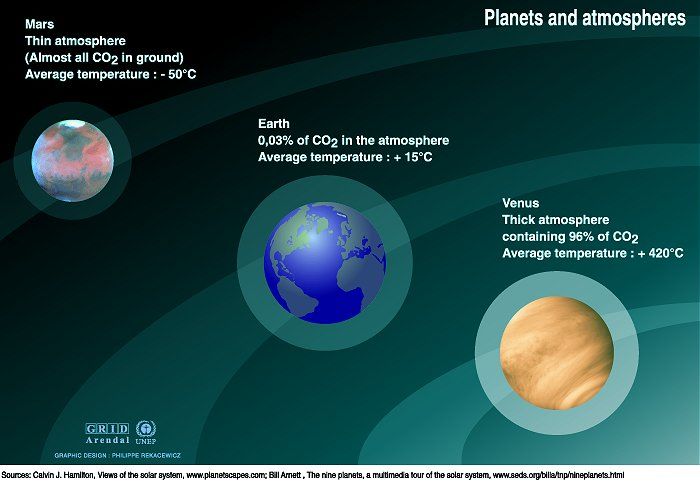
Organized by sector — Solutions are               Financing solutions essential — In most
presented in four sectors:                        cases, the chief barrier to implementing
                                                  climate protection solutions is funding.
•   Electricity and Natural Gas                   The Plan tackles the question: How can
    (including water, wastewater,                 we invest in renewable energy and stop
    efficiency, and new construction)             spending on fossil fuels? Access to low
•   Transportation and Land Use                   cost financing is a key.
•   Agriculture and Forests
•   Solid Waste                                   We must do it all — We compared pro-
                                                  jected GHG emission reduction impacts
Assessed solutions rationally — Solu-             of implementing the Plan’s major quan-
tions were analyzed using four criteria:          tified solutions with Sonoma County’s
                                                  emission reduction target. By 2015 So-
•   Significant, rapid GHG emission               noma County must reduce its emissions
    reductions                                    by 1.4 million tons from the business as
•   Cost effective                                usual (BAU) total of 4.2 million tons to
•   Under local control                           reach 2.7 million tons by 2015, which
                                                  equals the target of 25 percent below
•   Politically feasible
                                                  the 1990 emission level.
Prepared for implementation — Where
possible, the Plan estimates the amount                                      Reduces
                                                      Category
of GHG reductions and the required                                           BAU by
financial investment associated with                  Energy Efficiency         4%
each solution, and recommends the                     Renewable Energy
                                                                                 15%
entities to implement the solutions.                  Production
                                                      Transportation             17%
Summary of Findings
Role of government — As with all public           Projections of contributions of the major
works projects from roads and railways            solutions toward the total reduction (1.4
to the Internet, the transformation of our        million tons) are based on the following
infrastructure depends on the govern-             assumptions:
ment to implement innovative fiscal pol-
icy, concerted investment, and                    •   Energy Efficiency: 80 percent of
appropriate regulation. Government has                Sonoma County homes and com-
the unique power to plan, coordinate,                 mercial spaces retrofitted with all
and allocate resources on a system-                   economically feasible efficiency
wide scale. Government can also estab-                improvements.
lish price signals that drive the neces-          •   Renewable Energy Production: Build
sary behavior using the principle                     a low carbon electricity portfolio with
“Reward the good/Polluter pays,” and                  67 percent new local renewables in-
thereby unleash market creation and                   cluding natural gas replacement and
reform that will support business-gener-              efficiency retrofit.
ated solutions.

                                             ii
•   Transportation: Trip reduction, aver-                                                  This Plan now leaves the technical
    age trip length reduction, and shifting                                                realm and enters the public arena where
    from single occupant vehicles to                                                       the political feasibility of the proposed
    public transit, walking, and bicycling;                                                solutions will be tested. To move from
    large scale car share fleet of electric                                                plan to action will require widespread
    and plug-in hybrid vehicles.                                                           community engagement, ingenuity, and
                                                                                           leadership. Elected representatives and
Implementation of all major quantified                                                     local government staff must move
solutions will reach about 22 percent                                                      boldly. Stakeholders and other commu-
below 1990 levels, which is about 37                                                       nity members must give government the
percent below business as usual.                                                           support it needs to do so. Businesses
(Emissions have continued to increase                                                      must innovate and invest in the neces-
since 1990. Therefore the quantity of                                                      sary programs.
reductions needed to achieve the target
has increased.) This suggests that all
the solutions outlined in this Plan must
be implemented. The sooner we start
the more successful we’ll be.

                             Emission Reduction Wedges for Sonoma County 2005-2015

                          4,500k                                                                            BAU Level:
                                                                                                          4,167,539 tons

                          4,000k                                                                          Efficiency Only

                          3,500k                                                                           Efficiency +
                                                                                                          Transportation

                          3,000k
                                                                                                            Efficiency +
              Tons eCO2

                                                          Target Level,                                    Renewables +
                          2,500k                                                                          Transportation
                                                         2,721,660 tons
                          2,000k

                          1,500k

                          1,000k

                           500k

                             0k
                                   2005

                                          2006

                                                 2007

                                                        2008

                                                               2009

                                                                      2011

                                                                             2012

                                                                                    2013

                                                                                            2014

                                                                                                   2015

                                                               Year

Although the Plan addresses both the agriculture/forest and solid waste sectors, they are not
portrayed in the chart above because the amount of GHG emissions for these sectors is
comparatively minor, and data for the solutions for these sectors need more development to be
meaningful.

                                                                              iii
GLOSSARY OF ACRONYMS

ABAG           Association of Bay Area Governments
BAAQMD         Bay Area Air Quality Management District
BAU            Business As Usual
CACPS          Clean Air Climate Protection Software
CARB or ARB    California Air Resources Board
CCA            Community Choice Aggregation
CCAP           Community Climate Action Plan
CCP™           Cities for Climate Protection
CEC            California Energy Commission
CO2            Carbon Dioxide
CPUC or PUC    California Public Utility Commission
CTP            Comprehensive Transportation Plan
eCO2           Equivalent Carbon Dioxide — usually expressed in tons
EIR            Environmental Impact Report
EPA or USEPA   United States Environmental Protection Agency
ESP            Electric Service Provider
GDP            Gross Domestic Product
GHG            Greenhouse Gas — usually expressed in tons of eCO2
GMP            Gross Metro Product
HVAC           Heating, Ventilation, and Air Conditioning
ICLEI          International Council of Local Environmental Initiatives
IOU            Investor-Owned Utility
IPCC           International Panel on Climate Change
JPC            Joint Policy Committee
LEED           Leadership in Energy and Environmental Design
LFG            Landfill Gas
MTC            Metropolitan Transportation Commission
PAYS®          Pay As You Save
PG&E           Pacific Gas and Electric Company
PHEV           Plug-in Hybrid Electric Vehicle
PPM            Parts Per Million
SCAPOSD        Sonoma County Agriculture Preservation and Open Space District
SCTA           Sonoma County Transportation Authority
SCWA           Sonoma County Water Agency
SCWMA          Sonoma County Waste Management Agency
SEA            Sonoma Energy Agency
SMART          Sonoma Marin Area Rail Transit
RPS            Renewable Portfolio Standard
VMT            Vehicle Miles Traveled

                                   iv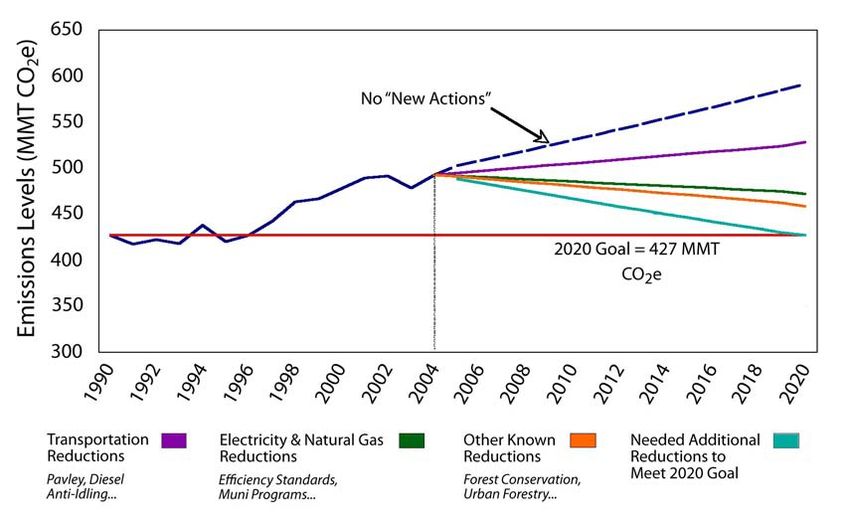
Sonoma County Community Climate Action Plan
                                     Table of Contents
Executive Summary ....................................................................................................................................... i
   Analytic Process Is the Foundation of the Plan ......................................................................................... i
   Summary of Findings .................................................................................................................................ii
Glossary of Acronyms ...................................................................................................................................iv
Call to Action ................................................................................................................................................. 1
   Scientific Imperative .................................................................................................................................. 2
   Economic Imperative ................................................................................................................................ 2
   Moral Imperative ....................................................................................................................................... 3
   Will We Respond at the Speed and Scale Needed? ................................................................................ 3
Solutions Exist ............................................................................................................................................... 4
What Climate Action Has Happened in Sonoma County to Date? ............................................................... 5
   Community Endeavor ............................................................................................................................... 7
   What Is Not in The Community Climate Action Plan? .............................................................................. 8
Global, National, State, and Regional Context ............................................................................................. 8
   Global........................................................................................................................................................ 8
   National ................................................................................................................................................... 10
   State........................................................................................................................................................ 10
   Regional .................................................................................................................................................. 12
Overview of Solutions ................................................................................................................................. 13
   Key Role of Government ........................................................................................................................ 13
How Will Climate Protection Impact the Economy? .................................................................................... 14
Financing: First Get the Economics Right................................................................................................... 15
How Big Is the Investment We Need to Make? .......................................................................................... 16
How Were Solutions Developed and Organized for This Plan? ................................................................. 17
Electricity and Natural Gas.......................................................................................................................... 21
   Overview ................................................................................................................................................. 21
   Overall Goals .......................................................................................................................................... 25
   Efficiency................................................................................................................................................. 25
   Renewable Power ................................................................................................................................... 28
   Financing ................................................................................................................................................ 28
   List of Solutions ...................................................................................................................................... 33
   Summary Table of Solutions................................................................................................................... 37
Transportation and Land Use ..................................................................................................................... 38
   Overview ................................................................................................................................................. 38
   Transportation ......................................................................................................................................... 38
   Land Use................................................................................................................................................. 40
   List of Solutions ...................................................................................................................................... 41
   Summary Table of Solutions................................................................................................................... 45
Agriculture and Forests ............................................................................................................................... 47
   Overview ................................................................................................................................................. 47
   Agriculture ............................................................................................................................................... 47
   Forests .................................................................................................................................................... 47
   List of Solutions ...................................................................................................................................... 48
   Summary Table of Solutions................................................................................................................... 52
Solid Waste ................................................................................................................................................. 54
   Overview ................................................................................................................................................. 54
   List of Solutions ...................................................................................................................................... 54
   Summary Table of Solutions................................................................................................................... 56
Next Steps: Moving from Plan to Implementation ....................................................................................... 57
   Implementation Working Groups ............................................................................................................ 57
   To Conclude: Let’s Get Started .............................................................................................................. 64
Sonoma County Community Climate Action Plan Participants................................................................... 65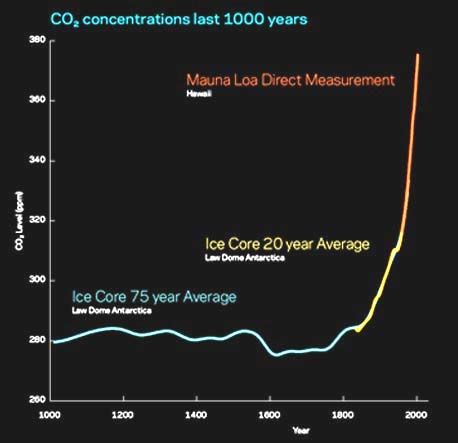
This page is intentionally left blank.
CALL TO ACTION                                     Rajendra Pachauri, the Indian scientist
                                                   and economist who accepted the 2007
Planet earth is in an accelerating state           Nobel Prize on behalf of the Inter-
of emergency. Time is short to avert               governmental Panel on Climate
catastrophic climate change and protect            Change said, “If there’s no action before
the web of life. The climate crisis is dif-        2012, that’s too late. What we do in the
ferent from all other problems humanity            next two to three years will determine
faces because of the severity of the im-           our future. This is the defining moment.”
pacts, the scale of the challenge and the
solutions needed to address it, the
speed with which we must act, and be-
cause impacts are diffuse and therefore
impossible to experience directly.

Global warming is caused by a blanket of carbon dioxide that surrounds the Earth and traps
in heat.

                                              1
ppm to avoid catastrophic climate
                                                        change.3 The seriousness of the situa-
                                                        tion is magnified because carbon diox-
                                                        ide remains in the atmosphere for about
                                                        100 years.

                                                        In 2007, the Intergovernmental Panel on
                                                        Climate Change (IPCC), composed of
                                                        the world’s leading climate scientists,
                                                        released The Fourth Assessment that
                                                        calls for “maximum reductions, as
                                                        quickly as possible” in order to stabilize
                                                        atmospheric carbon dioxide concentra-
Carbon dioxide levels in the atmosphere                 tion at the lowest possible level.4 This is
have risen dramatically. Scientific data show
                                                        the scientific imperative.
a direct relation between CO2 levels and
overall Earth temperature.
                                                            •   Global warming is a manmade
                                                                crisis that’s happening now.
Scientific Imperative
                                                            •   It’s an unintended consequence
The amount of heat-trapping gas sur-                            of using fossil fuels and of
rounding the earth is the key measure of                        deforestation.
climate change. It is expressed in parts
                                                            •   The need to act is urgent.
per million (ppm) of atmospheric carbon
dioxide. The pre-industrial level of car-                   •   It’s not too late.
bon dioxide in the atmosphere was                           •   People are waking up and
about 275 ppm. The current level is 387                         taking action.
ppm.1,2 James Hansen, this country’s                        •   You are part of the solution.
pre-eminent climate scientist, recently
announced that we must return to 350

1
                                                        Economic Imperative
  Since pre-industrial times, the atmospheric
concentration of greenhouse gases has grown             A corresponding economic imperative
significantly. Carbon dioxide (CO2) concentration       — that early and aggressive action is
has increased by about 31 percent, methane              necessary to minimize the economic
concentration by about 150 percent, and nitrous
oxide concentration by about 16 percent
                                                        costs of addressing climate change —
(Watson et al, 2001). The present level of              was made in the Stern Review Report
carbon dioxide concentration is the highest for         on the Economics of Climate Change in
420,000 years, and probably the highest for the
past 20 million years.
(http://www.grida.no/climate/vital/intro.htm),
                                                        3
(http://www.worldchanging.com/archives/007889             “Target atmospheric CO2: Where should
.html),                                                 humanity aim?” Hansen et al, 2008,
(http://maps.grida.no/go/graphic/past_and_futur         (http://arxiv.org/abs/0804.1126v1)
                                                        4
e_co2_concentrations)                                     “Working Group I: The Physical Science Basis
2
  NOAA — Earth Systems Research Laboratory,             of Climate Change,” Intergovernmental Panel on
May 2008,                                               Climate Change, 2007, (http://ipcc-
(http://www.esrl.noaa.gov/gmd/ccgg/trends/)             wg1.ucar.edu/wg1/wg1-report.html)

                                                    2
2006.5 Sir Nicholas Stern, former chief omy. The global climate crisis requires a
economist of the World Bank who pro- similar collective effort. Will we focus our
duced this report, concluded that inac- innovation, investment, and ingenuity
tion would be catastrophic to the global with solutions that meet this global
economy. Melting glaciers and rising crisis?
sea levels could displace 200 million
people; 40 percent of remaining species While investing in solutions may be
could be extinct by 2050. Cost to adapt costly at first, the rewards vastly out-
to this changing world will reach as weigh the costs, as noted in the Stern
much as 5 to 20 percent of the world’s Report. Complacency, hesitation, and
gross domestic product (GDP). If, how- inaction threaten our future. Govern-
ever, we take early and aggressive ac- ment, business, and community leaders
tion, Stern concluded that we can need the people’s support to act. “When
minimize the worst effects of climate the people lead, the leaders follow” is a
change at an estimated cost of 1 per- truism of collective action
cent of world GDP, and that we will
create millions of new jobs in the How Does Great Change Happen?
process. The Hero’s Journey
An age-old story, the Hero’s Journey
Moral Imperative describes how a person is called forth,
World leaders regard the climate crisis leaves home to face a seemingly
as a matter not only of science and eco- impossible challenge, and overcomes it.
nomics, but also of conscience. An un- The journey transforms not only the
derlying moral imperative exists for all hero, but ultimately, his or her
people to assume responsibility to community as well.
protect the climate. Solving the climate crisis is like the
hero’s journey because we must leave
Will We Respond at The behind our old ways of using energy,
Speed and Scale Needed? transform how we live, and offer what
Will we respond to the climate challenge we gain through our transformation to
the way previous generations have met others.
seemingly impossible challenges? In The journey is uncertain and fraught
1941 the people of the United States with peril, but knowing the story helps
mobilized to fight in World War II with a us venture forth.
unity of purpose never seen before.
Along the way we discover who we are.
Following the war the U.S. led the effort
to rebuild Europe under the Marshall
Plan. In response to the Great Depres-
sion, the New Deal was implemented to Although actions by individuals are es-
care for people and invigorate the econ- sential to help slow and reverse climate
change, those actions alone are insuffi-
5
cient to reduce GHG emissions at the
“Stern Review Report on the Economics of scale and speed needed. Neither will
Climate Change,” (http://www.hm-
treasury.gov.uk/independent_reviews/stern_revi volunteerism produce the changes
ew_economics_climate_change/stern_review_R needed, despite a pervasive belief to the
eport.cfm)
3contrary. “Self-reinforced abstinence cleaner air and water; healthier people;
alone is a waste of time,” declared one and preservation of the natural world.
leading writer recently.6 To transform an Some ask if climate change is a global
infrastructure based on fossil fuel to one problem, why do anything on the local
based on renewable energy, a major, level? The Intergovernmental Panel on
system-wide intervention in business as Climate Change (IPCC) emphasizes the
usual is required. Together we must be importance of local action because it is
inspired, aligned, and mobilized. at this level that the most appropriate
In Sonoma County, the solutions out- actions for any given area can be im-
lined in this Plan should be adopted as plemented. The IPCC recommends the
quickly as possible for maximum impact. following for the local level:
The more that readers of this Plan
• Energy efficiency improvement
speak up and show support for taking
• Investment in renewable energy
action, the more likely it is that solutions
will be implemented. • Transportation mode share shifts
• Stronger land use policies
• Better agricultural practices
SOLUTIONS EXIST • Improved municipal services (solid
We possess the means to meet Sono- waste, water, and wastewater).7
ma County’s target. Using proven, off- These recommendations parallel those
the-shelf technologies we can become recently issued by the Brookings Insti-
vastly more energy efficient, and can tute:8
harness the power of renewable energy
sources like solar, wind, and geother- • Expand transit and compact
mal. Given the increasing investment in development options
clean, green technology and the appli- • Engage in regional freight planning
cation of innovative, entrepreneurial to introduce more energy-efficient
thinking, we can expect breakthroughs freight operations
in the near future that will accelerate • Stimulate energy efficient retrofitting
emission reductions. • Incentivize location efficient housing
Although our challenge is great, in many decisions
ways we are in an enviable position. • Issue a metropolitan challenge to
Local momentum is already building to develop innovative solutions that
reduce GHG emissions. Sonoma integrate land use, transportation,
County possesses rich natural, intellec- energy, and other areas
tual, technological, and political capital. 7
We can anticipate a renaissance as the “Policies, Instruments and Co-operative
Arrangements,” S. Gupta et. al., In Climate
billions of dollars now sent overseas to Change 2007: Mitigation of Climate Change.”
buy fossil fuel are instead invested at Contribution of Working Group III to the Fourth
home. This will result in a more secure Assessment Report of the Intergovernmental
economy powered by local, reliable Panel on Climate Change, B. Metz et. al.,
energy; a healthier environment with Cambridge University Press.
8
“Shrinking the Carbon Footprint of
Metropolitan America,” Brown et al, May 2008,
(http://www.brookings.edu/reports/2008/05_carb
6
Heat: How to Stop the Planet from Burning, on_footprint_sarzynski.aspx)
George Monbiot, 2007, South End Press.
4WHAT CLIMATE ACTION Five Steps For
HAS HAPPENED IN Climate Protection
SONOMA COUNTY TO DATE? Step 1: Complete an inventory of
Realizing our responsibility to future greenhouse gas emissions
generations as well as to the present, Step 2: Set a target for reducing
the people of Sonoma County have emissions
pledged to take bold action on climate Step 3: Create a plan for achieving
change, to be environmental stewards the target
and an inspiration to communities Step 4: Implement measures for
nationwide. GHG reductions
Step 5: Track progress toward the
In 2002 all nine Sonoma cities and the
target
County pledged by resolution to partici-
pate in Cities for Climate Protection TM , a
From Cities for Climate Protection TM
program of over 700 local governments
around the world. This program provides
communities with a way to address a
global problem at the local level — by Step 1: Complete an Inventory
adopting practices and policies to re- Of GHG Emissions
duce greenhouse gas (GHG) emissions,
improve air quality, and enhance com- The Climate Protection Campaign com-
munity livability and economic viability. pleted a countywide inventory of Sono-
The program is based on five steps for ma County GHG emissions in 2005
reducing emissions. Local governments based on the following sectors:
follow these steps both for internal mu-
nicipal operations and for the whole • Electricity and natural gas
community.9 • Transportation
• Agriculture
• Solid waste
Major findings of this inventory were that
Sonoma County’s emissions increased
28 percent between 1990 and 2000,
double the national rate. Although pop-
ulation increased by 18 percent from
1990 to 2000, emissions from transpor-
9
tation increased by approximately 42
To address internal operations, all nine cities
percent.
and the County have completed the first two
steps, inventories and targets. The County and
several of the cities have achieved the third
step, adopting climate action plans. The
remaining cities are expected to have plans in
place by the end of 2008. These cutting-edge
plans have proven to be powerful motivators that
make the financial case for climate protection.
Plans are available online:
(www.climateprotectioncampaign.org)
54,500,000
Solid Waste
4,000,000 Agriculture
Transportation (vehicles only)
3,500,000 Electricity & Natural Gas
3,000,000
Annual GHG (tons-CO2/yr)
2,500,000
2,000,000
1,500,000
1,000,000
500,000
0
1990 2000
-500,000
Step 2: Set a Target comprehensive, Sonoma County chose
For Reducing Emissions to create one Plan for Sonoma County
rather than ten plans — one for each
In 2005, all nine cities and the County city and the County.
passed resolutions adopting the boldest
communitywide target in the nation —
Step 4: Implement Measures
25 percent below 1990 levels by 2015
For GHG Reductions
— a target that corresponds with the
scientific imperative. Although this target Major efforts are underway in Sonoma
is aggressive by national standards, it is County to reduce emissions. All nine
on par with targets of other nations. cities are considering and/or have im-
plemented energy efficiency programs
Some European Reduction Targets as well as programs to generate solar
power and other renewables. Similarly
European Union: 20% below 1990 by 2020
many other local agencies, businesses,
United Kingdom: 20% below 1990 by 2010
and schools have embarked on pro-
Germany: 21% below 1990 by 2012
grams to reduce GHG emissions.
Denmark: 21% below 1990 by 2012
Luxembourg: 28% below 1990 by 2012
Sweden: 30% below 1990 by 2020 Step 5: Track Progress
The Climate Protection Campaign has
updated the inventory each year since
Step 3: Create a Plan For 2005 when it completed the GHG base-
Achieving the Target line for Sonoma County. The update for
2007 follows.
This Community Climate Action Plan
fulfills this step. To be efficient and
6Sonoma County Total CO2 Emissions
Electricity, Natural Gas and Transportation
(Updated 2008)
n
io
il l
n
io
m
4,500,000
ill
1
m
4.
6
3.
4,000,000
n
3,500,000
io
ill
m
3,000,000
7
2.
Tons eCO2
2,500,000
Electricity
2,000,000
Natural Gas
1,500,000
Transportation
1,000,000 25% reduction
500,000 Annual Totals
Annual Trend
0
1990 baseline
2000
2001
2002
2003
2004
2005
2006
2007
2008
2009
2010
2011
2012
2013
2014
2015
From 1990 to 2007 Sonoma County’s GHG emissions increased. If we are to achieve our
reduction target (horizontal red line on graph), we must intervene aggressively in business
as usual.
Although Sonoma County has made a from each city and the unincorporated
powerful commitment, our greenhouse area of the County met several times in
gas emissions continue to increase, as full day workshops to engage intensively
shown in the chart above. Can we align in the development of the Plan. The rep-
our actions with our pledge by dramati- resentatives’ role is to help evaluate
cally reducing our emissions? solutions, craft language to describe the
solutions, and build community support
Community Endeavor for the plan. We also were guided by a
Steering Committee and many ad hoc
From its inception to its publication, this advisors from business and other sec-
Community Climate Action Plan (Plan) tors. We invited and received many
was developed with attention, time, and publicly generated solutions that we
resources from many people in Sonoma subsequently evaluated using the crite-
County committed to doing something ria established for the plan.10 We
effective and inspirational to address the engaged a team of technical experts
climate crisis. who developed solutions to form the
basis of this plan.
To inaugurate the Plan, a public meeting
composed of over 200 people was held
in April 2007, which provided much rich
input for the Plan. Over fifty community
representatives from government, busi- 10
See “Public Input from April 2, 2007” in online
ness, youth, and the community at large Source Material at (www.coolplan.org).
7What Is Not in The GLOBAL, NATIONAL, STATE,
Community Climate Action Plan? AND REGIONAL CONTEXT
Several significant causes and sources To reach the scientifically mandated
of GHG emissions were not included in GHG reductions, government at every
the Plan, for example, population level must take significant and rapid ac-
growth, consumer behavior, propane tion. This section highlights the status of
consumption, and airline travel. These such action at each governmental level.
were not addressed in the Plan because In almost every case, current targets
their corresponding analyses and solu- adopted by all levels of government fall
tions were either outside the Cities for short of the scientific imperative, and
Climate Protection protocol, too costly to their plans fail to meet even their short
analyze, too costly to solve, outside lo- targets.
cal control, and/or politically infeasible.
Beyond what this Plan provides, more Global
development as well as implementation Of the total world population in 2006, the
of solutions is needed. We have en- U.S. accounted for 4.5 percent while its
deavored to identify these cases and share of global GHG emissions was
suggest what agencies or other parties more than 24 percent.11
are responsible for the solutions
identified.
11
From
(http://www.solcomhouse.com/toptenco2.htm)
Oak Ridge National Laboratory credited. Note
that recently China surpassed the U.S. in
production of GHG emissions.
8CO2 Emissions in Percent of
Percent of World
Rank Country Thousands of Total
Population
Metric Tons Emissions
1 USA 5,844,042 24.3 4.50
2 China 3,263,103 14.5 20.30
3 Russia 1,432,513 5.9 2.10
4 India 1,220,926 5.1 17.00
5 Japan 1,203,535 5.0 1.90
6 Germany 804,701 3.3 1.20
7 United Kingdom 543,633 2.3 0.92
8 Canada 517,157 2.1 0.50
9 South Korea 446,190 1.8 0.75
10 Italy 433,018 1.8 0.88
This ranking is changing as developing
countries like China and India use more
fossil fuel for their growing economies.
The U.S. will, however, continue to be a
major GHG emitter. Our responsibility
for our historic emissions and our on-
going role as a world leader require that
we more fully participate in the global
effort to avert climate change.
The world’s collective response to doc-
umenting climate change is commend-
able. The Intergovernmental Panel on
Climate Change is a powerful, authori-
tative body of the world’s top climate
scientists. Their work earned them the
Nobel Prize in 2007.
Cities for Climate Change™ provides
strong world leadership for local gov-
ernments, as mentioned previously. while, increasing amounts of GHG
emissions enter the atmosphere and
The Kyoto Protocol, agreed to in 1997, Earth continues to warm. Clearly, the
and entered into force in 2005, Kyoto Protocol is not a solution com-
represents the strongest global collec- mensurate with the scale of the prob-
tive climate protection action to date. As lem.
of November 2007, 175 parties had rati-
fied the protocol; however, the U.S. is But solutions do exist. The above
not one of the ratifying parties. Mean- graphs, produced in 2004 by Princeton
scientists Pacala and Socolow, are in-
9tended to show how a package of December 2007. This law raises auto-
measures (represented as wedges in motive fuel economy standards for the
graph B) using current technology can first time in more than three decades by
intervene in business as usual (BAU) to requiring automobile manufacturers to
reduce GHG emissions to the level produce cars with an average of 35
needed, according to “WRE500.” 12 miles per gallon by the year 2020. The
“Humanity already possesses the fun- law also boosts federal support for alter-
native fuel research and energy conser-
damental scientific, technical, and in-
vation.
dustrial know-how to solve the carbon
and climate problem for the next half- Other positive federal signs include
century. A portfolio of technologies now progress made by bills in 2007, although
exists to meet the world's energy needs none were passed. The bill authored by
over the next 50 years and limit atmos- Senators Lieberman (ID-CT) and
pheric CO2 to a trajectory that avoids a Warner (R-VA) called America’s Climate
doubling of the preindustrial concentra- Security Act would set a target to reduce
tion. Every element in this portfolio has total U.S. greenhouse-gas emissions 19
passed beyond the laboratory bench percent below 2005 levels (4 percent
and demonstration project; many are below 1990 levels) by 2020 and 63 per-
already implemented somewhere at full cent below 2005 levels by 2050. Also,
industrial scale. Although no element is the Safe Climate Act of 2007 (H.R.
a credible candidate for doing the entire 1590) introduced in March 2007 by Rep-
job (or even half the job) by itself, the resentative Waxman (D-CA) also sets
portfolio as a whole is large enough that targets (2 percent reduction each year
not every element has to be used.” from 2010 to 2050) and would require
actions such as setting caps on emis-
National sions of sources and sectors with the
U.S. administration and Congressional largest emissions, issuing and authoriz-
action regarding the climate crisis has ing trading of emission allowances, and
also been inadequate. To date only vol- penalizing excess emissions.
untary efforts are required by the federal
State
government, and there is no national
emissions reduction target. Many place California has long been an environ-
hope in new presidential leadership in mental leader starting in the nineteenth
2009; top presidential candidates have century with John Muir. In 2005 Gover-
pledged that climate protection will be nor Schwarzenegger signed an Execu-
among their priorities. tive Order that established California’s
series of GHG emissions reduction
Recent positive steps include the
targets:
enactment of a national energy bill in
12
“Stabilization Wedges: Solving the Climate • By 2010, reduce to 2000 emission
Problem for the Next 50 Years with Current levels
Technologies,” S. Pacala and R. Socolow, • By 2020, reduce to 1990 emission
Science, 13 August 2004, levels
(http://www.sciencemag.org/cgi/content/full/305/
5686/968) • By 2050, reduce to 80 percent below
WRE500 = Wigley, Richels, Edmonds model for 1990 levels
stabilization at 500 parts per million.
10While bold com-
pared with
global and na-
tional commit-
ments, Califor-
nia’s targets are
still too low and
too slow com-
pared with the
scientific im-
perative. And,
as seen in the
graph to the
right, even if all
of California’s
proposed
solutions were
implemented, a
gap remains in
meeting the
targets.
• Will identify a list of discrete early
Currently, the most significant state level actions that directly address GHG
legislation in California to reduce emis- emissions that are regulatory and
sions in California to begin meeting can be enforced by January 1, 2010.
these targets is the Global Warming
Solutions Act of 2006, Assembly Bill 32 California currently emits almost 500
(AB32). Implementation of AB32 is million metric tons of greenhouse gases
driving many policy actions that will — 28 percent from electricity generation
have far reaching effects on the electric- and more than 38 percent from trans-
ity and natural gas utilities, transporta- portation.
tion systems, and industries including
construction. More specifically, AB32: California must step up efforts with
every emissions-saving technique in its
• Commits the State to reduction of substantial repertoire for transportation
GHGs to 1990 levels by 2020 and electricity to reduce greenhouse
• Determines what 1990 emissions gases in 2020 to the levels mandated by
were the AB 32 goals. As the graph above
• Sets annual emissions limits that will reflects, meeting the State’s target will
result in meeting the target require a major intervention to change
• Requires the California Air Re- business as usual.13
sources Board (CARB) to develop
regulations and market mechanisms 13
“Integrated Energy Policy Report, 2007
to cap emissions and establish a Summary,” California Energy Commission,
mandatory reporting system to track 2007,
and monitor emissions levels; and (http://www.energy.ca.gov/2007publications/CE
C-100-2007-008/CEC-100-2007-008-CMF-
ES.PDF)
11Governor Schwarzenegger stressed that
“Some have challenged whether AB32 is
AB32 will be good for both the economy
good for businesses. I say unquestionably
and the environment. Two substantial
it is good for businesses. Not only large,
research studies support the Governor’s
well-established businesses, but small
assertion. The State’s top energy mod-
businesses that will harness their
elers found that by 2020, 83,000 jobs
entrepreneurial spirit to help us achieve
and $4 billion in income could be gener-
our climate goals…. We simply must do
ated in California by meeting the state’s
everything in our power to slow down
GHG reduction goals. Additionally,
global warming before it's too late.”
leading economists from the University
Gov. Schwarzenegger, September 2006
of California — Berkeley concluded that
policies, such as cleaner standards for use of transit resulting in fewer ve-
vehicles and capturing methane from hicles miles traveled and reduced
landfills, would increase the State’s GHG emissions.
GDP by approximately $60 billion, and • The California Attorney General’s
create over 20,000 new jobs.14 office has also begun efforts to in-
clude GHG reduction within the
Other current significant initiatives in scope of the California Environmen-
California include: tal Quality Act (CEQA). These efforts
have been largely targeted at quan-
• Assembly Bill 1493 was sponsored tifying and mitigating the effect on
by Assembly member Pavley and emissions of new development and
enacted in 2002. The “Pavley Bill” is local General Plans.
precedent-setting legislation that
limits tailpipe emissions of GHG from
automobiles in California. This leg- Regional
islation has encountered various bar- Four Bay Area agencies — the Bay
riers to implementation, the most Area Air Quality Management District,
recent being denial of a waiver by Metropolitan Transportation Commis-
the U.S. Environmental Protection sion, Association of Bay Area Govern-
Agency (EPA). ments, and San Francisco Bay
• Senate Bill 375, sponsored by Sena- Conservation and Development Com-
tor Steinberg, is a land use reform mission — have also formally made cli-
bill that requires regional planning by mate protection part of their agendas.
local governments. It is designed to Separately they are pursuing trailblazing
help protect prime farmland, habitat, regulatory and incentive-based pro-
and other open space; encourage grams, and together through the Joint
compact development; and increase Policy Committee they are also forging a
coordinated effort to reduce emissions
14
Hanemann, Michael and A. Farrell, "Managing throughout the region. Elected repre-
Greenhouse Gas Emissions in California,” sentatives and others from Sonoma
January 2006. County helped spur regional climate
(http://calclimate.berkeley.edu/managing_GHGs protection leadership through their influ-
_in_CA.html) and Chapter 8, “Economic
Assessment,” Climate Action Team Report,
ence on regional agencies.
March 2006
(http://www.climatechange.ca.gov/climate_actio
n_team/reports/index.html)
12OVERVIEW OF SOLUTIONS Material, on which this summary of
solutions is based.15
The package of solutions in this Com-
munity Climate Action Plan (Plan) will Key Role of Government
enable Sonoma County to achieve its
bold greenhouse gas reduction target When society’s normal functioning fails
and meet Sonoma County’s share of to respond adequately to urgent circum-
reductions toward the scientific impera- stances, government must intervene.
tive. Coincidentally, the solutions for Historically, the hallmark of all fast,
climate change align with those for large-scale transformations has been
“Peak Oil,” the name given to the prob- government’s strong engagement in
lem of running out of fossil fuels and planning, coordinating, and allocating
therefore crashing the economic and resources, backed by its administrative
social systems they support. In essence, power.
the solutions are a blueprint for an ambi-
tious, large scale public works project The U.S. gear-up for war after the
similar to what was done to recover from bombing of Pearl Harbor exemplifies the
the Great Depression, to electrify our potential speed and scale of American
rural areas, and to build our highway mobilization. After Pearl Harbor, the
system. Like these efforts, these solu- U.S. government told Detroit to stop
tions rely on the collective efforts, tech- manufacturing automobiles for private
nical know-how, and ingenuity of use and start building tanks and other
Americans to meet significant war materiel. Automobile production
challenges. was 162,000 in 1941, and zero in 1942.
Tank production was less than 300 in
“Where there’s a will, there’s a way” has 1940, and 25,000 by 1942.
a corollary: “Where there’s a way,
there’s a will.” This plan is intended to Our dependency on fossil fuel will not
provide the way to galvanize this end in time by leaving the free market to
community’s pressing desire to produce its devices, by voluntary measures, by
extraordinary climate protection “business as usual,” and by aspirational
achievements in Sonoma County and goals. Only government intervention
inspire other communities around the including innovative fiscal policy, con-
nation to do the same. certed investment, and appropriate
regulation will do this.
In developing this Plan, we searched
nationwide to find and import the best While every community on earth is
examples of community climate action threatened by catastrophic global
plans and local solutions that signifi- warming, governments have yet to
cantly, rapidly, and cost-effectively respond with the speed and financial
reduce GHG emissions. commitment necessary. Worldwide, citi-
zens must impel their governments to
To gain a full understanding of these
solutions, readers are encouraged to
view the reports located in the Source
15
All Community Climate Action Plan documents
are posted online: (www.coolplan.org)
13act.16 In Sonoma, the County and cities aggregate macroeconomic impacts
have pledged such action. Now com- through 2020.”19
munity members and business leaders
must let their elected leaders know that A fourth’s in-depth analysis extinguished
they have their support to move swiftly the myth that “addressing GHG emis-
on bold climate protection initiatives. sions will severely strain the global
economy.” It further showed the range
HOW WILL CLIMATE PROTECTION of emission reduction measures that
yield an economic payback.20
IMPACT THE ECONOMY?
Because no County-specific economic The fifth and most recent economic
studies have been made, conclusions of analysis projects the following benefits
five studies assessing the impact of to be realized by 2020 in California with
climate protection on California’s the implementation of the climate pro-
economy are summarized here to tection measures outlined in the Draft
forecast the impact of climate protection Scoping Plan for AB32:
on Sonoma County’s economy. One
study found that “climate action in • Increasing production activity by
California can yield net gains for the $27 billion
state economy, increasing growth and • Increasing overall Gross State
creating jobs.”17 Product by $4 billion
• Increasing overall personal income
Another concluded that achieving Cali- by $14 billion
fornia’s targets will promote economic • Increasing per capita income by
growth through savings from reduced $200
energy bills and the benefits of investing • Increasing jobs by more than
in technologies for innovation.18 100,00021
A third stated that “California’s 2020
emission target can be achieved with
small positive or small negative [less 19
Updated Macroeconomic Analysis of Climate
than 1 percent in either direction] Strategies Presented in the March 2006 Climate
Action Team Report, Final Report, Economic
Subgroup, California Climate Action Team, Oct.
2007,
16
Key role of government taken from Climate (http://www.climatechange.ca.gov/events/2007-
Code Red: The Case for a Sustainability 09-14_workshop/final_report/2007-10-
Emergency, David Spratt and Philip Sutton, 15_MACROECONOMIC_ANALYSIS.PDF)
20
2008, Scribe Publications, Global Mapping of Greenhouse Gas
(http://www.climatecodered.net/) Abatement Opportunities, Vattenfall, January
17
“Managing Greenhouse Gas Emissions in 2007,
California,” California Climate Change Center, (http://www.vattenfall.com/www/ccc/ccc/Gemein
UC Berkeley, January 2006, same_Inhalte/DOCUMENT/567263vattenfall/P0
(http://calclimate.berkeley.edu/managing_GHGs 273261.pdf)
21
_in_CA.html) Economic Analysis Supplement Pursuant to
18
See also “Economic Growth and Greenhouse AB32, The California Global Warming Solutions
Gas Mitigation in California,” Roland-Holst, Act of 2006, California Air Resources Board,
August 2006, Sept. 2008,
(http://calclimate.berkeley.edu/Growth_Strategie (http://www.arb.ca.gov/cc/scopingplan/document
s_Full_Report.pdf) /economic_analysis_supplement.pdf)
14As mentioned earlier in this Plan, Sir Financing provides the means to do this.
Nicolas Stern concluded that we can Innovative changes in public fiscal poli-
minimize the worst effects of climate cies can stimulate our economy to
change at an estimated cost of 1 per- switch from fossil fuel to renewables and
cent of world GDP, and that we will implement the solutions that exist.
create millions of new jobs in the Transforming our energy infrastructure
process. Closer to home, a recent eco- creates new opportunities for this com-
nomic study prepared for Sonoma munity to invest in itself.
County hints at the emerging impor-
tance of green services that are listed as
part of the County’s nine key economic
clusters.22
FINANCING: FIRST GET
THE ECONOMICS RIGHT
If solutions exist and Sonoma County
has pledged to protect the climate, what
keeps us from aligning our actions with
our pledge? In most cases the per-
ceived hurdle is funding. But the money
exists; locally we spend millions of dol-
lars on fossil fuels. How do we shift our
spending from fossil fuels to renew-
ables?
Financing provides the means to escape
the fossil fuel trap to a renewably-powered
future.
22
“The Sonoma County Economy (draft),”
Moody’s Economy.com, January 2008,
(http://www.co.sonoma.ca.us/edb/pdf/innovation/
innovation_draft_economic_report.pdf)
15HOW BIG IS THE INVESTMENT • The annual cost of new construction
is approaching $1 billion.26
WE NEED TO MAKE?
• The County’s annual electricity bill is
Though several of the solutions identi- almost $500 million and our natural
fied in this Plan do not yet have pro- gas bill is about $200 million.
jected costs associated with them, we
estimate that we must invest $3.5 to
$4 billion over the next few decades to Sonoma County Data for 2005
accomplish the most essential priorities. • Population = 466,477
This investment will make possible the • Residential Energy Accounts = 186,571
shift in spending from fossil fuels to • Housing Units = 193,353
renewable energy. The Plan addresses • Commercial Space = 54,000,000 ft2
the need for financing and new • Total Auto Registrations = 274,950
investment mechanisms (see section
• Automobile Trips Every Day = 1,332,627
below) for this energy system
• Vehicle Miles Traveled Per Year =
transformation.
3.8 billion
To put this investment into perspective
and test it against reality, we examined These numbers illustrate that a public
related County expenditures: works project such as described in this
Plan, financed wisely and amortized
• The 2007 Gross Metro Product for over time, is a realistic magnitude given
Sonoma County was $18.5 billion.23 what we already spend in this County.
• The annual total cost of car, truck, Making this investment will give us a
and motorcycle travel in Sonoma more stable and secure energy system
County is more than $5 billion, in- that keeps County energy dollars in the
cluding about $850 million in fossil County, creates jobs, and attracts new
fuels.24 technology research and industry.
• The budget for widening Highway
101 from Petaluma to Windsor The scope of this Plan requires as broad
(23 miles) plus the Narrows is over a range of financial tools as possible to
$1 billion.25 cover projects in both public and private
sectors. Accessing low-cost capital is
one of the most important goals of this
23
“The Sonoma County Economy,” Prepared by Plan. One promising opportunity lies in
Moody’s Economy.com for the Sonoma County municipal bond financing, a proven and
Innovation Council, January 2008, effective approach for implementing
(http://www.co.sonoma.ca.us/edb/pdf/innovation/ public works projects. Innovative financ-
innovation_draft_economic_report.pdf)
24
Calculated in the Transportation source
ing methods are required to increase
document of the Plan from data provided by uptake of measures to reduce GHG
Victoria Transport Policy Institute, TDM
Encyclopedia. In 2005, Sonoma County used
238 million gallons of gasoline and diesel, which (http://www.sctainfo.org/measure_m_strategicpl
would cost at least $850 million at a gasoline an.htm)
26
price of $3.50 per gallon and diesel price of Sonoma County 2007 – 2008 Economic and
$4.00 per gallon. Demographic Profile, Sonoma County Economic
25
2007 Measure M Strategic Plan, Sonoma Development Board, (http://www.sonoma-
County Transportation Authority, county.org/edb/reports.htm)
16You can also read