Spatial clustering of fourteen tick species across districts of Zimbabwe
←
→
Page content transcription
If your browser does not render page correctly, please read the page content below
Shekede et al. BMC Veterinary Research     (2021) 17:91
https://doi.org/10.1186/s12917-021-02792-2

 RESEARCH ARTICLE                                                                                                                                  Open Access

Spatial clustering of fourteen tick species
across districts of Zimbabwe
Munyaradzi Davis Shekede1* , Silvester Maravanyika Chikerema2, Moregood Spargo3, Isaiah Gwitira1,
Samuel Kusangaya1, Aldridge Nyasha Mazhindu1 and Daud Nyosi Ndhlovu2

  Abstract
  Background: Ticks transmit several diseases that result in high morbidity and mortality in livestock. Tick-borne
  diseases are an economic burden that negatively affect livestock production, cost countries billions of dollars
  through vaccine procurement and other disease management efforts. Thus, understanding the spatial distribution
  of tick hotspots is critical for identifying potential areas of high tick-borne disease transmission and setting up
  priority areas for targeted tick disease management. In this study, optimised hotspot analysis was applied to detect
  hotspots and coldspots of 14 common tick species in Zimbabwe. Data on the spatial distribution of tick species
  were obtained from the Epidemiology Unit of the Division of Veterinary Field Services of Zimbabwe.
  Results: A total of 55,133 ticks were collected with Rhipicephalus decoloratus being the most common species
  (28.7%), followed by Amblyomma hebraeum (20.6%), and Rhipicephalus sanguineus sensu lato (0.06%) being the least
  common species. Results also showed that tick hotspots are species-specific with particular tick species occupying
  defined localities in the country. For instance, Amblyomma variegatum, Rhipicephalus appendiculatus, Rhipicephalus
  decoloratus, Rhipicephalus compostus, Rhipicephalus microplus, Rhipicephalus pravus, and Rhipicephalus simus were
  concentrated in the north and north eastern districts of the country. In contrast, Amblyomma hebraeum, Hyalomma
  rufipes, Hyalomma trancatum and Rhipicephalus evertsi evertsi were prevalent in the southern districts of Zimbabwe.
  Conclusion: The occurrence of broadly similar hotspots of several tick species in different districts suggests presence of
  spatial overlaps in the niche of the tick species. As ticks are vectors of several tick-borne diseases, there is high likelihood
  of multiple disease transmission in the same geographic region. This study is the first in Zimbabwe to demonstrate
  unique spatial patterns in the distribution of several tick species across the country. The results of this study provide an
  important opportunity for the development of spatially-targeted tick-borne disease management strategies.
  Keywords: Tick species, Hotspots, Getis-Ord Gi* statistic, Livestock disease transmission, Disease management

Background                                                                            [2]. For instance, tick borne diseases affect 80% of the
Ticks host pathogens that cause several livestock dis-                                world cattle population [3], cost countries between
eases of veterinary and economic concern [1]. The path-                               13.9–18.7 billion annually through vaccine procurement
ogens include bacteria, helminths, protozoans and                                     and deaths (35). The high cattle morbidity and mortality
viruses. These pathogens cause a variety of diseases that                             result from common tick-borne diseases such as ana-
negatively affect livestock production and human health                               plasmoses, babesioses, cowdriosis and theilerioses [4]. In
                                                                                      regions where tick-borne diseases are common, mortal-
* Correspondence: shekede@gmail.com; shekede@gis.uz.ac.zw                             ity rates in the range of 20–95% have been recorded. For
1
 Department of Geography Geospatial Sciences and Earth Observation,                   example, in sub-Saharan Africa theileriosis (East Coast
Faculty of Science, University of Zimbabwe, MP167 Mount Pleasant, Harare,
Zimbabwe
                                                                                      Fever) alone accounts for ~ 1 million cattle deaths annu-
Full list of author information is available at the end of the article                ally resulting in approximately USD300 million in
                                       © The Author(s). 2021 Open Access This article is licensed under a Creative Commons Attribution 4.0 International License,
                                       which permits use, sharing, adaptation, distribution and reproduction in any medium or format, as long as you give
                                       appropriate credit to the original author(s) and the source, provide a link to the Creative Commons licence, and indicate if
                                       changes were made. The images or other third party material in this article are included in the article's Creative Commons
                                       licence, unless indicated otherwise in a credit line to the material. If material is not included in the article's Creative Commons
                                       licence and your intended use is not permitted by statutory regulation or exceeds the permitted use, you will need to obtain
                                       permission directly from the copyright holder. To view a copy of this licence, visit http://creativecommons.org/licenses/by/4.0/.
                                       The Creative Commons Public Domain Dedication waiver (http://creativecommons.org/publicdomain/zero/1.0/) applies to the
                                       data made available in this article, unless otherwise stated in a credit line to the data.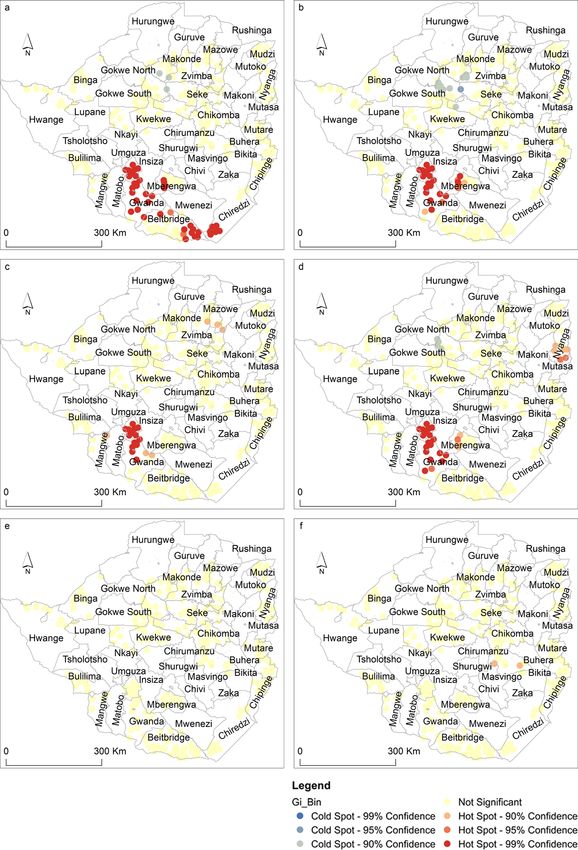
Shekede et al. BMC Veterinary Research   (2021) 17:91                                                           Page 2 of 9

economic losses [5]. The high mortality rates are associ-     their evolution over time. In a recent study by [19],
ated with low dipping frequency prevalent in communal         changes in the spatial distribution of lumpy skin dis-
areas where farmers depend on government assistance           ease hotspots were modelled using georeferenced data
for chemicals [6]. In addition, ticks reduce growth rates     in Zimbabwe. Spatial statistics were applied to detect
and milk production as well as induce fertility problems      transmission hotspots of human anthrax in Georgia in
among livestock [7]. Although ticks mostly affect live-       a study by [20]. Furthermore, [17] used a retrospect-
stock, they also threaten human health in instances           ive space–time scan statistics to detect temporal and
where people consume meat from animals that succumb           spatial clusters of dermatophilosis, a tick-borne dis-
to diseases spread by ticks [1, 8]. Thus, understanding       ease. Put together, these studies provide important in-
the spatial distribution of tick hotspots, i.e., geographic   sights into the importance of applying geospatial tools
regions with high tick prevalence, is important for iden-     and spatial analytical approaches in improving tick
tifying potential tick-borne disease transmission areas.      and tick-borne disease hotspot detection. In this
Information on tick hotspots is critical for guiding live-    study, therefore, geospatial techniques and spatial sta-
stock disease control and management strategies such as       tistics were applied to explore the spatial distribution
optimal location of dip tanks. Moreover, mapping tick         and prevalence of 14 georeferenced tick species. The
hotspots is critical for optimal resource allocation          intention was to test whether the occurrence of the
through targeting preventive and control strategies to        tick species exhibited any systematic spatial pattern as
areas with greatest need. This is particularly important      opposed to being randomly distributed in Zimbabwe.
in resource limited countries such as Zimbabwe where
dipping chemicals are usually inadequate to cover the         Results
whole country.                                                Spatial distribution of tick hotspots in Zimbabwe
   Several studies have been undertaken on various as-        A total of 55,133 ticks were observed across the sampled
pects of ticks and tick-borne diseases in Zimbabwe.           districts with Rhipicephalus decoloratos (28.85%) being
These studies range from those that characterised life        the dominant species, followed by A. hebraeum (20.6%),
cycle of tick parasites [9] to those that modelled suitable   R. appendiculatus (14.8%), H.rufipes (8.9%), R. microplus
habitats of tick vectors [1, 10]. Related studies focused     (7.2%), R. evertsi evertsi (5.9%), A.variegatum (3.8%), H.
on tick-borne disease control [11–14], experimental vac-      truncatum (2.7%), R. simus (2.3%), R. zambeziensis
cine trials in cattle [1] including tick infestations among   (2.2%), R. compostus (2.2%), H. leachi (0.4%), R. pravus
livestock [6]. Other studies concentrated on communal         (0.09%) and R. sanguineus sensu lato (0.06%).
farmers’ perceptions of cattle diseases [7, 15] and disease     The spatial distribution of tick hotspots across districts
epidemiology [6, 16]. While these studies provided in-        of Zimbabwe is illustrated in Figs. 1 and 2. The results
valuable insights into tick-borne disease transmission,       indicate that particular tick species tend to cluster in
they lack location-specific information on the spatial dis-   specific localities in the country. For instance, the north
tribution and prevalence of each tick species. This is des-   and north eastern districts of the country are charac-
pite the fact that location-specific information on           terised by spatial clustering of A. variegatum, R. appen-
different tick species forms the basis for effective man-     diculatus, R. decoloratus, R. compostus, R. microplus, R.
agement of tick-borne diseases. In fact, spatial patterns     simus, R. zambeziensis and R. pravus. Specifically, the
of tick prevalence have not been fully explored in            eight tick species were dominant in Bindura, Goromonzi,
Zimbabwe [17]. The limited focus on spatial patterns of       Guruve, Mazowe, Mudzi, Nyanga, Shamva and Zvimba
tick prevalence may partly explain why, to date, there is     districts (Fig. 1). The spatial distribution of A. variega-
no consistent strategy to effectively prevent or control      tum (a), R. appendiculatus (b), R.decoloratus (c), and R.
tick-borne diseases in the country [18]. In this regard,      compostus (d) was more extensive than other tick species
modelling spatial patterns of tick prevalence through         (Fig. 1).
hotspot analysis is critical for understanding livestock        In contrast, Fig. 2 shows that hotspots of A. hebraeum
disease ecology as well as providing knowledge on para-       (a), H. rufipes (b), H. trancatum (c) and R. evertsi evertsi
site transmission dynamics that is important for effective    (d) tick species were prevalent in the southern districts
and sustainable management of tick-borne diseases.            of Zimbabwe. These tick species were common in Beit-
   Modelling of spatial patterns of tick hotspots has         bridge, Chiredzi, Gwanda and Umzingwane districts.
improved greatly over the years due to the ready                Furthermore, R. appendiculatus (Fig. 1b) and R. deco-
availability of spatially referenced data on tick species     loratus (Fig. 1c) had identifiable coldspots in the south-
prevalence across Zimbabwe. The increased availabil-          ern regions of the country. Compared to other tick
ity of tick species data coupled with advances in geo-        species that formed identifiable hotspots or coldspots, H.
spatial tools and spatial statistics allow for the            leachi (Fig. 2e) and R. sanguineus sensu lato (Fig. 2f) ex-
determination of location specific patterns including         hibited a random pattern.
Shekede et al. BMC Veterinary Research        (2021) 17:91                                                                                 Page 3 of 9

 Fig. 1 Spatial distribution of a Amblyomma variegatum, b Rhipicephalus appendiculatus, c Rhipicephalus decoloratus, d Rhipicephalus compostus, e
 Rhipicephalus microplus, f Rhipicephalus simus, g Rhipicephalus zambeziensis and h, Rhipicephalus pravus hotspots and coldspots across districts of
 Zimbabwe (Map designed and produced by the authors). The figure illustrates the spatial distribution of hotspots and cold spots across districts
 of Zimbabwe

Shekede et al. BMC Veterinary Research      (2021) 17:91                                                                              Page 4 of 9

 Fig. 2 Spatial distribution of a Amblyomma hebraeum, b Hyalomma rufipes c, Hyalomma trancatum, d Rhipicephalus evertsi evertsi e Rhipicephalus
 decoloratus and f Rhipicephalus sanguineus sensu lato hotspots and coldspots in Zimbabwe (Map designed and produced by the authors). The
 figure illustrates the spatial distribution of hotspots and cold spots across districts of Zimbabwe

Discussion                                                                 (c) R. decoloratus, (d) R. compostus, (e) R. microplus, (f)
The study aimed at testing whether 14 tick species lo-                     R. simus and (g) R.zambeziensis) had hotspots predom-
cated in Zimbabwe exhibited significant clustering based                   inantly located in the north and north eastern districts
on spatial statistics. Results of this study showed that                   of the country while four (Fig. 2)(a) Amblyomma heb-
most tick species exhibit hotspots and coldspots in spe-                   raeum, (b) H. rufipes (c), H. trancatum and (d) R. evertsi
cific districts of the country. For instance, seven tick spe-              evertsi) had significant hotspots in the southern districts.
cies i.e., (Fig. 1) (a) A. variegatum, (b) R. appendiculatus,              This study is the first to quantitatively detect hotspots of
Shekede et al. BMC Veterinary Research   (2021) 17:91                                                             Page 5 of 9

several tick species in Zimbabwe within a spatially-               The spatial clustering of ticks in specific districts cor-
explicit analytical framework.                                  roborate and expand previous studies on the spatial dis-
   The spatial coincidence in the occurrence of tick spe-       tribution of ticks and tick-borne diseases in Zimbabwe.
cies hotspots e.g., A. variegatum, R appendiculatus and         In a previous study, [17] modelled spatio-temporal pat-
R. decoloratus in the northern parts of the country, sug-       terns of bovine dermatophilosis (a disease associated
gests spatial overlaps in the niche of these species.           with A variegatum) over a 19 year period in Zimbabwe
Spatial overlaps were also noted in the southern parts of       and observed a directional spread of the disease from
the country associated with ticks such as A. hebraeum,          the identified clusters over time. Similarly, [19] showed
H. rufipes and H. truncatum. The presence of spatial            that there was a shift in the distribution of ixodid ticks
overlaps in the geographic distribution of these tick spe-      in Zimbabwe. While these studies and other related
cies suggests the possibility of co-infection of livestock      studies have generated useful information on areas to
by several tick-borne diseases. This calls for an inte-         target for disease management, results of this study em-
grated approach in the control of multiple tick-borne           phasise the need for increasing efforts towards under-
diseases in areas characterised by multiple tick species.       standing tick distribution and its related local
In addition, the spatial overlaps in hotspots and, through      epidemiological significance. In fact, this study observed
inference, habitats of tick vectors imply the need for fur-     a strong significant positive correlation between A. heb-
ther research aimed at understanding the common                 raeum abundance and cattle mortality resulting from
drivers of these ticks [21]. Results of this study therefore,   heartwater disease (r = 0.73, p = 0.000) thereby further
provide valuable insights into the need to develop novel,       emphasising the need for tick hotspot detection (Fig. 3).
spatially explicit control and prevention strategies for        Thus, focusing on the source of tick-borne diseases is
tick-borne diseases in similar environments. For in-            likely to be more effective in preventing the diseases
stance, this study showed that the southern parts of the        than trying to cure the disease.
country are not hotspot areas for R. appendiculatus                Although mechanisms explaining hotspots/coldspots
which is an important vector of theileriosis in                 of specific tick vector species were beyond the scope of
Zimbabwe. The implication therefore is that tick control        this study, further investigation is required to under-
measures in this particular region, should be targeted at       stand the drivers of detected patterns. However, the
A. hebraeum and R. decoloratus whose life cycles on the         prevalence of tick species in a geographic area is driven
host are longer than that of A appendiculatus [1]. This         by factors such as dipping frequency, acaricide resist-
study corroborates previous studies on the distribution         ance, unrestricted movement of cattle, availability of al-
of particular tick species such as A. hebraeum, R. appen-       ternative hosts, rainfall patterns and landuse changes.
diculatus, R. microplus and R. decoloratus. A study by          For example, reduced dipping frequency is known to
[21] reported that the distribution of A. variegatum was        promote endemism of tick-borne diseases [22]. In
mainly limited to the north western parts of Zimbabwe           Zimbabwe, dipping frequency declined significantly over
while A. hebraeum was mainly found in the southern              the years due to a shift in responsibility of tick control
parts of the country.                                           from government to livestock owners in line with eco-
   In this study, results show that the occurrence of ticks     nomic structural adjustment programs [7] coupled with
such as H. leachi and R. sanguineus sensu lato exhibit a        foreign currency shortages for procurement of dipping
random pattern. In other words, the specific tick species       chemicals. The reduced dipping frequency has been at-
are randomly distributed in space and thus do not form          tributed to the death of approximately 50,000 cattle as a
any significant clusters. Such a pattern in tick distribution   result of theileriosis during the 2017/2018 rainfall sea-
pose challenges in the implementation of control and            son. Furthermore, acaricide resistance has been identi-
prevention strategies as the vectors do not have a speci-       fied as a key threat to control of tick vectors in
fied location which can be targeted. The results imply the      Zimbabwe especially in geographic settings where acari-
need for constant monitoring of such ticks to detect any        cide rotation practices are absent [7]. Land use change
potential outbreaks in diseases associated with them. The       and shifting rainfall patterns across different agro-
Government of Zimbabwe’s Animal Health (Cattle                  ecological regions are also likely to result in spatial het-
cleansing) Regulations Statutory Instrument (SI) 250 of         erogeneity in tick prevalence at various spatial scales
(1993) specifies tick species such as R. appendiculatus,        [21]. The approach adopted in this study and the associ-
A. hebraeum, A. variegatum, R. decoloratus and R. micro-        ated results could be key in influencing the need for a
plus as pests hence dipping or any tick control strategy        change in the traditional approach of tick-borne disease
should target such species. The presence of hotspots of         management where similar strategies of tick control are
particular tick species in certain districts might require      implemented throughout the country. Based on the re-
these areas to be declared as endemic for purposes of en-       sults of this study, dipping frequency could be guided by
hanced tick and tick-borne disease control.                     abundance and distribution of different tick species.
Shekede et al. BMC Veterinary Research     (2021) 17:91                                                                          Page 6 of 9

 Fig. 3 The significant positive relationship between Amblyomma hebraeum abundance and cattle mortality from heart water disease (Figure
 designed and produced by the authors). The figure illustrates relationship between Amblyomma hebraeum abundance and cattle mortality from
 heart water disease

Further, this information can be used to strengthen                     Conclusion
existing legislation on tick control.                                   This study tested the extent to which fourteen tick spe-
   A potential weakness of this study is in its relatively              cies cluster in space across districts of Zimbabwe. Re-
short duration (five months) and insensitivity to the                   sults indicate the co-occurrence of hotspots for several
life stage of ticks in the analysis of hotspots. It is pos-             tick species suggesting possible spatial overlaps in their
sible that increasing sampling time could correspond-                   niche in addition to possible co-infection of livestock by
ingly increase the number of tick species encountered.                  multiple diseases. This study is one of the first in
For instance, a previous study [23] reported encoun-                    Zimbabwe to demonstrate unique capabilities of spatial
tering 15 tick species during a one and half year sur-                  statistics in understanding distribution of several tick
vey. Further, increasing study duration could be                        species in specific parts of the country. Results of this
important in exploring population dynamics and                          study provide opportunities for the development of tick-
spatial distribution of tick species across the country.                borne disease management and control strategies tai-
Given the seasonality of rainfall in the country, future                lored for specific areas.
studies could test whether the spatial distribution of
ticks is related to season in addition to determining                   Methods
whether hotspots are life-stage dependent. Nonethe-                     Study area
less, results of this study are useful in targeted man-                 The study was carried out across districts of Zimbabwe;
agement of tick-vectors which is relevant in resource                   a semi-arid country located between 15°30″ and 22°30″
constrained countries.                                                  S of latitude 25°00″ and 33°10″E longitude. Elevation is
Shekede et al. BMC Veterinary Research (2021) 17:91 Page 7 of 9
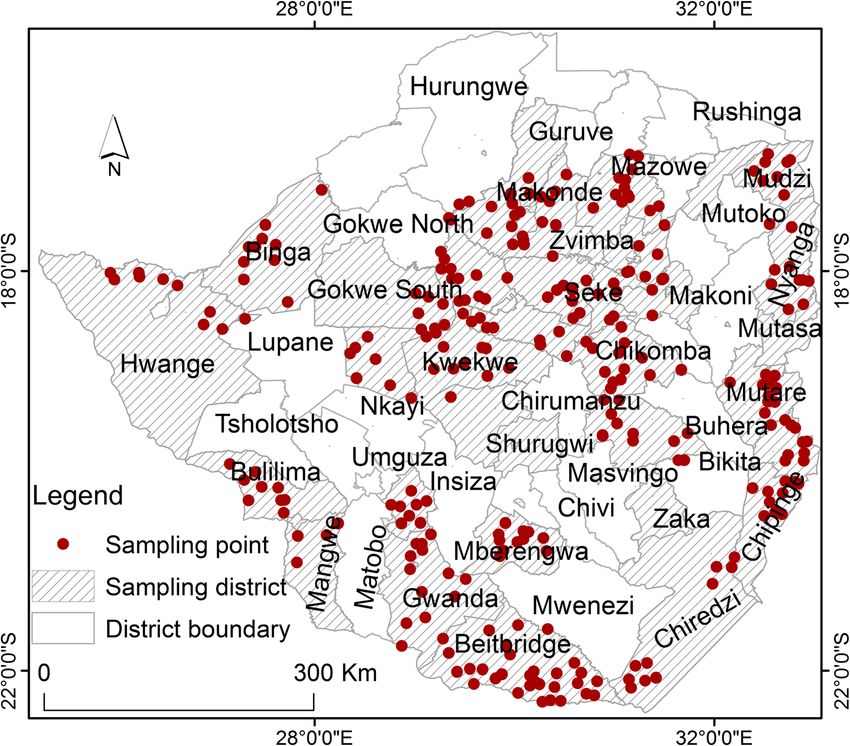
Fig. 4 Location of sampling points within the 27 districts (Map designed and produced by the authors). The figure illustrates the sampling points
within the 27 sampled districts of Zimbabwe
highest in the eastern parts of the country (> 2500 m December 2011 and April 2012 at 303 dip tanks in the
above mean sea level) and lowest in the southern and farming (non-urban) districts of country, with at least 10
northern parts of the country where it reaches less than dip tanks being selected from each district (Fig. 4).
300 m a.s.l. The climate is characterised by three main Stratified random sampling was applied in the selection
seasons i.e., 1) cool dry season from May to August, 2) of sample districts with agro-ecological regions used as
hot and dry season between August and October and a the stratum. Thereafter, a minimum of 10 dip tanks
hot and wet season stretching from November to April were randomly selected within each of the selected dis-
[24]. On a temporal scale, temperatures in the country tricts. Half of the farming districts [26] with 303 dip
range from an average low of ~ 15 °C July to around tanks were finally selected for sampling taking into ac-
24 °C in November. There is a discernible spatial dimen- count accessibility as well as resource availability (Fig. 4).
sion in temperature moderated by altitude where the During the survey, trained veterinary personnel collected
eastern highlands experience the lowest mean annual the ticks from one side of the cattle host using forceps.
temperature of 18 °C while the northern and southern Ticks from the ear canal were collected by scrapping the
low lying areas experience the highest temperatures of canal using a curratte, and thereafter the ticks were
around 23 °C. Rainfall ranges from an annual average of placed in 70% ethanol before being taken to the Central
less than 400 mm in the western and southern parts of Veterinary Laboratory, Harare. Morphological identifica-
the country to > 1500 mm in the Eastern highlands [25]. tion to species level was carried out by trained veterinar-
ians using standard taxonomic keys [26, 27] with the aid
Data sources of a standard stereomicroscope. Specifically, the keys
Tick species data provide a description of morphological attributes such as
In this study, spatially referenced data of fourteen [14] body shape, size and texture that are used for tick spe-
tick species were obtained from the Epidemiology Unit cies identification through visual matching of specimens
of the Division of Veterinary Field Services. The data to drawings or pictures using a dissecting microscope
were from a national survey carried out between among other techniques of species identification.Shekede et al. BMC Veterinary Research (2021) 17:91 Page 8 of 9
Data analysis the method such as the problem of multiple testing and
Hotspot analysis decision criteria (as to whether an area is a hotspot or
The Getis Gi* statistic [28, 29] was used to test whether not), the technique has been successfully used to detect
the distribution of each of the fourteen tick species sig- hotspots in different geographic areas [35–37].
nificantly cluster in space across Zimbabwe.
The Getis Gi* statistic is calculated using the following Acknowledgements
The authors would want to thank the Epidemiology Unit of the Division of
formula: Veterinary Field Services for providing the data used in this study.
P
j Wij ðd Þxj − Wix
Gi ð d Þ ¼
Authors’ contributions
f½ðnS liÞ − W i 2 =ðn − 1Þg MDS and SMC conceived and designed the study. MS collected the data.
s 1=2 MDS, SMC, IG, SK analyzed data and wrote the paper. ANM and DNN
contributed towards data interpretation and writing of the paper. All authors
where. have read and approved the final manuscript.
Wij (d) is a spatial weight vector with values for all
cells ‘j’ within distance d of target cell i, Wi * is the sum Authors’ information
MDS, IG, SK, ANM are lecturers in the Department of Geography Geospatial
of weights, S*li is the sum of squared weights and s* is Sciences and Earth Observation while SMC and DNN are lecturers in the
the standard deviation of the data in the cells. Department of Clinical Veterinary Studies, Faculty of Veterinary Science, and
University of Zimbabwe. MS is an Epidemiologist in the Department of
The Getis-Ord Gi* is a spatial statistical method avail-
Livestock and Veterinary Services, Harare, Zimbabwe.
able with optimized hotspot analysis function in ArcGIS
10.2 [30]. Three confidence interval (CI) levels (90, 95, Funding
and 99%) were used, and higher confidence levels imply No funding was provided for this research.
intense aggregation of hotspots or coldspots in the oc-
Availability of data and materials
currence of ticks [31]. The Gi* statistic was implemented The datasets used and/or analysed during the current study are available
through comparing the abundance of a particular tick from the corresponding author on reasonable request.
species at a particular location in relation to the abun-
dance of the same species in the surrounding points. Ethics approval and consent to participate
Applicable guidelines on care and use of animals were followed. Because the
Specifically, the Gi* statistic was implemented in a GIS study did not involve experimenting with animals, only verbal consent from
environment by first computing the local sum of the ob- the livestock owners was sought. No administrative permissions were
served number of ticks of a given species at a given point required to access the raw data from the Epidemiology Unit of the Division
of Veterinary Field Services as one of the co-authors from the institution was
and its neighbouring points before proportionally com- responsible for the data collection.
paring these to the sum of all ticks of the same species
observed in the study area [32]. Next the difference be- Consent for publication
tween local sum and the expected local sum under the Not applicable.
null hypothesis of complete spatial randomness was cal-
Competing interests
culated to yield a statistically significant Z-score. When The authors declare that they have no competing interests.
the difference between the two is too large to be a result
of chance then the area is designated as a hotspot [28, Author details
1
Department of Geography Geospatial Sciences and Earth Observation,
29, 33]. The result of Getis-Ord Gi* analysis is a Z-score Faculty of Science, University of Zimbabwe, MP167 Mount Pleasant, Harare,
where if the Z score is positive and significant, then an Zimbabwe. 2Department of Clinical Veterinary Studies, Faculty of Veterinary
area is characterised by a relatively high occurrence of Science, University of Zimbabwe, MP167 Mount Pleasant, Harare, Zimbabwe.
3
Department of Livestock and Veterinary Services, 18 Borrowdale Rd, Harare,
ticks (hotspot). In contrast, if the Z-score is negative and Zimbabwe.
significant, it indicates a coldspot (Ord and Getis, 1995,
2001). Thus, clustering refers to higher number of ob- Received: 18 July 2019 Accepted: 8 February 2021
served tick species than would be expected by chance in
space (hotspots) or fewer than expected tick cases (cold- References
spots) [34]. Areas with Z scores > 1.96 were considered 1. Walker A, Bouattour A, Camicas J, Estrada-Peña A, Horak I, Latif A, et al. Ticks
as significant at 99% confidence level (p < 0.01), and clas- of domestic animals in Africa: a guide to identification of species.
Edinburgh: University of Edinburgh; 2014.
sified as hotspots while areas characterised by Z-scores 2. Yu Z, Wang H, Wang T, Sun W, Yang X, Liu J. Tick-borne pathogens and the
ofShekede et al. BMC Veterinary Research (2021) 17:91 Page 9 of 9
5. Mcleod R, Kristjanson P. Economic impact of ticks and tick-borne diseases to 31. Getis OJK. A local spatial autocorrelation statistics: distributional issues and
livestock in Africa, Asia and Australia. InternatiionalLivestock Research an application. Geogr Anal. 1995;27:286–306.
Institut: Naurobi; 1999. 32. Prasannakumar V, Vijith H, Charutha R, Geetha N. Spatio-temporal clustering
6. Norval RA, Perry DB, Young AS. The epidemiology of Theileriosis in Africa. of road accidents: GIS based analysis and assessment. Procedia Soc Behav
New York: Academic Press; 1992. Sci. 2011;21:317–25.
7. Sungirai M, Moyo DZ, De Clercq P, Madder M. Communal farmers’ 33. Getis A, Aldstadt J. Constructing the spatial weights matrix using a local
perceptions of tick-borne diseases affecting cattle and investigation of tick statistic. Geogr Anal. 2004;36(2):90–104.
control methods practiced in Zimbabwe. Ticks Tick-borne Dis. 2016;7(1):1–9. 34. Jacquez GM. Cluster morphology analysis. Spatial and Spatio-Temporal
8. Yamada I, Rogerson PA, Lee G. GeoSurveillance: a GIS-based system for the Epidemiology. 2009;1(1):19–29.
detection and monitoring of spatial clusters. J Geogr Syst. 2009;11(2):155–73. 35. Kamuliwo M, Chanda E, Haque U, Mwanza-Ingwe M, Sikaala C, Katebe-
9. Colborne J. The life cycle of Rhipicephalus lunulatus Neumann, 1907 Sakala C, et al. The changing burden of malaria and association with vector
(Acarina:Ixodidae) under laboratory conditions, with notes on its ecology in control interventions in Zambia using district-level surveillance data, 2006–
Zimbabwe. Experimental Appl Acarol. 1985;1(4):317–25. 2011. Malaria J. 2013;12(437).
10. Chikerema SM, Gwitira I, Murwira A, Pfukenyi DM, Matope G. Comparison of 36. Dhimal M, O’Hara RB, Karki R, Thakur GD, Kuch U, Ahrens B. Spatio-temporal
GARP and Maxent in modelling the geographic distribution of bacillus distribution of malaria and its association with climatic factors and vector-
anthracis in Zimbabwe. Zimb Vet J. 2017;35(1):1–6. control interventions in two high-risk districts of Nepal. Malaria Journal.
11. Nene V, Kiaraa H, Lacastaa A, Pellea R, Svitek R, Steinaa L. The biology of 2014;13(457):1–15.
Theileria parva and control of East Coast fever-Currentstatus and future 37. Hardy A, Mageni Z, Dongus S, Killeen G, Macklin MG, Majambare S, et al.
trends. Ticks Tick-borne Dis. 2016;7(4):549–64. Mapping hotspots of malaria transmission from pre-existing hydrology,
12. Gadzirayi C, Mutandwa E, Mwale M, Chindundu T. Utilization of Tephrosia geology and geomorphology data in the pre-elimination context of
vogelii in controlling ticks in dairy cows by small-scale commercial farmers Zanzibar, United Republic of Tanzania. Parasites Vectors. 2015;8(41):1-15.
in Zimbabwe. Afr J Biotechnol. 2009;8(17):4134–6.
13. Chamboko T, Mukhebi A, Callaghan C, Peter T, Kruska R, Medley G, et al. The
control of heartwater on large-scale commercial and smallholder farms in
Publisher’s Note
Springer Nature remains neutral with regard to jurisdictional claims in
Zimbabwe. Prev Vet Med. 1999;39(3):191–210.
published maps and institutional affiliations.
14. Winskill P, Rowland M, Mtove G, Malima RC, Kirby MJ. Malaria risk factors in
north-East Tanzania. Malar J. 2011;10(98):1–7.
15. Ndhlovu DN, Masika PJ. Bovine dermatophilosis: awareness, perceptions and
attitudes in the small-holder sector of north-West Zimbabwe.
Onderstepoort J Vet Res. 2016;83(1):1–7.
16. Kelly PJ, Mason P, Manning T, Slater S. Role of cattle in the epidemiology of
tick-bite fever in Zimbabwe. J Clin Microbiol. 1991;29(2):256–9.
17. Ndhlovu F, Ndhlovu DN, Chikerema SM, Masocha M, Nyagura M, Pfukenyi
DM. Spatiotemporal patterns of clinical bovine dermatophilosis in
Zimbabwe 1995–2014. Onderstepoort J Vet Res. 2017;84(1):a1386.
18. Keesing F, Ostfeld RS. The tick project: testing environmental methods of
preventing tick-borne. Trends Parasitol. 2018;34(6):447–50.
19. Swiswa S, Masocha M, Pfukenyi DM, Dhliwayo S, Chikerema SM. Long-term
changes in the spatial distribution of lumpy skin disease hotspots in
Zimbabwe. Tropical Animal Health Production. 2017;49:195–9.
20. Barro AS, Kracalik IT, Malania L, Tsertsvadze N, Manvelyan J, Imnadze P,
Blackburn JK. Identifying hotspots of human anthrax transmission using
three local clustering techniques. Appl Geogr. 2015;60:29–36.
21. Norval RAI, Perry BD, Meltzer MI. Factors affecting the distributions of the
ticks Amblyomma hebraeum and A. variegatum in Zimbabwe: implications
of reduced acaricide usage. Exp Appl Acarol. 1994;18(383). https://doi.org/1
0.1007/BF00051522.
22. Cook AJC. Communal farmers and tick control-a field study in Zimbabwe.
Trop Anim Health Prod. 1991;23:161–6.
23. Sungirai M, Abatih EN, Moyo DZ, CLERCQ PD, Madder M. Shifts in the
distribution of ixodid ticks parasitizing cattle in Z imbabwe. Med Vet
Entomol. 2017;31(1):78–87.
24. Shoko C, Dube T, Sibanda M, Adelabu S. Applying the surface energy
balance system (SEBS) remote sensing model to estimate spatial variations
in evapotranspiration in southern Zimbabwe. Trans Royal Soc South Africa.
2015;70(1):47–55.
25. Gwitira I, Murwira A, Zengeya FM, Shekede MD. Application of GIS to
predict malaria hotspots based on Anopheles arabiensis habitat suitability in
southern Africa. Int J Appl Earth Obs Geoinformation. 2018;64:12–21.
26. Walker AR, Bouattour A, Camicas L, Estrada-Pena A, Horak IG, Latif AA, et al.
Ticks of domestic animals in Africa: a guide to identification of species.
Edinburgh Bioscience Reports; 2003.
27. Walker JB, Keirans JE, Horak IG. The genusRhipicephalus (Acari, Ixodidae): a
guide to the brownticks of the world. Cambridge: Cambridge University
Press; 2000.
28. Getis A, Ord JK. The analysis of spatial association by use of distance
statistics. Geogr Anal. 1992;24(3):189–206.
29. Ord JK, Getis A. Local spatial autocorrelation statistics: distributional issues
and an application. Geogr Anal. 1995;27(4):286–306.
30. ESRI. ArcGIS desktop: release 10.3. Environmental Systems Research Institute:
Redlands CA; 2011.You can also read