Spatial stratification and socio-spatial inequalities: the case of Seoul and Busan in South Korea - Nature
←
→
Page content transcription
If your browser does not render page correctly, please read the page content below
ARTICLE
                  https://doi.org/10.1057/s41599-022-01035-5              OPEN

                  Spatial stratification and socio-spatial inequalities:
                  the case of Seoul and Busan in South Korea
                  Seungwoo Han              1✉

                  This study approaches the spatial stratification phenomenon through a data-based social
                  stratification approach. In addition, by applying a dissimilarity-based clustering algorithm, this
1234567890():,;

                  study analyzes how regions cluster as well as their disparities, thereby analyzing socio-spatial
                  inequalities. Ultimately, through map visualization, this study seeks to visually identify spatial
                  forms of social inequality and gain insight into the social structure for policy implications. The
                  results determine how the regions are socioeconomically structured and identify the social
                  inequalities between the spaces.

                  1 Rutgers   University, Newark, NJ, USA. ✉email: seungwoo.han@rutgers.edu

                  HUMANITIES AND SOCIAL SCIENCES COMMUNICATIONS | (2022)9:23 | https://doi.org/10.1057/s41599-022-01035-5   1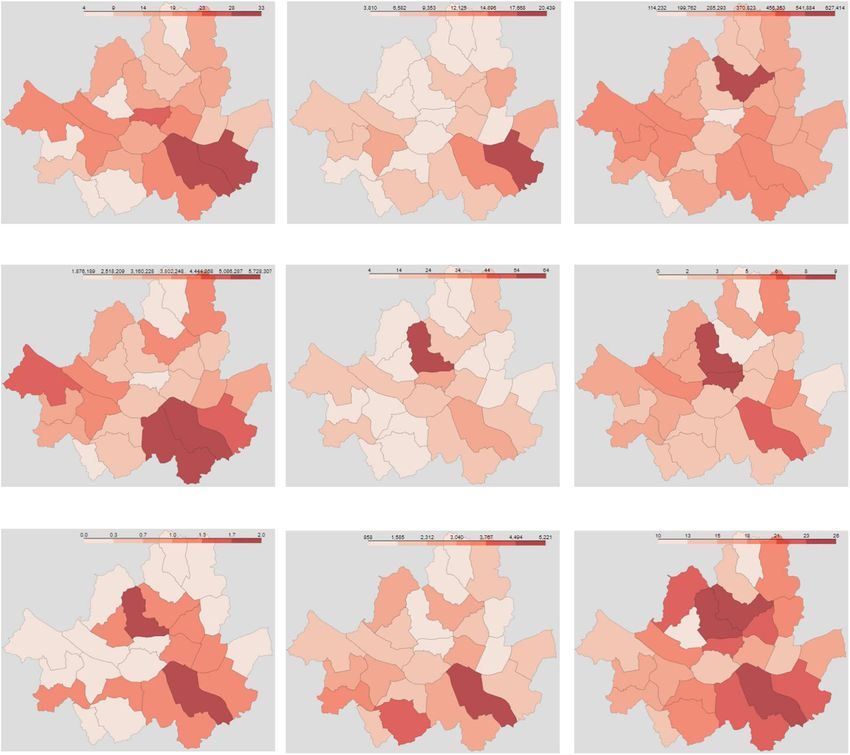
ARTICLE                                 HUMANITIES AND SOCIAL SCIENCES COMMUNICATIONS | https://doi.org/10.1057/s41599-022-01035-5

A
Introduction
         s social inequality worsens worldwide, its manifestation in       Socio-spatial Inequality
         complex urban environments has become a key issue in              The spatial organization of urban inequality. Many studies
         policy research. Many studies on urban inequality have            heavily rely on income data to identify spatial inequality even
attempted to measure inequality by combining the level of the              though it is widely acknowledged that inequality is a multifaceted
economy, income, education, public service, and life expectancy            phenomenon affecting human activities across various fields (Sen,
(Alkire et al., 2011; Lee and Rodrı´guez-Pose, 2013; Panori and            1992). Besides income, studies to look at the socioeconomic
Psycharis, 2017; Lelo et al., 2019). Other studies use non-material        structure of a specific space have focused on occupation, housing,
factors such as the perception of quality and happiness of life            and education (Jung et al., 2014; Kernan and Bruce, 1972; Hen-
(Senlier et al., 2008; Ballas, 2013; Okulicz-Kozaryn, 2013). In the        ning and Liao, 2013; Sohn and Oh, 2019). They certainly help to
wider context of overall social inequality in regard to space,             understand the socioeconomic structure of space, but they do not
however, we need to develop a better understanding of the                  show the process by which inequality is (re)produced. Urban
mechanisms that shape socio-spatial inequality. In order to                inequality is multidimensional and highly complex. Multi-
analyze the spatial patterns of social inequality, this study focuses      dimensional analysis of space provides a different perspective on
on the opportunities and benefits coming from space and mea-                its socioeconomic structure (Hacker et al., 2013; Lelo et al., 2019;
sures spatial stratification by analyzing the multifaceted factors          Lin et al., 2015; Nijman and Wei, 2020; Spector, 1982; Zambon
that create disparities among spaces.                                      et al., 2017).
   The objectives of this study are twofold. The first is a metho-             The central theme of this study of socio-spatial inequality is the
dological discussion of perspectives, approaches, and data to              spatial organization of urban inequality. This study argues that
measure spatial stratification by applying data-driven methods.             the spatial arrangement of economic and service facilities and
The other is the application of this approach to understanding             classes helps us understand how space is structured socio-
socio-spatial inequalities due to spatial stratification in South           economically. First, socio-spatial inequality is derived from the
Korea. This study covers Seoul Special City (hereinafter referred          spatial arrangement of economic and service facilities related to
to as Seoul), the capital city of South Korea, and Busan Metro-            the lives of residents in a city. George (1973) attempted to
politan City (hereinafter referred to as Busan), the second-largest        determine why poverty and inequality have not ended despite the
city in South Korea. The units of analysis are the district (gu) and       progress of society. He found the answer in land. According to his
county (gun) to which the two cities belong.                               claims, progress is beneficial to humanity and also increases the
   The inequality referred to in this study is social inequality.          value of the land, so the amount of rent that the landlord can
Social inequality refers to a state in which factors affecting human       demand those who need to use the land also increases. The
activities across various fields, such as opportunities, resources,         landlord monopolizes the fruit of growth because the price of
and power, are unfairly distributed (Sen, 1992). Socio-spatial             land and the rent charged for using it increase faster than the
inequality, then, refers to a state in which significant disparities        increasing wealth to pay that rent. In other words, inequality
are created because they are not evenly distributed across dif-            intensifies as landowners become increasingly able to monopolize
ferent spaces, which means that social inequalities are manifested         the surplus arising from economic growth.
in spatial patterns. It proposes that socio-spatial inequalities can          When we speak of land, we refer not to soil and stone but to a
be identified by measuring spatial stratification.                           specific location. Due to the increase in population and settlement
   The approach to spatial stratification in this study is based on         activities following the progress of society, the scarcity of land
understanding social stratification via data-driven methods. As a           becomes greater, so the value of land is determined by the
research method for clustering regions and analyzing disparities,          location. To put this in terms of modern society, the primary role
this study proposes the K-means ++ clustering algorithm, which             of land for individuals in contemporary society is the role of
is a dissimilarity-based (distance-based) clustering method from a         housing owned by individuals. Housing provides social benefits
problem-centric perspective of spatial stratification and socio-            and opportunities beyond the purpose of residence. Facilities
spatial inequalities.                                                      occupy discrete locations, and the friction of distance means that
   This study presents interpretable clustering results through a          some people in certain places will find it easier than others to
combination of a clustering algorithm and map visualization for            obtain opportunities, benefits, and various sources of need
policy implications. In the study of socio-spatial inequalities in         satisfaction (Smith, 1984). Individual behavior is affected by
urban spaces, the approaches using map visualization enable the            spatial structure (Horton and Reynolds, 1971). The residential
spatial analysis of urban inequalities to visually identify spatial        location carries with it not only a particular quality of living
forms of inequalities, gain deeper insight into social structure and       environment but also a set of advantages and disadvantages
the processes that generate inequalities (de la Espriella, 2009; Soja,     arising from accessibility to sources of benefits and opportunities
2010; Siqueira-Gay et al., 2019; Lelo et al., 2019; Sohn and Oh,           (Su et al., 2019). Disadvantages arising from lack of accessibility
2019; McLachlan and Norman, 2020; Shi and Dorling, 2020). The              to sources of benefits and opportunities might affect economic
results of this analysis can be used as a foundation in policy             performance, which might reproduce inequality (Rawls, 1971;
discussions related to urban and regional inequalities and this            Roemer, 1998; Lamont and Fourier, 1992; Thobecke and
study seeks to find implications through this approach.                     Charumilind, 2002; Mustard and Ostendorf, 2005; van Kempen,
   In a study on data-based social stratification, it is crucial to         2005; McDowell et al., 2006). In other words, the key to socio-
choose which indicators meet the research objective. This study            spatial inequality in this study is the socio-spatial inequality of
proposes that data reflecting the multifaceted characteristics of           opportunities and benefits.
spaces have a certain pattern to measure spatial stratification.               Second, the socio-spatial inequality of opportunities and
This study uses data, which reflect country-specific character-              benefits stems from spatial exclusivity. This exclusivity is closely
istics, provided by 15 public institutions in South Korea for its          related to the traits of the positional good discussed by Veblen
analysis. In addition, this study applies data transformations that        (1994) in that the location of a particular region represents the
can effectively maximize similarity and dissimilarity to optimally         class of the individuals residing there. People pay more for houses
cluster regions based on the dissimilarity-based clustering                in locations that are coveted in terms of social status, and they are
method. As tools for analysis, this study used Python 3.7 and              willing to bear it even if they account for more of their assets. As a
Scikit-learn 0.22.2.                                                       result, higher barriers to entry are built up, and those who do not

2                          HUMANITIES AND SOCIAL SCIENCES COMMUNICATIONS | (2022)9:23 | https://doi.org/10.1057/s41599-022-01035-5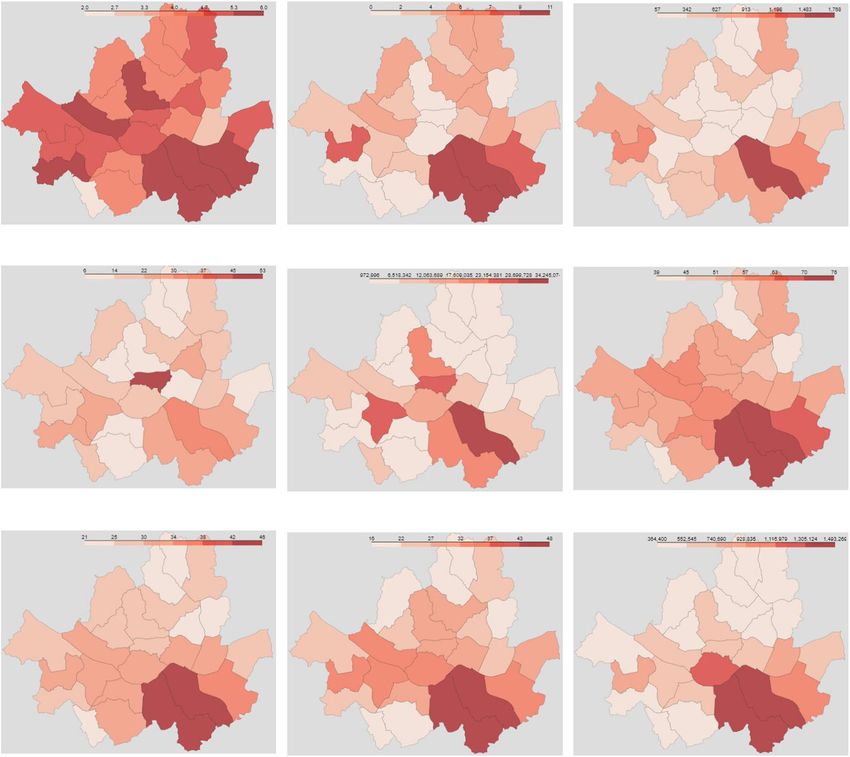
HUMANITIES AND SOCIAL SCIENCES COMMUNICATIONS | https://doi.org/10.1057/s41599-022-01035-5                                         ARTICLE

belong are excluded from the benefits and opportunities of the                (Monroe et al., 2015). People live by building complex dynamics
region.                                                                      of life inside and outside each spatial unit. The spatial units of
   In social science studies, class is an essential factor in                various lives contain each way of life and relationship. The spatial
explaining society’s various dynamics and phenomena regarding                units are created by human beings as the main subject through
inequality, from classical discussions about the class such as Marx          social relations, but at the same time, society also creates spatial
(1977) to Piketty (2014, 2020), who discusses class in terms of the          units through institutional or relational networks. As such, the
present time. The distribution of class shows the socioeconomic              dynamics of confrontation and rejection as well as connection
structure of society (Reich, 1991; Atkinson, 2006, 2008; Sohn and            and bonding are laid between each unit space. If the social stra-
Oh, 2019). Class and social strata exist in any form, regardless of          tification phenomenon reflects people’s social relations, the spa-
age and place, and inevitably, the accompanying inequality is a              tial stratification phenomenon reveals these social relations as
byproduct of their dynamics (Pekkanen et al., 1995; Chan and                 spatial divisions. Accordingly, this study proposes that the mul-
Goldthorpe, 2007; Kingstone, 2000; Wright, 2005; Grusky, 2014;               tidimensional data reflecting social relationships have a certain
Piketty, 2020). If inequality exists in any form and social relations        pattern by which to measure spatial stratification. Table A1 of
between people are perceived as non-horizontal by any standard,              Appendix A summarizes the geographical scope, methods, indi-
class and social strata can be useful tools for analyzing socio-             cators, and findings of past publications of applied clustering.
spatial inequality.

                                                                             Dissimilarity-based clustering methods. Previous studies have
The Korean context. In South Korea, phrases that represent
                                                                             generally applied one or two certain clustering algorithms for
specific spaces, such as the metropolitan area versus rural pro-
                                                                             analysis (see Table A1 of Appendix A). However, there is no
vinces, in-Seoul versus out-of-Seoul, and Gangnam1 versus
                                                                             foundation in statistical theory or clear criteria for which clus-
Gangbuk reflect individuals’ identity, social status, and economic
                                                                             tering algorithm is preferable (Venables and Ripley, 2002; Ahl-
class (Kang, 1991; Park and Jang, 2020; Yang, 2018). Phrases that
                                                                             quist and Breunig, 2012; Hennig, 2015). There are a number of
define regions in specific ways mean that spatially, social classes
                                                                             clustering algorithms, and, often, different methods produce
are rigidly separated and the opportunities available to individuals
                                                                             different outcomes without sound reasons for choosing a parti-
vary depending on where they live. Whether an individual lives in
                                                                             cular method over another. Therefore, in selecting a clustering
a metropolitan area, in a rural area, or in Gangnam within Seoul,
                                                                             algorithm, it is difficult to clearly explain which is preferable and
affects one’s life in South Korean society in many ways. Inequality
                                                                             how many clusters are ideal. In a number of studies applying
can be structurally reproduced and social mobility becomes rigid
                                                                             clustering algorithms, the reason for selecting a specific clustering
if a certain group of people living in a certain area monopolizes
                                                                             algorithm is not clearly presented or discussed (Ahlquist and
opportunities, or if some people are spatially excluded from
                                                                             Breunig, 2012; von Luxburg et al., 2012).
opportunities provided by society (Soja, 2010).
                                                                                This study does not aim to compare each result by applying
   Previous literature on the regional inequality of South Korea
                                                                             various clustering algorithms. To determine which clustering
mainly dealt with the economic gap between metropolitan and
                                                                             method is preferred and suitable for clustering, the current study
rural areas (Kim et al., 2003; Kim and Jeong, 2003; Noh, 2006;
                                                                             takes an approach in which the researcher determines the
Oh, 2017). On the other hand, the core of structural inequality in
                                                                             clustering algorithm to be applied in accordance with the
South Korea can be captured through the analysis of Seoul and
                                                                             objective and context of the research as well as the characteristics
Busan in that multifaceted inequality factors are concentrated in
                                                                             of the data (von Luxburg et al., 2012; Henning and Liao, 2013;
the space of these two representative cities in South Korea. As
                                                                             Henning, 2015). Therefore, the current study is based on the
cities increase in size, diversity also increases and reveals the
                                                                             data-driven approach rather than the model-driven approach.
overall social structure of society (Shevky and Bell, 1955;
                                                                                Each region within the urban space is unique, so the regional
Duranton and Puga, 2000). As of 2020, Seoul’s population is
                                                                             characteristics of each region are different (Harvey, 1989). At the
about 9.8 million, accounting for about 18.8% of the total
                                                                             same time, however, certain regions share unique features based
population of South Korea (about 51.84 million), and Busan’s
                                                                             on specific values. Current study proposes a dissimilarity-based
population is ~3.5 million, accounting for about 6.6% of the total
                                                                             clustering method by focusing on this similarity and dissimilarity
population of South Korea;2 taken together, the two constitute
                                                                             as reflected in data in order to measure spatial stratification. As
more than ¼ of South Korea’s total population. Accordingly,
                                                                             discussed in the previous section, this study proposes that
urban inequality in Seoul and Busan is not limited to the urban
                                                                             multifaceted data have a certain pattern that can be utilized to
space but, rather, can show the overall structure of regional
                                                                             measure spatial stratification. According to this data-based social
inequality in South Korean society.
                                                                             stratification approach, structural patterns can be elucidated. This
   According to the Global Power City Index (GPCI), Seoul is
                                                                             study seeks to uncover them based on the similarity and
ranked 8th3 and according to the Global Cities Index (GCI), Seoul
                                                                             dissimilarity among observations. Accordingly, this study applies
is ranked 17th among global cities in 2021.4 In terms of container
                                                                             the K-means++ clustering algorithm, an approach to clustering
traffic per annum, Busan is ranked 6th in the world and is
                                                                             based on Euclidean distance (see Appendix B).
considered one of the key cities for port logistics in 2021.5
                                                                                In addition to K-means++, there are clustering algorithms of
Therefore, socio-spatial inequalities within the two cities, which
                                                                             various approaches, such as hierarchical clustering and density-
play a key role socially and economically and are closely linked to
                                                                             based spatial clustering with noise (DBSCAN). Hierarchical
the global economy, can be understood as a form of inequality in
                                                                             clustering has the advantage that it can determine the number of
the global city.
                                                                             clusters by searching all potential clusters through a hierarchical
                                                                             tree structure (Murphy, 2012; Johnstone et al., 2019; Wu et al.,
Research design                                                              2020). In hierarchical clustering, clusters have a tree-like structure
Data-based social stratification approach. The approach to                    or a parent–child relationship. Here, the two most similar clusters
spatial stratification in this study is based on measuring social             are joined together, and all of the clusters are continuously
stratification through data-driven methods. Data reflect human                 combined until they form a single cluster. DBSCAN is a density-
behaviors and interactions, such as how people communicate,                  based clustering method that is a non-parametric approach
how they form relationships, and how conflicts arise in society               suitable for applications where clusters cannot be well described

HUMANITIES AND SOCIAL SCIENCES COMMUNICATIONS | (2022)9:23 | https://doi.org/10.1057/s41599-022-01035-5                                          3
ARTICLE                                 HUMANITIES AND SOCIAL SCIENCES COMMUNICATIONS | https://doi.org/10.1057/s41599-022-01035-5

as distinct groups of low within-cluster dissimilarity, as, for               In modern society, public transportation plays a role in
instance, in spatial data, where clusters of points in the space may       distributing opportunities to people through mobility (Social
form along natural and artificial structures, such as rivers, valleys,      Exclusion Unit, 2003; Lucas, 2012; Chen et al., 2018; Pizzol et al.,
buildings, etc. (Grubesic et al., 2014; Henning, 2015; Johnstone           2021). Among the various means of public transport, in South
et al., 2019; Wu et al., 2020). The objective of this study is not to      Korea, the subway is considered the most essential for urban
connect objects hierarchically to multiple clusters but to directly        transportation (Im and Hong, 2017). According to the Seoul
optimize certain characteristics and categorize each object into           Metropolitan Government, the average number of subway
exactly one cluster. In addition, this study’s data do not require a       passengers per day is over 5 million, surpassing other modes of
density-based method because geographic characteristics are not            public transportation.6 In South Korea, the area around a subway
included.                                                                  station is called a “subway station influence area”, and
                                                                           considering the fact that commercial areas, businesses, and public
                                                                           institutions are located and various social and economic activities
K-means++. K-means++ is one of the clustering algorithms
                                                                           take place near subway stations, subway stations are more
developed from K-means, and the principle of clustering is the
                                                                           important than being merely a means of transportation in various
same except for the initialization of the cluster center. K-means is
                                                                           ways. In addition, considering the direct and indirect effects of
a clustering technique that selects a cluster center called a cen-
                                                                           the transportation infrastructure on the region and the parking
troid and then selects the data points closest to it (Arthur and
                                                                           problems in Korean metropolitan areas, public investment in
Vassilvitskii, 2007; Hastie et al., 2009; Murphy, 2012) (see
                                                                           roads and public parking spaces are also essential factors for
Appendix C).
                                                                           residents (Talley, 1996; Yi et al., 2012; Ahn et al., 2014).
   The main disadvantage of K-means is that the initial locations
                                                                              Cultural facilities such as public libraries, museums, and art
of centroids are arbitrarily selected. This initial arbitrary selection
                                                                           galleries form cultural capital and are essential elements affecting
of centroids often fails to form optimal clusters. K-means++ is
                                                                           the quality of life, vitality, and performance of individuals
the clustering algorithm proposed to address this drawback of K-
                                                                           (Andersen and Hansen, 2012). In South Korea, cultural facilities
means (Arthur and Vassilvitskii, 2007; Bonaccorso, 2018). It
                                                                           have essential meanings in terms of quality of life, regional
specifies a procedure to initialize centroids before moving forward
                                                                           vitality, and the competitiveness of residents (Kim, 2007; Park
with the standard K-means clustering algorithm.
                                                                           et al., 2015). There has been continuous discussion regarding the
   K-means performs the clustering process by initially arranging
                                                                           disparities in accessibility to such facilities. In addition, access to a
random centroids. In contrast, K-means++ selects one of the
                                                                           movie theater is one of the key factors in increasing the overall
data points as the first centroid, rather than beginning with K
                                                                           level of cultural activities in a region. In South Korea, the
points in arbitrary spaces. It then selects the next centroid from
                                                                           multiplex cinemas, which account for more than 90% of total
the data points such that the probability of choosing a point as a
                                                                           cinemas,7 provide the concept of a comprehensive leisure facility
centroid is directly proportional to its distance from the nearest,
                                                                           that can be enjoyed not only for movies but also for other leisure
previously chosen centroid (Arthur and Vassilvitskii, 2007).
                                                                           activities (Kang, 2016).
Simply put, a data point placed as far as possible from the already
                                                                              In the case of medical care, in South Korean society, there are
designated centroid is designated as the next centroid. This
                                                                           health inequalities within and between regions (Choi et al., 2011;
process is repeated until K centroids have been sampled. In other
                                                                           Hong and Ahn, 2011). In particular, tertiary hospitals occupy an
words, initial centroids are placed more strategically rather than
                                                                           important position such that the unique term “tertiary hospital
randomly selected in the centroid selection. Except for this initial
                                                                           influence area” was necessitated (Kang, 2014). There has been
procedure, the rest of the clustering process is the same as K-
                                                                           continuous social debate on patients’ inclination toward the top
means. The approach of K-means++ to initial centroid selection
                                                                           five tertiary hospitals located in Seoul. Considering the high
can cluster objects more optimally and improve the algorithm’s
                                                                           medical service level of tertiary hospitals, residents can enjoy high
convergence speed.
                                                                           levels of benefits (Yang et al., 2020). Safety needs are important
   In K-means++ clustering, the number of clusters K must be
                                                                           factors for residents’ lives in modern society (Cox and Cox, 1996).
specified before clustering. That is, what must be decided here is
                                                                           Regarding the safety of residents in South Korea, there has been
how many clusters K are optimal. Silhouette analysis can be used
                                                                           constant discussion that the utility level for people’s safety differs
to evaluate the separation distance between the resulting clusters
                                                                           depending on accessibility to CCTV, police stations, and
(Kaufman and Rousseeuw, 1990; Bonaccorso, 2018). Efficiently
                                                                           firehouses (Kim, 2014).
clustered means that the distances between different clusters are
                                                                              The distribution of educational opportunities as well as access
sufficiently far apart, and data points in the same clusters are
                                                                           to them has become an important issue in relation to educational
close. The silhouette plot displays a measure of how close each
                                                                           and social equality (Coleman, 1990; Talen, 2001; Zhang and
data point in one cluster is to data points in the neighboring
                                                                           Kanbur, 2005). The concept of equality in educational opportu-
clusters and thus provides a way to assess parameters such as the
                                                                           nities includes the right for students to receive the benefits of a
number of clusters visually (see Appendix D).
                                                                           common curriculum regardless of their social background as well
                                                                           as the right to equal education in the community (Coleman,
Data selection. A critical question for the data-based social              1990). Considering the social phenomena that education is
stratification approach is what indicators to choose. When col-             projected as a desire to increase social status in South Korean
lecting data, it is necessary to have a sufficient understanding of         society as well as of parents’ enthusiasm for their children’s
the society concerned, and data should be available and reliable.          education, the meaning of education is highly significant (Seth,
For the data set that is analyzed here, the focus is on economic           2002; Lee, 2005; Kang, 2008).
and service facilities and socioeconomic class. Data related to the           In South Korea, disparities in educational services among
spatial arrangement of economic and service facilities include             regions are discussed as a serious social problem (Son, 2004; Choi,
data representing the sectors of transportation, culture, safety,          2004; Byun and Kim, 2010; Byun et al., 2012). In particular, the
medical treatment, education, and economy. Class includes data             disparities in the enrollment rates of elite high schools, such as
related to an individual’s socioeconomic level, such as educational        specialized high schools and autonomous private high schools,
background, occupation, income, and wealth (Hollingshead,                  which are advantageous for entering major universities, between
1975; Levy and Michel, 1991; Sohn and Oh, 2019).                           regions are significant. In addition, according to the National

4                          HUMANITIES AND SOCIAL SCIENCES COMMUNICATIONS | (2022)9:23 | https://doi.org/10.1057/s41599-022-01035-5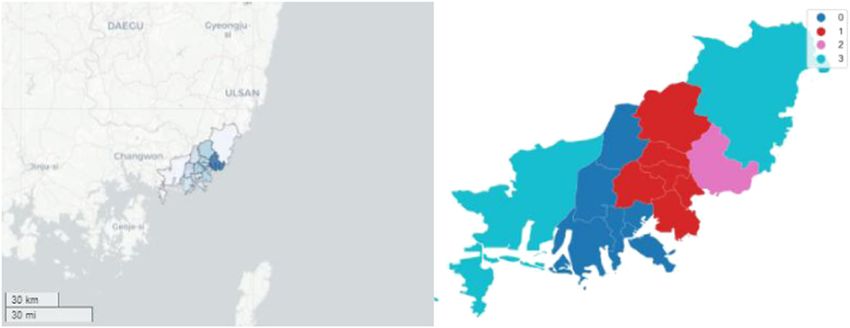
HUMANITIES AND SOCIAL SCIENCES COMMUNICATIONS | https://doi.org/10.1057/s41599-022-01035-5                                                                  ARTICLE

 Table 1 List of variables.

       Category                                Sub-category                Variable
 1     Economic and service                    Transportation              Subway station
 2     facility                                                            Public parking spaces
 3                                                                         Road extension (m)
 4                                                                         Road extent (m2)
 5                                             Culture                     Cultural facility (Public library, Museum, Art gallery, Art center, Local culture center, etc.)
 6                                                                         Theater
 7                                             Medical treatment           Tertiary hospital
 8                                             Safety                      CCTV
 9                                                                         Police station (Police substation, Community security center)
 10                                                                        Firehouse
 11                                            Education                   Enrollment rates of elite high schools
 12                                                                        Private educational institute
 13                                            Economy                     Large-scale stores (Super Super Market (SSM), Department store, Shopping center, Multi-
                                                                           shopping complex, etc.)
 14                                                                        Gross wage and salary (based on the location of withholding agent) (unit: million KRW)
 15    Class                                   Education                   High educational background
 16                                            Occupation                  High professional skill
 17                                            Income                      High income
 18                                            Wealth                      The average price of a condominium (unit: 1000 KRW)

 See Tables E1–E4 in Appendix E for more detailed data and descriptive statistics.

Fig. 1 Transformation log(x + 1).                                                               Fig. 2 Transformation log(x + c).

Statistical Office’s announcement in 2019, 82.5% of elementary                                   background, university (including vocational college) graduation
school students, 69.6% of middle school students, and 58.5% of                                  or above is classified as high, and high school graduation or below
high school students were receiving private education.8 In this                                 is classified as low. Based on the Korean Standard Classification of
respect, the proportion of each district in the city’s total elite high                         Occupations, professional or higher is classified as high, and
school enrollment and the number of private educational                                         others are classified as low for professional skill level. In regard to
institutes are included for the analysis.                                                       income, the fourth quartile is classified as high, and the first
   Local shops are closely related to residents’ demographic                                    quartile is classified as low. The ratio of the working population of
characteristics (Meltzer and Schuetz, 2011). In Korean society,                                 the upper tier to the lower tier in each data is measured based on
large-scale stores, such as super super market (SSM), department                                national census data (KEIS, 2019).
stores, shopping centers, multi-shopping complexes, etc., are                                      This study uses the price of a condominium (called an
factors that affect the residents’ quality of life (Kim and Park,                               apartment in South Korea) as data representing an individual’s
2017). In the case of the regional economy, the district’s gross                                wealth. According to the Korea Housing Survey of the Ministry of
wage and salary based on the withholding agent’s location show                                  Land, Infrastructure and Transport, in Seoul, as of 2018, about
the region’s overall level of economic activity and job opportu-                                42% of households live in condominiums. In Busan, about 53.6%
nities (Chapple, 2007). The high gross wage and salary of a                                     of households live in condominiums.9 In South Korean society,
district imply its economic competitiveness.                                                    the price of condominiums is heavily influenced by the region in
   This study’s data representing class include the level of                                    which they are located and the surrounding living environment,
residents’ education, professional skills, income, and wealth.                                  and this is one of the main factors that characterize the wealth
Educational background, occupation, income, and wealth are                                      and socioeconomic status of an individual (Zchang, 1998; Lee
representative factors of socioeconomic class (Hollingshead, 1975;                              et al., 2002, Choi, 2006; Lee, 2009; Jang and Kang, 2015; Sohn and
Kim et al., 2003; Sohn and Oh, 2019). In terms of educational                                   Oh, 2019). The variables are shown in Table 1.

HUMANITIES AND SOCIAL SCIENCES COMMUNICATIONS | (2022)9:23 | https://doi.org/10.1057/s41599-022-01035-5                                                                      5
ARTICLE                                   HUMANITIES AND SOCIAL SCIENCES COMMUNICATIONS | https://doi.org/10.1057/s41599-022-01035-5

                             Subway                              Parking space                            Road extension

                         Road extent                           Cultural facility                               Theater

                    Tertiary hospital                                 CCTV                                Police station

Fig. 3 Socio-spatial map of Seoul 1.

Data transformations. This study applies data transformations                   The selection of c considering the values of variables is
that can effectively maximize similarity and dissimilarity in order          subjective, and this study takes a method of adding a multiple of
for regions to optimally cluster by applying a dissimilarity-based           10, which is one digit greater than the maximum value. This
clustering algorithm. From a data-intuitive perspective, it may be           makes the distance between small values effective while leaving
meaningful to find a pattern from data without transformations,               the effective distance between high values less affected. Figures 1
but this study considers that it makes more sense to cluster by              and 2 are an example of clustering according to the difference in c
ratios through log transformations rather than relying on absolute           values in the transformation log(x + c). This shows the difference
differences in variable values in that, in terms of social stratifi-          between Fig. 1 the case of applying 1 to c and Fig. 2 this study’s
cation, the interpretive difference between social groups depends            approach when clustering with the average price of a condomi-
on ratios rather than absolute values (Henning and Liao, 2013).              nium and the number of private institutes. The approach of this
In this study, therefore, the log transformations are applied to all         study makes clustering more efficient.
variables except for the ratio variables.
   Since there are 0 s in the data, the transformation log(x+c) is           Clustering results and analysis
appropriate. The strategic consideration in selecting c is that,             Before examining the clustering results, we can briefly analyze the
rather than adding 1 to x uniformly, adding each corresponding c             socio-spatial maps of Seoul and Busan in Figs. 3–6, which deliver
considering the minimum and maximum values of each variable                  multifaceted aspects of the socio-spatial structures in an intuitive
enables more efficient clustering. For example, in the number of              visual manner. In Figs. 3 and 4, we can visually confirm that the
movie theaters in Seoul, the minimum value is 0, and the                     elements constituting transportation, culture, safety, education,
maximum value is 9. In contrast, for gross wage and salary, the              and economy are concentrated in the south of the Han River,
minimum value is 972,996 (unit: 1 million KRW), and the                      Seoul. Looking at the class factors, it can be seen that the cor-
maximum value is 34,245,070 (unit: 1 million KRW). Accord-                   responding factors are very high in the south of Seoul compared
ingly, it is logically appropriate to select c to be applied to the          to other regions.
movie theaters variable and c to be applied to the total gross wage             In terms of accessibility to the facilities for residents, the
and salary variable differently.                                             facilities providing opportunities and benefits are concentrated in

6                            HUMANITIES AND SOCIAL SCIENCES COMMUNICATIONS | (2022)9:23 | https://doi.org/10.1057/s41599-022-01035-5
HUMANITIES AND SOCIAL SCIENCES COMMUNICATIONS | https://doi.org/10.1057/s41599-022-01035-5 ARTICLE
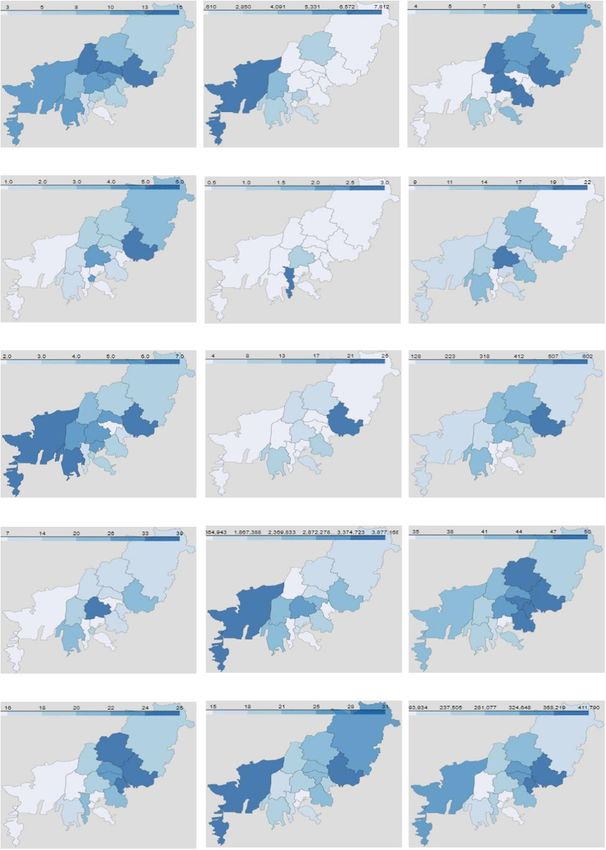
Firehouse Elite high school enrollment Private educational institute
Large scale stores Gross wage & salary High education
High skilled High income Price of condominium
Fig. 4 Socio-spatial map of Seoul 2.
the southern area of Seoul, and highly educated, professional, decreases gradually. Therefore, K = 4 seems to be the most
high-income, and wealthy social classes reside in the area. In the appropriate. First, Fig. 8 shows a map visualization of the clus-
following, we can look at Fig. 5 which briefly shows the socio- tering result for Seoul (K = 2).
spatial structure of Busan. We can see the spatial shape of the result clustered into two
In the case of Busan, compared to Seoul, the concentration of clusters in Fig. 8. The districts included in each of the two clusters
elements constituting transportation, culture, safety, education, in Seoul are shown in Table 2. In the case of Seoul, 22 districts
and economy in a specific region is relatively weak. However, form Cluster 0, and three districts form Cluster 1. That is,
many facilities are still concentrated in the southeast region (East Gangnam, Seocho, and Songpa districts form one cluster, and the
Busan). Gross wage and salary are higher in the west. This may be rest of the districts form the other cluster.
because Busan’s port facilities and related businesses are located The disparities in the mean values between the two clusters can
in the west. In terms of social class, more of highly educated, be clearly distinguished. In all respects, Cluster 1 has over-
professional, high-income, and wealthy social classes reside in the whelming advantages. Considering subway stations, the average
southeast region compared to other regions. number in Cluster 0 is ~12.7, and the average number in Cluster
From the above maps, we can see the socio-spatial structures of 1 is 26.3. In the case of public parking spaces, Cluster 1 has about
the two cities. In the following, we can further understand their twice as many spaces on average. There is relatively little differ-
socio-spatial inequalities by analyzing the clustering results. The ence between the two clusters in terms of road extension, but in
results of the silhouette analysis of Seoul and Busan are shown in the case of the road extent, the difference is ~1.8 times. In the case
Figs. 6 and 7, respectively. In Seoul, when divided into two of cultural facilities, there are about 12 cultural facilities on
clusters (K = 2), the silhouette score is the highest (0.59). On the average in Cluster 0, but in Cluster 1, there are about 21 cultural
other hand, as K increases to three (0.511), four (0.445), five facilities on average. In the case of theaters, there are about 2.7
(0.437), and six (0.415), the silhouette score decreases gradually. theaters on average in Cluster 0, but in Cluster 1, there are about
In the case of Busan, when K = 4, it has the highest silhouette 3.5 theaters on average.
score (0.364). In the case of K = 2 and K = 3, clustering is not In the case of tertiary hospitals, each district of Cluster 1 has at
efficient because there are clusters with negative values, and as K least one, but in Cluster 0, the average number of tertiary hos-
increases to five (0.3) and six (0.255), the silhouette score pitals is less than zero. For safety, Cluster 1 has at least 1.3 times
HUMANITIES AND SOCIAL SCIENCES COMMUNICATIONS | (2022)9:23 | https://doi.org/10.1057/s41599-022-01035-5 7ARTICLE HUMANITIES AND SOCIAL SCIENCES COMMUNICATIONS | https://doi.org/10.1057/s41599-022-01035-5
Subway Parking space Cultural facility
Theater Tertiary hospital Police station
Firehouse Elite high school enrollment Private educational institute
Large scale stores Gross wage & salary High education
High skilled High income Price of condominium
Fig. 5 Socio-spatial map of Busan.
more CCTVs, police stations, and firehouses on average. large-scale stores in Cluster 1 is about 1.8 times higher, and the
Regarding education, the gap between the two regions is con- average gross wage and salary of Cluster 1 are over 4.6 times
siderable. There is a sizable gap between the two clusters in the higher. In terms class, Cluster 1 significantly exceeds Cluster 0 in
enrollment rates of elite high schools and the number of private all areas of education, professional skill, and income. The average
educational institutes. In the economy, the average number of price of a condominium in Cluster 1 is about three times higher
8 HUMANITIES AND SOCIAL SCIENCES COMMUNICATIONS | (2022)9:23 | https://doi.org/10.1057/s41599-022-01035-5HUMANITIES AND SOCIAL SCIENCES COMMUNICATIONS | https://doi.org/10.1057/s41599-022-01035-5 ARTICLE
Fig. 6 Silhouette scores (K = 2–6), Seoul.
Fig. 7 Silhouette scores (K = 2–6), Busan.
Songpa-gu
Gangnam-gu
Seocho-gu
Fig. 8 Map visualization of clustering (K = 2), Seoul.
than that in Cluster 0. Looking at Fig. 8 and Table 3 together, we higher than in other clusters, and the number of public parking
can see the spatial shape of the clusters and the disparities spaces is greater. Regarding the number of cultural facilities, it is
between them. about two times higher than that of other clusters, and the
In Busan’s case, looking at the map visualization in Fig. 9 and number of movie theaters in Cluster 2 is 6–7 times higher than
Table 4 of the clustering result, we can see how the regions form that of others. The number of police stations is similar to that of
clusters and take a spatial shape. When K = 4, the regions Cluster 1, but it is about two times higher than that of others. In
belonging to each cluster are listed in Table 4. From the fol- the case of firehouses, the number is more than twice that of
lowing results, we can see that Haeundae district forms one Cluster 1 (Table 5).
cluster, six districts adjacent to the left of Haeundae form In the case of enrollment rates of elite high schools and the
Cluster 1, and seven districts located on the left form Cluster 0. number of private educational institutes, Cluster 2 greatly exceeds
Gangseo district and Gijang County, located at both ends of other clusters. The number of large-scale stores in Cluster 1 is at
Busan, form Cluster 3. least two to four times higher than the other clusters. Considering
In Busan, the disparities among clusters are not relatively large gross wage and salary, the gap with Cluster 3 is not significant,
compared to in Seoul. However, Cluster 2 (Haeundae district) is but it is about 1.7 times higher than that of Cluster 0. In terms of
superior in most sectors, except for tertiary hospitals. Cluster class, looking at the gaps in education, professional skill, and
2 shows that the number of subway stations is two to three times income, these gaps are not significant, but they clearly exceed
HUMANITIES AND SOCIAL SCIENCES COMMUNICATIONS | (2022)9:23 | https://doi.org/10.1057/s41599-022-01035-5 9ARTICLE HUMANITIES AND SOCIAL SCIENCES COMMUNICATIONS | https://doi.org/10.1057/s41599-022-01035-5
Haeundae-gu
Fig. 9 Map visualization of clustering (K = 4), Busan.
Table 2 Districts by cluster (Seoul).
Cluster Districts (Gus) Numbers
Cluster 0 Dobong, Dongdaemun, Dongjak, Eunpyeong, Gnagbuk, Gangdong, Gangseo, Geumcheon, Guro, Gwanak, Gwangjin, Jongno, 22
Jung, Jungnang, Mapo, Nowon, Seodaemun, Seongbuk, Seongdong, Yangcheon, Yeongdeungpo, Yongsan
Cluster 1 Gangnam, Seocho, Songpa 3
Table 3 Mean value of variable by cluster (Seoul).
Sub-category Variable Cluster 0 Cluster 1
1 Transportation Subway station 12.72 26.32
2 Public parking spaces 6534.79 13717.45
3 Road extension (m) 306,319.4 397,962.4
4 Road extent (m2) 3,086,839 5,408,973
5 Culture Cultural facility 12.48 21.21
6 Theater 2.74 3.58
7 Medical treatment Tertiary hospital 0.31 1.29
8 Safety CCTV 1954.38 2863.44
9 Police station 16.75 22.26
10 Firehouse 4.41 6.00
11 Education Enrollment rate of elite high school 3.17 9.77
12 Private educational institute 311.94 1146.15
13 Economy Large-scale store 15.55 27.03
14 Gross wage and salary (unit: million KRW) 4,255,825 19,541,940
15 Educational background High educational background 52.17 70.32
16 Occupation High professional skill 28.06 42.77
17 Income High income 25.99 43.49
18 Wealth Average price of a condominium (unit: 1000 KRW) 554,130 1,303,537
See Fig. E1 in Appendix E for graphs.
other regions in all these areas. The price of a condominium in Conclusions and implications
Cluster 2 is about twice as high as in Cluster 0. This study has several main findings, based on the methodolo-
In summation, through the analysis of the clustering results, gical discussion that addresses a series of views on the perspec-
we can identify the spatial patterns of social inequality. Certain tives, approaches, and data. In Seoul, the highest average
regions, densely populated by socioeconomically upper-class silhouette score is calculated when divided into two clusters, and
people, offer residents higher levels of benefits and opportu- in Busan, the clustering is most optimal when divided into four
nities than other regions. In conclusion, through these find- clusters. Seoul’s Cluster 1 has advantages over other clusters in all
ings, this study is able to determine how the regions are sectors of economic and service facility, and class. As a result, this
socioeconomically structured spatially and to identify the group’s residents can enjoy higher levels of services of public
social inequalities between the spaces. transportation, safety, medical treatment, culture, education, and
10 HUMANITIES AND SOCIAL SCIENCES COMMUNICATIONS | (2022)9:23 | https://doi.org/10.1057/s41599-022-01035-5HUMANITIES AND SOCIAL SCIENCES COMMUNICATIONS | https://doi.org/10.1057/s41599-022-01035-5 ARTICLE
economic opportunities and benefits compared to other regions. opportunities and resources but cannot capture political
In the case of Busan, Cluster 2 has advantages over other clusters inequality from a spatial aspect. In addition, although this study
in most sectors of economic and service facility, and class. makes it possible to identify the social inequalities between spaces
Compared to Seoul, the degree of disparity among clusters is in Seoul and Busan, it is not for the whole country. The social
relatively small. Still, there are evident disparities in the benefits inequalities between Seoul and other regions may be incompar-
and opportunities between them. Obviously, certain regions, ably larger than those within Seoul (Kang, 1991; Kim and Jeong,
densely populated by socioeconomically upper-class people, offer 2003; Yea, 2000). These gaps are expected to be filled through
residents higher levels of benefits and opportunities than others. future studies.
Before stressing the broader implications, it is necessary to be Nonetheless, this first attempt to uncover socio-spatial
clear about the theoretical and empirical limitations of this ana- inequalities in South Korea based on data-driven methods is
lysis. The proposed causal explanation liking location, benefits provocative. There are many different perspectives and positions
and opportunities, class, and socio-spatial inequality is tentative on the analysis of inequality. Previous literature on regional
and begs further exploration. Empirically, the findings of this inequality in South Korean society has generally focused on
study can only be suggestive. In terms of the data-driven income inequality between provinces or metropolitan cities and
approach, the current study acknowledges some degree of arbi- provinces. On the other hand, the current study analyzed how the
trariness in the selection of data. Although the current study disparities in opportunities and classes stratify urban spaces.
utilized available data reflecting multidimensional characteristics We need to think about what the clustering results imply. The
of inequality, there were missing parts that this study could not results of this study adequately reflect the reality of South Korean
address because of the unavailability of data. If time-series data society. A Korean proverb states, “The young of a human should
were available, we could look at the changes in socio-spatial be sent to Seoul.” This is because people can find more oppor-
structures. However, time-series data were not available either. tunities and benefits in big cities such as Seoul. After belonging to
Future research would greatly benefit from more extensive and the space of Seoul, people want to live in a certain area, Gangnam.
reliable time-series data. Similarly, in Busan, people want to move from West Busan to East
Methodologically, this study applied K-means++ in the con- Busan, where Haeundae district is located. This social phenom-
text of the study because based on the data-driven approach it enon is due to the apparent existence of socio-spatial inequalities,
was determined that there was less need to compare and analyze and many people in South Korea desire to belong to the group of
the results by applying various clustering algorithms. In a follow- people living in Seoul Gangnam and Busan Haeundae. On the
up study, nevertheless, it is necessary to compare various clusters other hand, these regions are a space of jealousy and frustration
to which various clustering algorithms are applied for more and are often indicated as a symbol of inequality in South Korean
comprehensive interpretations. society due to socioeconomic polarization. In other words, these
Besides, as discussed at the beginning of this study, socio- regions are a space of love and an object of desire on the one hand
spatial inequality refers to the state in which opportunities, and space of envy and frustration on the other.
resources, and power are not distributed evenly across different According to Soja’s (2010) conceptualization of spatial justice,
spaces. This study captures socio-spatial inequalities in if the geographic space formed by the social process is not socially
just (it is not fair to all), the space formed in this way affects the
society and lives of individuals in unjust ways. That is if spatial
Table 4 Districts (and county) by cluster (Busan). classes are formed in the historical moment and social context,
the majority of human activities, except for a certain group of
people, are spatially excluded from public services and invest-
Cluster Districts (Gus) Numbers
ments. The results of this study, which targets two representative
Cluster 0 Buk, Sasang, Saha, Seo, Jung, Dong, Yeongdo 7 cities in South Korea, can be said to be an example to partly
Cluster 1 Geumjeong, Dongnae, Yeonje, Busanjin, Nam, 6 explain. It is worth noting that, in particular, the gap in the
Suyeong
enrollment rates of elite high schools is significant between
Cluster 2 Haeundae 1
Cluster 3 Gangseo, Gijang 2
Gangnam and the rest of the region in Seoul, and between
Haeundae and the rest of the region in Busan. This is a result that
Table 5 Mean value of variable by cluster (Busan).
Sub-category Variable Cluster 0 Cluster 1 Cluster 2 Cluster 3
1 Transportation Subway station 4.73 9.46 15.00 8.38
2 Public parking spaces 2297.70 693.00 3495.76 1578.00
3 Culture Cultural facility 5.59 6.50 10.00 4.66
4 Theater 0.79 1.38 6.00 1.00
5 Medical treatment Tertiary hospital 0.22 0.12 0.00 0.00
6 Safety Police station 9.91 14.21 16.00 7.77
7 Firehouse 3.82 2.89 7.00 4.29
8 Education Enrollment rate of elite high school 3.83 5.63 24.6 2.75
9 Private educational institute 115.08 317.79 602.00 167.88
10 Economy Large-scale store 7.17 12.74 26.00 6.42
11 Gross wage and salary (unit: million KRW) 1,570,900 1,851,498 2,696,997 2,571,038
12 Educational background High educational background 38.58 48.16 49.27 41.04
13 Occupation High professional skill 16.83 22.42 24.79 17.44
14 Income High income 16.08 21.36 29.03 27.72
15 Wealth Average price of a condominium (unit:1000 KRW) 199,462 320,561 376,242 272,477
See Fig. E2 in Appendix E for graphs.
HUMANITIES AND SOCIAL SCIENCES COMMUNICATIONS | (2022)9:23 | https://doi.org/10.1057/s41599-022-01035-5 11ARTICLE HUMANITIES AND SOCIAL SCIENCES COMMUNICATIONS | https://doi.org/10.1057/s41599-022-01035-5
makes it possible to see that social classes are being reproduced Ahn G, Han S, Kim J, Kim S, Kim HB, Lee YS (2014) Empirical analysis of
through education in South Korean society. transport policy for regional development. The Korea Transport Institute,
This research has obvious implications at the local public Sejong, (in Korean)
Alkire S, Roche JM, Santos ME, Seth S (2011) Multidimensional poverty index
policy level. Discussing and solving social problems arising from 2011: brief methodological note. University of Oxford
social inequality begins with a clear perception of reality. In this Andersen PL, Hansen MN (2012) Class and cultural capital—the case of class
regard, through the findings of this study, we are able to identify inequality in educational performance. Eur Sociol Rev 28(5):607–621
which social inequality factors are interspersed between spaces Arthur D, Vassilvitskii S (2007) k-means++: the advantage of careful seeding.
and determine the spatial shape. Although it may not be possible In: SODA '07: Proceedings of the eighteenth annual ACM-SIAM sympo-
sium on Discrete algorithms, 1027–1035. https://dl.acm.org/doi/10.5555/
to address the multifaceted inequalities presented in this study 1283383.1283494
easily, geographical expansion of opportunities can be one of the Atkinson R (2006) Paddling the bunker: strategies of middle-class disaffiliation and
solutions. This can be possible not from a non-spatial policy colonization in the city. Urban Stud 43(4):819–832
perspective, but by expanding the geography of opportunities to Atkinson R (2008) Commentary: gentrification, segregation and the vocabulary of
improve access to opportunities in specific living areas. This affluent residential choice. Urban Stud 45:2626–2636
Ballas D (2013) What makes a ‘happy city’? Cities 32:39–50
study’s policy implications include the necessity of introducing Bonaccorso G (2018) Mastering Machine Learning Algorithms: expert techniques
measures to reduce the gap in opportunities and benefits between to implement popular machine learning algorithms and fine-tune your
regions. Social inequality is structurally reproduced if a certain models. Packt Publishing Ltd
social class living in a certain area monopolizes opportunities and Byun S, Kim K (2010) Educational Inequality in South Korea: the widening
benefits. Therefore, how to distribute these opportunities and socioeconomic gap in student achievement. In Emily H, Park H, Butler YG
(eds) Globalization, changing demographics, and educational challenges in
benefits more fairly is at the heart of policy. However, the real East Asia. Emerald Group Publishing Limited
challenge is how to decentralize economic and service facilities Byun S, Kim KK, Park H (2012) School choice and educational inequality in South
that have a strong centripetal tendency. The realistic plan is to Korea. J School Choice 6(2):158–183
develop Seoul and Busan into a multi-centric cities. Seoul, where Chan TW, Goldthorpe JH (2007) Social stratification and cultural consumption:
about 9.8 million people live, should not be a simple structure the visual arts in England. Poetics 35(2-3):168–190
Chapple K (2007) Overcoming mismatch: beyond dispersal, mobility, and devel-
that can be divided into Gangnam and the rest (Haeundae and opment strategies. J Am Plan Assoc 72(3):322–336
the rest in Busan), but a multi-centric structure in which various Chen Y, Bougerguene A, Li HX, Liu H, Shen Y, Al-Hussein M (2018) Spatial gaps
small and medium-sized cities are connected by education, cul- in urban public transport supply and demand from the perspective of sus-
ture, transportation, and industry. These factors should not be tainability. J Clean Prod 195:1237–1248
concentrated in one place but should be spread across regions. In Choi EY (2004) The socio-economic segregation and the differentiation of public-
sector schools. J Urban Stud 9:66–86. [in Korean]
other words, the current mono-centric city must develop into a Choi EY (2006) The formation of rigid cycle of the rich in Gangnam—according to
multi-centric city. Since social investment in the supply of these the change of Condo prices (1989–2004). J Kor Urban Geogr Soc 9(1):33–45.
services and facilities is difficult in the short term, it should be [in Korean]
planned and developed from a long-term perspective. Thus, Choi MH, Sheong KS, Cho BM, Hwang IK, Chang HK, Kim MH, Hwang SS, Lim
follow-up studies should investigate them further. JS, Yoon TH (2011) Deprivation and mortality at the town level in Busan,
Korea: an ecological study. J Prev Med Public Health 44(6):242–248
Coleman JS (1990) Equality and achievement in education. Westview Press
Data availability Cox S, Cox T (1996) Safety, systems and people. Butterworth Heinemann
All data analyzed are contained in Appendix E included in the de la Espriella C (2009) Applications of poverty maps in urban planning: examples
supplementary information. from Liberia, in Costa Rica. Appl Spat Anal Policy 3:163–182
Duranton G, Puga D (2000) Diversity and specialisation in cities: why, where and
when does it matter? Urban Stud 17(3):533–555
Received: 3 June 2021; Accepted: 6 January 2022; George H (1973) Progress and Poverty; an inquiry into the cause of industrial
depressions and of increase of want with increase of wealth: the remedy. AMS
Press
Grubesic TG, Wei R, Murray AT (2014) Spatial clustering overview and com-
parison: accuracy, sensitivity, and computational expense. Ann Assoc Am
Geogr 104(6):1134–1156
Notes Grusky DB (2014) Social stratification: class, race, and gender in sociological
1 There is no standard that clearly defines Gangnam, but here, Gangnam is a kind of perspective. Routledge
proper noun expression referring to three districts, Gangnam-gu, Songpa-gu, and Hacker KP, Seto KC, Costa F, Corburn J, Reis MG, Ko AI, Diuk-Wasser MA (2013)
Seocho-gu, called the Gangnam 3 gu. Gangnam is defined as an area that symbolizes Urban slum structure: integrating socioeconomic and land cover data to
social classes, political behavior, wealth, consumption behavior, condominium prices,
model slum evolution in Salvador, Brazil. Int J Health Geogr 12:45
Harvey D (1989) The urban experience. Johns Hopkins University
educational conditions, and public services that are different from other regions (Park
Hastie T, Tibshirani R, Friedman J (2009) The elements of statistical learning: data
and Jang, 2020; Yang, 2018).
mining, inference and prediction. Springer
2 Ministry of the Interior and Safety, Republic of Korea (http://27.101.213.4/).
Henning C, Liao TF (2013) How to find an appropriate clustering for mixed-type
3 The Mori Memorial Foundation (https://mori-m-foundation.or.jp/english/ius2/gpci2/
variables with application to socio-economic stratification. J R Stat Soc
index.shtml).
62:309–369
4 Kearney (https://www.kearney.com/global-cities/2021).
Henning C (2015) What are the true clusters? Pattern Recognit Lett 64:53–62
5 Marine Insight (https://www.marineinsight.com/know-more/container-ports-and- Hollingshead AB (1975) Four-factor index of social status. Yale University
port-operators/). Hong E, Ahn BC (2011) Income-related health inequalities across regions in Korea.
6 Seoul Metropolitan Government (http://news.seoul.go.kr/traffic/archives/31616). Int J Equity Health 10:41
7 Korean Film Council (https://www.kofic.or.kr/kofic/business/board/ Horton FE, Reynolds DR (1971) Effects of urban spatial structure on individual
selectBoardDetail.do?boardNumber=2andboardSeqNumber=48560). behavior. Econ Geogr 47(1):36–48
8 Statistics Korea (http://kostat.go.kr/portal/korea/kor_nw/1/6/1/ Im J, Hong SH (2017) Impact of a new subway line on housing values in Daegu,
index.board?bmode=readandaSeq=374490andpageNo=androwNum=10andamSe- Korea: distance from existing lines. Urban Stud 55(15):3318–3335
eq=andsTarget=andsTxt=). Jang M, Kang CD (2015) Housing prices in Seoul, Korea: a retail type and housing
9 Ministry of Land, Infrastructure and Transport (http://stat.molit.go.kr/portal/cate/ submarket approach. Habitat Int 49:516–528
statFileView.do?hRsId=327&hFormId=). Johnstone B, Jones A, Kruger C (2019) Applied Unsupervised Learning with
Python: discover hidden patterns and relationships in unstructured data with
python. Packt Publishing Ltd, Birmingham
References
Ahlquist JS, Breunig C (2012) Model-based clustering and typologies in the social Jung HS, Kim SW, Ahn SH (2014) Multidimensional Inequality in South Korea: an
empirical analysis. Asian Soc Work Policy Rev 8(2):170–191
sciences. Political Anal 20:92–112
12 HUMANITIES AND SOCIAL SCIENCES COMMUNICATIONS | (2022)9:23 | https://doi.org/10.1057/s41599-022-01035-5You can also read