Spending Review 2018 Public Employment Services - Mapping Activation - Department of Public Expenditure and ...
←
→
Page content transcription
If your browser does not render page correctly, please read the page content below

Spending Review 2018
Public Employment Services – Mapping
Activation
O RLAGH L AVELLE & N IAMH C ALLAGHAN
DEASP V OTE
J ULY 2018

                           This paper has been prepared by IGEES staff in the Department
                           of Public Expenditure & Reform. The views presented in this
                           paper are those of the authors alone and do not represent the
                           official views of the Department of Public Expenditure and
                           Reform or the Minister for Public Expenditure and Reform.

                       1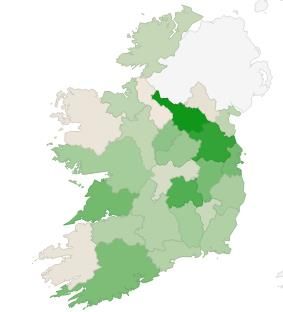
1

June, 2018
Key Findings
Public Employment Services (PES) are a series of internally managed and externally contracted services which
provide activation supports and services to a range of social welfare payment recipients.
PES is resource heavy with approximately 1,717 mediators or case officers engaged in the area and a
total expenditure of €146m in 2017.
Despite marked decreases in the number of Jobseeker payment recipients in the period 2013-2017, there
has been little change in the allocation of both staff and expenditure to PES over the same period. This
suggests there is resource capacity that is being under-utilised and that there is scope for improvements
to cost efficiency.
PES providers have similar delivery mechanisms but different target groups related to a jobseeker’s
duration of unemployment. It is unclear what criteria is used to determine the most appropriate provider
for an individual’s activation journey as there are a number of overlaps between providers of services to
the Long-Term Unemployed.
Given the substantial decrease in the Live Register there is currently scope in the PES system to further
incorporate the activation of adults removed from the labour force including qualified adult dependants,
and people with disabilities.
There is a lack of data in relation to the input and output metrics of a number of PES providers and
INTREO in particular.
Recommendations
1. It is recommended that DEASP report output metrics for all PES providers at regular intervals and publish
these as recommended in the Pathways to Work Strategy. Key output metrics to be collected could
include:
a. Number of staff engaged in activation
b. Referrals to other services
c. Average caseload of staff
d. Number of client engagements
e. Frequency of client engagement
2. PES provision for the LTU cohort should be consolidated to reduce complexity to ensure each provider
has separate target cohorts to maximise resource allocation. DEASP should use the evaluation of JobPath
to inform best practice in future activation services for LTU.
3. The client base for PES should continue to expand to include non-activation cohorts and achieve
objectives set out under Pathways to Work and Action Plan for Jobless Households.
4. Allocations to LES, Jobs Club and EmployAbility should be evaluated in the context of reduced demand
to include metrics and clear KPI’s and a realignment
2 of inputs with outputs.1. Glossary of Acronyms
PES Public Employment Services
LES Local Employment Service
DEASP Department of Employment Affairs and Social Protection
LTU/STU Long-Term Unemployed/ Short-Term Unemployed
FET Further Education & Training
BTWEA/BTEA Back To Work Enterprise Allowance/ Back to Education Allowance
GIS Group Information Session
JIS Joint Information Session
CE Community Employment scheme
PPP Personal progression Plan
FTE Full-Time Equivalent employee
PTW Pathways to Work
APJH Action Plan for Jobless Households.
32. Introduction
Public Employment Services are defined as a system of services both provided directly by the state and through
contracted services which “help match supply and demand of the labour market through information,
placement and active support services at local, national and European level” (European Commission, 2017).
PES can be provided for both those in receipt of unemployment payments such as Jobseeker’s Allowance and
Jobseeker’s Benefit in Ireland where an individual is subject to mandatory activation, and additionally to other
social welfare payment recipients on a voluntary basis.
The past decade has seen considerable changes in the labour market in Ireland accompanied by significant
policy developments. While the PES are structured differently across EU countries they face similar challenges
in terms of adapting to constantly evolving labour markets. PES provision before 2012 was administered by a
number of different agencies including FÁS, an agency under the remit of the Department of Jobs, Enterprise
& Innovation. After the dissolution of FÁS, the training function of the agency was assumed by SOLAS, an
agency under the remit of the Department of Education & Skills, while the activation section of FÁS was
merged with Department of Social Protection payment offices to create a new service, Intreo. Intreo is
designed to be a one-stop shop for social protection payment recipients to interact with the Department and
begin their activation process. This policy change has been accompanied by a move towards the inclusion of a
range of social protection recipients and the activation of a wider variety of recipients in order to improve
mobility and progression to employment when appropriate.
Overall the aim of PES in Ireland is twofold: to manage the provision of income support payments and to
provide labour market activation services through the provision of job search assistance, employer
intermediation services, counselling and monitoring. This paper will provide a high-level overview of the
quantum of resources and activities undertaken focused specifically on the activation aims of PES and consider
how they have evolved over the past six years. Given the number of different services involved and the
considerable change in this policy area since 2012, it is timely to evaluate the PES activation interventions to
help expand the evidence base in this important policy area.
The key question of this exercise is “What is the scale and scope of PES activation provision in Ireland and how
has it evolved since 2013?” The scope of this exercise relates to PES activation services: Intreo, Job Clubs, Local
Employment Services (LES), JobPath, and EmployAbility, with the focus of the exercise being Jobseeker’s and
referrals of individuals on the Live Register. While PES have begun to shift towards the inclusion of non-
activation clients1, these still make up a small minority of all clients to these services. Branch offices are not
directly involved with the activation of clients and therefore are excluded from this review.
1 Non-activation clients include lone parents, early school leavers, low income smallholders, refugees, persons with disability, members
of travelling community, ex-offenders, non-live register employment returners.
4The approach in the paper will draw on four elements of the Programme Logic model framework2 used in
Value for Money Reviews including objectives, inputs, activities and outputs. An analysis of outcomes is
beyond the scope of this preliminary exercise.
Section Two sets out a description of PES activation services currently available including the
objectives and target cohort of each provider;
Section Three analyses the inputs, expenditure and associated resources (offices and staff), for each
service provider;
Section Four discusses the range of activities undertaken by different PES;
Section Five presents a range of output metrics for each of the PES;
Section Six describes the strategic direction/coordination of each of the different PES providers and
how the PES policy intervention is responding to different labour market challenges, for example
boosting labour force participation and reducing short and long term unemployment; and
Section Seven concludes with a summary of the key findings, recommendations and next steps.
Background
As part of the Spending Review 2017 an analysis was undertaken on the range of employment supports,
provided by DEASP, in the context of the improved economic conditions of recent years. One of the
recommendations of this paper was “further analysis should be undertaken on the role of Public Employment
Services, in particular regarding the current capacity levels compared to developments in the Live Register and
whether there is overlap between the different services in this area” (Callaghan, 2017). It also highlighted a
“number of data gaps regarding the level of referrals and engagements by Intreo and other public employment
services with the Jobseeker cohort”. In light of this recommendation, this paper will examine the range of
providers and resources in this area and any developments in data gatherings and metric reporting. A number
of reports regarding Job Clubs, LES, JobPath and Intreo are being prepared as part of DEASP’s evaluation
programme and this will add to the evidence base on this area.
The period of analysis for this paper is 2013 to 2017. This was a time of considerable development in the labour
market with unemployment falling from 13.8% to 6.7% (Labour Force Survey, CSO) and the primary activation
client base for PES falling by approx. 160,000 (see Box 1 for further details).
There are a number of different activation providers under the PES umbrella in Ireland (see
Figure 1). These include services provided internally by the DEASP staff such as Intreo and other externally
provided services managed by DEASP, such as Job Clubs and JobPath. This area has undergone significant
change during peak levels of unemployment in 2011-12 with:
2 http://publicspendingcode.per.gov.ie/b06-appraising-current-expenditure/
5 the merger of DEASP local offices, the HSE’s Community Welfare Service (CWS) and FÁS, into one
single entity, Intreo;
the growth in the Live Register, particularly the increase in the long-term unemployed which required
additional PES capacity resulting in the contracting of resources through the JobPath model.
Box 1: Labour Market
Live Register
Over the period 2013-2017 the average Live Register Number has fallen by 38% from 418,465 to 258,580 with the average
Unemployment Rate falling concurrently from 13.8% in 2013 to 6.7% in 2017 driven by strong economic and labour market
conditions. The downward trend is evident in both long and short-term Live Register figures.
Live Register (Yearly
2013 2014 2015 2016 2017 Accumulative
Average)
Less than one year 229,600 204,553 184,689 166,729 148,536 81,065
YoY % -12% -11% -11% -12% 35%
One year or more 188,865 178,907 158,580 135,932 110,044 78,821
YoY % -6% -13% -17% -24% 42%
Total Live Register 418,465 383,461 343,269 302,661 258,580 159,885
YoY % -9% -12% -13% -17% 38%
Unemployment
Much of the fall in unemployment was due to the decline in those unemployed for > 1 year (LTU) decreasing from an average
of approximately 178,000 in 2013 to 71,000 in 2017(↓60%), followed by the decline in those unemployed for < 1 year (STU)
with an average of approximately 127,000 in 2013 to 82,000 in 2017 (↓35%).
Similar reductions also occurred in the youth unemployed cohort with the number of short term unemployed (< 1 years) falling
from an average of approximately 44,500 in 2013 to 27,000 in 2017 (↓39%) with bigger declines in the long term youth
unemployment figure (>1 year) decreasing by 64%, going from an average of approximately 29,000 in 2013 to 10,500 in 2017.
Much of the remaining unemployed are of an older age cohort and those structurally (unemployed for 3+ years) and socially
detached from the labour market.
Source: CSO database and authors calculations of average Live Register and Unemployment figures.
63. Overview of Public Employment Services
There are currently five main providers of Public Employment Services in Ireland (see
Figure 1). This network of providers has undergone considerable change over the past number of years with
the establishment of the Intreo network from 2012 onwards and the rollout of the JobPath model from mid-
2015. The other providers have been in place longer; LES was established in 1995, Job Clubs in 1999 and
EmployAbility in 2004. There has been a significant shift from mainly the provision and processing of payments
towards the activation of jobseekers, underemployed part-time workers and the non-activation cohorts
(qualified adult dependants, lone parents, people with disabilities) under the Pathways to Work and Action
Plan for Jobless Households. PES activities include:
Job brokerage by publicly disseminating job vacancies to facilitate rapid matches between supply
and demand.
Provision of labour market information by collecting data on job vacancies and potential applicants.
Market adjustment by implementing labour market policies aimed at adjusting labour demand and
supply.
Management of labour migration by coordinating the geographic mobility across borders of persons
who want to use and develop their skills in a new working environment.
Jobseeker engagement to identify barriers to employment to help provide a positive employment
outcome for the client.
Employer engagement to identify suitable places of employment for Jobseekers.
Figure 1: Range of Public Employment Services
Intreo
Employability JobPath
PES
Internally provided
Local External contract
Employment Jobs Clubs
Services
74. Programme Logic Model
In order to investigate the range of PES providers the paper will draw on four elements of the Programme
Logic Model framework3 used in Value for Money Reviews. The four elements include objectives, inputs,
activities and outputs that are detailed in the diagram below. A discussion of outcomes is beyond the scope
of this current exercise.
Objectives Inputs Activities Outputs
•What is the service •What level of •Type of services • Available output
intended to resourcing is provided - case performance metrics
do/deliver? committed to PES management, (targets/KPI's)
•Who is the service including: interview preparation •Number of
for/aimed at? •Annual funding etc. engagements
•Level of staff •Is the service •Number of persons
resources internally or externally engaged with
•Number and location provided? •Frequency of
of offices •If externally provided, engagements
how is PES provider
managed by DEASP?
Objectives
PES provision is a complex system with different streams of users, providers and engagements. A descriptive
overview of each PES is set out in Table 1 and expanded on in Appendix 2 which aims to outline the areas of
responsibility for each provider and what client groups they are targeting. Each of the different service
providers support Jobseekers entering or returning to employment (Citizens Information, 2018). The services
are externally delivered through contracting arrangements with the exception of Intreo, which is an internal
service provided by DEASP staff.
3 http://publicspendingcode.per.gov.ie/b06-appraising-current-expenditure/
8Table 1: Description of each PES
Public Employment Service Overview on Provision of Service
LES providing a range of services and facilities to assist long-term unemployed
persons to enter/re-enter employment. Activation clients are referred by
Local Employment Services
Intreo. LES also engage with non-activation clients4. With the introduction of
(LES)
the JobPath in 2015, referrals to LES were done on a replacement basis5 only
to deliver more intensive client engagement.
Job Clubs provide structured support for ‘job ready’6 Jobseekers to assist
Job Clubs
entry/re-entry to employment.
The EmployAbility Service provides an employment support service for
people with a health condition, injury, illness or disability and a recruitment
EmployAbility advice service for the business community. EmployAbility provides an
employment service for Jobseekers/persons with disabilities, who are ‘job
ready’ and require support to secure and maintain a job.
Intreo is a single point of contact for all employment/income supports for
social protection payment recipients and engagement with local employers.
It is designed to provide a more streamlined approach to activation and is
the first point of contact for the unemployed. Intreo is responsible for the
processing of all claims and payments as well as any queries relating to
Intreo
DEASP payments. Intreo activation services are targeted at short-term
Jobseekers (duration on Live Register of less than 1 year) as a priority for
case officers to stem the flow into long term employment. It operates a
work first policy: jobs first for those that are ready to enter/re-enter the
labour market; and education and training for those who are not.
JobPath is employment activation service developed under the PtW Strategy
to target people who are long-term unemployed and those distanced from
the labour market. The activation of the LTU cohort was outsourced to
JobPath external providers (Seetec and Turas Nua) to concentrate Intreo resources on
the short-term unemployed cohort, to stem the flow into long-term
unemployment and facilitate the differing needs and supports required for
those LTU to enter/re-enter the labour market..
Source: Department of Employment and Social Affairs website, Citizens Information, Indecon International Economic Consultants, ESRI
Intreo Evaluation.
The various types of PES providers seek to target different client groups, however there does appear to be
some overlap in the focus of provider. A PES intervention pathway is dependent on the profile of the Jobseeker
and this is facilitated by an IT-based Activation and Case Management (ACM) system operated by DEASP that
tracks Jobseekers across the PES system, called the Jobseeker Longitudinal Dataset.
5 “As of2016, a maximum caseload of 120 clients per mediator applied, with clients only referred by the DEASP on a replacement basis
only (a new referral possible only when a jobseeker/client enters employment or finishes their 12-month engagement period with the
LES service”. (Indecon International Economic Consultants, 2018)
6 “Job Ready” clients can be defined as a person who has the necessary training, education, motivation and ability to pursue
work/career in the open labour market.
9Activation Process
PES is the first part of the Active Labour Market Policy response. All recipients of unemployment related
payments (Jobseeker’s Assistance and Jobseeker’s Benefit) must attend their local Intreo office and engage
with the activation process. Figure 2 gives an overview of the activation process and journey to employment.
Figure 2: Activation Infographic7
Intreo
GIS
1 to 1
Session STU
Job Ready Requires FET
Jobsclub
Employment Employment SOLAS/
Programme Springboard
After 12 months
JobPath LES BTWEA/BTEA
LTU
7This is an indicative infographic of a generic activation journey for jobseekers, variations to this will exist given the individualistic
nature of activation specific to an individual jobseeker.
10PES Journey 0-12 months Unemployed
Intreo offices are the first point of engagement when an individual becomes unemployed. A claim is made by
the Jobseeker and an appointment is scheduled with an Intreo case officer to process and approve the claim
once the required documentation has been received.
Following this initial registration Jobseekers8 are assigned to attend a group information session (GIS). GIS is
technically the first step in the direct activation process. This session provides information on the range of
supports and services available to Jobseekers. After this session, Jobseekers are assigned a case officer and an
appointment to attend a one-to-one session with DEASP to “discuss employment opportunities, training
courses, financial supports and other options which may lead to employment” (Citizens Information, 2018).
The 1 to 1 case officer sessions are the most intensive part of the activation process. A personal progression
plan is agreed and signed, which involves a discussion of skills, strengths, and requirements for support, and
referrals to suitable courses in education, training, or suitable employment programmes if associated gaps are
identified. These can include referrals to Job Clubs for more short-term supports around CV preparation,
interview skills, and the use of facilities for job searching. If education gaps are identified, the client with the
support of their case officer can get approval for further education and accredited courses through Solas,
Springboard and the Back to Education Allowance (BTEA). Qualification for these courses will be dependent
on existing gaps and duration of unemployment. For those who require more work experience, clients can be
referred or can self-select in applying for employment programmes like Community Employment (CE) and Tús.
Similarly, the qualifying criteria for these employment schemes is contingent on duration of unemployment
and requires case officer approval.
The pattern of follow-up engagement with the assigned case officer will be dependent on the Jobseekers
Probability of Exit (PEX) score derived from profiling using the personal information provided (See Appendix
3). Jobseeker profiling was introduced in 2012 with a number of objectives primarily in “reducing costs,
providing a more efficient and effective use of resources, earlier interventions and the prevention of long-
term unemployment”. (European Commission, 2016)
PES Journey >12 months Unemployed
The structure and delivery of activation engagement for the long-term unemployed cohort is not dissimilar to
that of the short-term unemployed although the delivery mechanism differs in line with the challenges specific
to each cohort. At 12 months, the claimant is reclassified as a long-term unemployed Jobseeker and can then
be referred to LES or JobPath by Intreo. JobPath is a service providing activation interventions focused
specifically at long-term unemployed Jobseekers and underemployed individuals currently working part-time.
8Jobseeker may refer to a person in receipt of a jobseeker’s payment, a person signing for credits and a person who is unemployed
but not eligible for a payment.
11Clients referred to LES are on a strict replacement basis only in order to deliver a more intensive and enhanced
model of customer engagement, with corresponding reductions in caseload per mediator. However, when
there is an available place in LES, it is not entirely clear the exact criteria that dictates whether a Jobseeker is
referred to LES or to JobPath.
LES
After selection to LES under the replacement basis criteria, activation clients are scheduled to attend a GIS or
a 1 to 1 appointment with an LES mediator. An initial GIS meeting is then followed by a 1 to 1 appointment
within two weeks of the GIS, during which a PPP is drawn up, agreed and signed. Non-attendance at the GIS is
followed up by Intreo and may include sanctioning (payment deduction) or a warning9. Follow-up
appointments with the LES mediator are focused on progression of the agreed PPP and identification of any
barriers that exist. The frequency of review appointments with LES mediator are based on activation caseload
of the mediator (101-120 clients = monthly engagement with each client; 81-100 clients = engagement with
each client every 3 weeks; 80 or less clients = client engagement every 2 weeks). Mediators are provided with
€500 funding per client per year to reduce the barriers of returning to employment through the provision of
items such as renewal of necessary safety certificates, protective clothing, or appropriate interview attire.
LES also engage with non-activation clients who are referred on a voluntary basis who are not included in this
caseload and a mediator may be involved in supporting these clients as well as their activation caseload. The
frequency of follow-up for LES differs from other PES providers where frequency of follow-up is based on client
needs which are generally based on duration of unemployment as opposed to the caseload of staff.
Engagement is continued for a period of 12 months unless the client gains employment or self-employment
of at least 30 hours a week. They are then considered case closed. At the end of 12 month activation period
with LES, clients are referred back to Intreo for review if there is a need for further activation or to Job Clubs
if considered “job-ready”.
JobPath
Jobseekers who are on the Live Register for longer than 12 months are classified as Long-Term Unemployed
and can be referred by Intreo to JobPath for activation. Selection onto JobPath is conducted through random
computer generation and Jobseekers with no previous activation exposure are prioritised for selection in order
to promote activation to a wider pool of Jobseekers.10There are two phases in the JobPath model. Phase one
begins with a referral process and involves the engagement process similar to the LES interactive structure
9Payment sanctions and penalties can occur for non-attendance at compulsory review meetings or non- compliance with the
activation process without valid reasons.
10 Selected jobseekers are divided into 5 cohorts based on duration of unemployment (12 months, 1-2yrs, 2-3yrs, >3yrs,
underemployed (part-time) workers. Underemployed part-time workers are those that are in receipt of a jobseekers related income
support payment for more than 12 months on the basis that they are seeking to secure full-time employment.
12described above (initial GIS, followed by a one-to-one session with a personal employment advisor, agreement
and signing of PPP).
This first phase lasts up to 12 months but can be extended to 18 months in some cases for those who attend
education/training courses during the JobPath activation. The pattern of engagement involves one to one
review meetings with a personal advisor at a minimum of every 15 days for the first three months and every
20 working days thereafter where clients have not exited to employment.
Phase two commences when the Jobseeker enters full-time employment. During this period the JobPath
personal advisor will continue to work with the Jobseeker for a period of at least three months and up to 12
months in order to help them sustain employment. If a JobPath client completes activation without gaining
employment or has not been successful in sustaining employment after 12 months they are referred back to
Intreo where they may be re-referred back to JobPath, after a six month break period. However, movement
back to the Live Register does not automatically result in re-referral to JobPath.
EmployAbility Service
EmployAbility is a contracted service provider which focuses on the activation of social welfare payment
recipients with an illness or disability (non-activation cohort). The contractors interact with both Jobseeker’s
and employers as an advice and job-matching service. They seek to match Jobseeker’s with appropriate
employment opportunities and offer advice and information on additional services and employment supports
available to this cohort.
As this service is specifically focused on Jobseeker’s with illnesses and disabilities, it differs somewhat from
the other PES in that mandatory referrals are not made to the service providers. Instead referrals to service
providers from Intreo are for individuals with a reduced capacity to work who may have additional difficulty
in accessing the labour market. These recipients are not subject to mandatory activation and these services
are attended on a voluntary basis.
Service is provided through advice and guidance on individual needs assessments, personal progression plans,
job-sourcing and matching. The service also engages with employers to ensure that employment is available
to those individuals with a reduced capacity for employment. Once appropriate employment has been sourced
by the Jobseeker, EmployAbility may then provide on-the-job advice and coaching, as well as follow-up and
in-work support if necessary.
13Key Findings
The PES system is highly complex as there are a number of different providers with similar delivery
mechanisms but different target groups related to duration of unemployment. However, it is unclear
what criteria is used to determine the most appropriate provider for an individual’s activation journey
as there remains some overlap across providers relating to the activation of the LTU cohort.
Intreo is focused on the activation of the STU while JobPath is focused on the activation of the LTU.
Activation intervention is similar across all PES providers with the focus of intervention being one-to-
one client engagement for Jobseekers (activation cohort).
Follow-up review patterns are minimum requirements to be met by providers and are mandatory to
attend for clients. The intensity and scope of activation interaction with case officers and activation
services can be increased on a voluntary basis by the clients themselves.
There are differences in the PES journey dependent on whether the Jobseeker is job ready or not.
Intreo operate a work first policy, referrals to FET are undertaken if gaps in education and skills are
identified as barriers to gaining employment.
JobPath selection is prioritised on activating those who have never experienced any activation
previously, this promotes activation exposure to a wider pool of Jobseekers.
LES, Intreo provide resources for engagement with non-activation clients which remains voluntary for
these clients. EmployAbility provides employment support service for those with a health condition,
illness or disability (non-activation cohort) on a self-select voluntary basis.
145. Inputs
This section analyses the quantum of resources dedicated to each of the PES providers including staffing,
expenditure, and offices.
Staffing
The provision of PES activities is resource intensive and therefore the bulk of expenditure is driven by
staffing/pay-related costs.
The five PES providers engaged in activation employed approx. 1,717 persons in 2017. Over the period 2014
to 2017 the staff resources devoted to activation increased by 617 or 56%, due to the introduction of JobPath
in 2015 which increased its staff complement to 631 in 2017 (Figure 3). Intreo have the largest staffing
component of PES with 708 staff (mainly HEO’s) devoted to activation. This accounts for 21% of total Intreo
staff (3,371 in 2017). Intreo activation staff numbers overall have decreased slightly in the period. LES mediator
staff levels have increased slightly while Job Clubs and EmployAbility staff levels have remained static over the
period during a time of strong economic and labour market performance.
Figure 3: PES Activation Staff, 2014-2017
2000
1800 1735 1717
1600
Number of activation staff
1400 631 631
1198
1200 1100
125
1000
800
730 698 721 708
600
400
113 113 115 113
200 100 100 97 98
157 162 171 167
0
2014 2015 2016 2017
LES Jobs Clubs Employability Intreo JobPath Total Activation staff
Source: DEASP Admin data
15Expenditure
There are three different funding models in place across the different PES.
1. Intreo is internally provided and the cost of providing the service is met from within the administration
expenses of the Department of Employment Affairs and Social Protection.
2. The JobPath service is externally provided under contract through a payment-by-results11 model.
3. LES, Job Clubs and EmployAbility providers are funded through service contracts with the provision of
services being fully funded by DEASP. Payment under these contracts is not linked to outputs achieved, rather
payment is made based on the costs incurred in the provision of the service.
Whilst there is accurate expenditure data available for four PES providers (LES, Job Club, EmployAbility,
JobPath), similar expenditure data for Intreo activation costs was sought from DEASP but was not readily
available12. It is considered that the fragmentation of costs across the Intreo network makes it difficult to
accurately assess actual expenditure of PES activation. Given the absence of disaggregated data regarding
Intreo activation costs and the resource intensity of activation services, it was necessary to estimate Intreo
activation costs using the Public Spending Code framework13. It should be noted that given the methodology
used there is an underlying interdependence relating to Intreo staff numbers and Intreo estimated
expenditure which should be taken into consideration when assessing trends over the period.
11Payment is based on (i) registration of clients following agreement of Personal Progression Plans (PPP - registration fee) and (ii)
thereafter only on the achievement of employment outcomes (JSF : job sustainment fees).
12This is due to the complexity of disaggregating costs associated with different services available in Intreo offices (payment processing, claim
administration and approvals, activation services). Intreo staff can have a dual function and may be involved in both payment processing and
activation work as a case officer. In addition, the current cost centres are based on Principal Officer Divisions which have diverse spans of
responsibility and make it difficult to identify and apportion activation costs in respect of the Intreo network as a whole.
13Thiswas done using total number of Intreo activation case officers (mainly HEO’s), the HEO salary midpoint, employers PRSI and pension
contributions and an approximation of overheads. The formula was then applied to preceding years up to 2017 and estimated Intreo activation
expenditure was added to the expenditure of the other PES providers to obtain the total estimated activation spend per annum.
https://publicspendingcode.per.gov.ie/e-01-calculation-of-staff-costs/
16Figure 4: Total Estimated PES Activation Expenditure, 2014 - 2017
160
146
140
120 114
Expenditure €m
100 90 90
80
60
40
20
0
2014 2015 2016 2017
LES Jobs Clubs Employability Intreo JobPath Total
Source: DEASP annual statistical report, DEASP admin data.
Total expenditure relating to the PES activation costs amounted to an estimated €146m in 2017; the formula
was applied to preceding years up to 2017 and estimated Intreo activation expenditure was added to the
expenditure of the other PES providers to obtain the total estimated activation spend per annum. It should be
noted that given the methodology used there is an underlying interdependence relating to Intreo staff
numbers and Intreo estimated expenditure which should be taken into consideration when assessing trends
over the period.
Figure 4 shows that PES expenditure has increased significantly over the period 2014-2017, which can be
largely attributed to the rollout of JobPath in 2015 with expenditure of €25 million in 2016 and €57.4 million
17in 2017. This rise in expenditure and roll out of JobPath reflects the policy of increasing activation through a
targeted service delivery to promote employment under Pathways to Work and the National Action Plan for
Jobless Households.
Prior to the introduction of JobPath the majority of total activation spend was concentrated in Intreo. Since
its introduction in mid-2015, JobPath’s share of total activation costs has been increasing and now accounts
for 39% in 2017, which is higher than Intreo’s estimated activation expenditure. Prior to the roll-out of
JobPath (with a focus on the activation of the LTU) Intreo was required to provide activation services to both
STU and LTU cohorts. From 2015 onwards JobPath’s share of activation spend and activity has been steadily
increasing. It should be noted that the roll-out of JobPath and its focus as the largest targeted activation
provider has not coincided with decreases in expenditure for the service providers focused on the activation
of the Live Register cohort such as LES and Job Clubs Expenditure has remained relatively static over the
period despite the positive labour market conditions. JobPath only commenced in mid-2015 by which time
there was a significant upturn in the economy, and it could be argued that this expenditure is not aligned fully
with developments in the labour market, the number of long-term unemployed, or the wider economy.
Figure 5: Estimated Intreo Activation Costs and Staff Numbers, 2014 - 2017
64 730
721
720
708
Intreo Activation Expenditure € m
59 698
No. of Intreo activation staff
700
58 57 57
54
55
680
49
660
44
640
39 620
34 600
2014 2015 2016 2017
Intreo estimated activation costs Intreo activation staff numbers
Source: DEASP Admin Data
Using the Public Spending Code methodology referred to earlier, total Intreo activation expenditure14 has
remained broadly constant with some slight decreases in 2015 before increasing again in 2016 reflecting an
increase in staff numbers. There have been some small changes in Intreo activation staff numbers over the
period although the overall level of staff has decreased. However as Figure 5 shows, Intreo estimated
expenditure levels have remained constant due mainly to recent pay increases in the civil service.
14 Intreo estimated activation costs are aggregated estimates and will include the costs of activation services to non-activation cohorts.
18The inability to determine Intreo activation related expenditure makes it difficult to assess linkages between
inputs (costs) and outputs. As the level of demand for PES activation has decreased due a recovering economy
and lower unemployment rate it has not been possible to assess whether PES inputs have been aligned with
outputs. The absence of disaggregated activation costs for Intreo – a key PES provider – is unsatisfactory. There
is a critical need to align inputs with outputs going forward especially with PES expected to deliver objectives
in the Pathways to Work and Action Plan for Jobless household strategies and in this context robust data is
required.
Offices
PES15 are operating in approx. 314 office locations across the country. A breakdown of the different locations
by service provider is set out in the diagram below. The largest category is JobPath with 90 locations,
representing 28% of the total share. This is followed by Local Employment Services and Intreo with 27% and
20% respectively.
Figure 6: PES locations (2017)
15 PES offices excluding Branch Offices
19EmployAbility,
24
Intreo, 62
JobPath, 90
Jobs Clubs, 51
LES, 87
Source: Department of Employment Affairs and Social Protection
Table 2: Provincial breakdown of PES offices and Live Register figure.
Province Number of PES offices Live Register (June 2018) Number of LR persons per
PES office
Leinster 154 121,147 787
Ulster 24 18,264 761
Munster 87 58,729 675
Connaught 49 27,758 566
Total/ State Average 314 225,898 719
In terms of the geographical spread of PES offices per county, it ranges from 79 in Dublin to 2 in Longford and
Cavan. Adjusting for working-age population in each county results in an average of one PES office for every
10,641 persons as reported in Census 2016, with large variations in offices per working-age capita (see
Figure 7). This is a proxy measure for catchment area and is subject to some caveats as a Jobseeker may attend
an office in a different county. Meath, Dublin, Cavan, Laois and Kildare have a lower number of offices per
capita than the State average with Mayo, Monaghan, Leitrim and Kerry reporting a higher number. Adjusting
20for Live Register figures (as of June 2018) across province, Table 2 demonstrates the variation in PES provision
across provinces, with more offices per persons on the Live Register in Connaught than in Leinster.
Figure 7: Number of offices per working-age population
High number of Low number of
offices per capita offices per capita
working age working age
population population
Source: Author calculation using CSO Census data and DEASP admin data
Key Findings
The majority of services are provided through an external service model with three different funding
models in place, Intreo is currently the only PES internally provided and funded.
In 2017, there was 1,717 FTE case officers or mediators, with estimated costs of PES activation of €146m.
This reflects the labour intensity of activation. Despite the upturn in the economy and improved labour
market conditions there has only been a marginal decrease overall in PES staff and related expenditure.
The largest PES providers are Intreo and JobPath, with the introduction of JobPath in 2015 being
responsible for the large overall increase in PES expenditure. The establishment of JobPath followed by a
period of growing prosperity in the economy and better than anticipated level of unemployment and Live
21Register numbers suggests there is scope for consolidation of service and expenditure reductions for both
Intreo and JobPath.
Despite the upturn in the economy, LES and Job Clubs expenditure have remained relatively static over
the 2014 – 2017 period. A similar trend is evident in EmployAbility.
PES could benefit from the rationalisation of service providers in regards to their locations in order to
ensure relatively even coverage for all counties.
Due to the internal cost structures of Intreo, it was not possible to get accurate disaggregated Intreo
expenditure for activation services. This creates difficulty in accurately assessing Intreo and thereby overall
PES expenditure. This also undermines the robustness of linkages between inputs and outputs which
would require to be addressed to ensure value for money is being maintained.
6. Activities
PES encompasses a wide range of activities including income support, claim processing, provision of activation
services etc. The focus here is mainly on PES providers’ interaction with clients in terms of activation/case
management services.
As illustrated in Table 3 there is a wide range of PES contact points and services available. The matrix below
sets out the activation services and supports undertaken by each of the PES providers.
Many of the activities are consistent across providers with slight differences that represent the differing client
needs with the scope of activities provided proportionate to the size of the PES provider. Intreo, the largest
provider, is solely responsible for channelling the flow of referrals to other providers and is the key
mechanism for this. Intreo and LES contractors have resources for both activation and non-activation
clients (e.g. qualified adults, people with a disability, lone parents) to promote labour market participation
particularly as the number of unemployed individuals has reduced significantly. Job Clubs, LES, and Intreo
provide walk-in services for Jobseekers and non-activation clients for basic PES services. EmployAbility
provides an intensive employment service are for non-activation cohorts (people with a disability, health
condition and illness) who self-select for activation on a voluntary basis.
Table 3: PES Activity Matrix
Activities Intreo JobPath Job Clubs LES EmployAbility
Provision of labour
market information
Active placement and
recruitment service
22Career
guidance/counselling and
mediation
Employer liaison
Referral to training,
education, work
experience and
employment programmes
Support post training,
education, work
experience and
employment programmes
In employment support
Drop In Service
Non Activation Clients
Interview Preparation
CV preparation
Provides funding to
remove barriers to
employment
Key Findings
Service provision is broad across providers and the most common PES activities are interview and CV
preparation, provision of labour market information, career guidance and employer liaison.
PES providers deliver similar activities in relation to client interventions (CV/Interview preparation),
while there is some distinction in extra supports for example, referrals, in-work supports, attending
courses.
23 JobPath, LES and EmployAbility all provide in-work support to promote sustained employment. This is
reflective of the needs of their client base, the LTU and those with structural and social barriers to
employment.
Services are targeted at activation clients (Jobseekers) with fewer resources for non-activation clients
and voluntary walk-ins through drop-in services. Expanding the focus and scope of provision to non-
activation cohorts and people outside the labour force to include qualified adults and those with a
reduced capacity to work due to caring responsibilities will be important as the economy approaches
full employment.
Most services still require referrals centrally controlled from Intreo by DEASP for FET options and
employment programmes.
247. Outputs
As set out in the previous section each of the different providers are engaged in a wide variety of activities,
that allow a number of different output metrics to be derived. Accordingly, this section reviews a range of
metrics across each of the PES activation providers on an individual basis.
Activation engagement
With the exception of JobPath, there are large data gaps in output metrics for PES providers which has led to
difficulty in completing a comprehensive analysis of outputs; the nature of JobPath’s payment-by-results
model means that output metrics are by comparison, more regular, consistent and comprehensive than the
other PES providers.
Intreo
Recent data available in 2017Q4 (as shown in Figure 8) reflects the shift of the Intreo client base from the long
and short-term unemployed to a concentrated focus on the newly and short-term unemployed cohort with
an activation duration of less than 52 weeks before reclassification as LTU. In 2016Q1, the Intreo client
engagement share for the long-term unemployed and short-term unemployed was 48% (29,178) and 52%
(31,305) respectively. By 2017Q4, the share of client engagements had diverged significantly with 86%
(39,267) representing the short-term unemployed and 14% (6,488) representing the long-term unemployed
cohort. The small percentage of LTU’s in Intreo reflects the fact that this cohort are referred to JobPath and
Intreo services are focused on the STU.
The number of short-term unemployed client engagements most likely increased due to freed up capacity of
resources as a result of significant reductions in the number of persons on the Live Register and new Jobseeker
claims. The number of short-term clients reduced from 176,143 in January 2016 to 138,350 in December 2017
(a reduction of 37,793). The number of long-term unemployed clients fell from 145,370 to 97,918 (a reduction
of 47,452) over the same period with the unemployment rate falling from 9% to 6.3%.
While it is clear that Intreo have targeted activation resources to the STU and referred the LTU externally to
JobPath, the total number of overall Intreo client engagements has declined significantly (a reduction of
15,834 from Q2 2016 – Q4 2017) and appears to be continuing to trend downwards. This is to be expected
given the lower levels of unemployment. However, the available evidence suggests that the number of Intreo
staff devoted to activation and the estimated costs of Intreo activation services have not fallen in line with the
reduction in demand for these services. This may point to either excess capacity in the Intreo service in the
context of falling Live Register numbers, additional activation services for the non-activation cohort and/or a
move to a more intensive activation service.
Figure 8 shows the number of client engagements carried out by Intreo staff as well as the average number of
engagements by a case officer each quarter. While the number of engagements has dropped as a result in the
25decrease in the Live Register, staff numbers have remained relatively static. Greater access to data in relation
to the activities of Intreo staff is necessary in order to determine whether i) there was more intensive
interaction with clients as a result of freed up capacity and ii) if this in turn impacted outcomes in terms of
gaining employment or activating those outside the labour market or iii) if there is under-utilisation of
resources across the Intreo network. These are required to be addressed and would fall into the overarching
strategies of PTW and APJH to promote participation in the labour force.
Figure 8: Intreo client engagements for short and long- term unemployed Jobseekers
70,000 90
80
60,000
Average engagement caseload per officer
70
Number of Client Engagements
50,000
60
40,000 50
30,000 40
30
20,000
20
10,000
10
0 0
2015Q2 2015Q3 2015Q4 2016Q1 2016Q2 2016Q3 2016Q4 2017Q1 2017Q2 2017Q3 2017Q4
Short-term unemployed Long-term unemployed Average engagement caseload per officer
Source: DEASP Admin data
NOTE: Client engagements will include multiple engagements that an individual case officer has with the same client.
As demand for PES decreases with unemployment expected to stabilise close to 5% in the coming years16,
inputs - current staffing levels and expenditure - would be required to be assessed against the number of
outputs - referrals, engagements, frequency of engagements, average caseloads per case officer- in order to
ascertain whether Intreo activation services are providing best value for money. To do this type of
input/output analysis requires major improvements to the quality of Intreo outputs reported. In this context
it would be necessary for Intreo inputs and outputs to be robust and reported on a regular basis. It is also
recommended that these are published to promote transparency, an objective set out under the Pathways to
Work strategy in particular with the upcoming mid-year review. Improving the link between the inputs and
outputs and allowing flexibility for developments in the economy would provide more efficient use of
16 The unemployment rate as outlined in SPU 2018 is projected to be 5.8% in 2018; 5.3% in 2019/2020; 5.4% in 2021.
26resources. Extra resources can facilitate the promotion of labour market participation to inactive cohorts 17
and people with disabilities which would help achieve the objectives in the Action Plan for Jobless Households
strategy and the Comprehensive Employment Strategy for people with disabilities.
JobPath
Unlike the paucity of readily available data related to Intreo activation services, performance data for JobPath
is produced on an ongoing basis.
Since its introduction in July 2015, JobPath cumulative gross referrals18 to date (April 2018) are 197,698 across
both providers Seetec and Turas Nua. Gross referrals represent the number of planned JobPath outputs. The
duration of engagement is 52 weeks and the target caseload per personal advisor is 120 with the current
across both providers at 140.
To date, 341,896 educational or training interventions have occurred during the engagement with JobPath
clients (interview skills, CV prep), the large majority of which were internally provided. Only 13,703 clients
undertook programmes delivered by external providers contracted out by Seetec and Turas Nua.
Figure 9 JobPath Gross & Net Referrals and PPP’s to date (July 2015 – April 2018)
250,000
197,698
200,000
181,385
Number of JobPath Clients
161,959
150,000
100,000
50,000
-
Gross Referrals Net Referrals PPP's Agreed
Source: DEASP Admin Data
Due to the payments-by-results model of JobPath, expenditure is directly related to provider performance.
Fees are paid based on the number of registrations made (PPP’s signed) and the number of clients who gain
and sustain employment. Payments comprise registration fees and job sustainment fees (JSF). The target split
17Inactive cohorts to include qualified adults, lone parents and those engaged in home duties.
18Gross referrals are those referred from Intreo and selected for activation through JobPath. The difference between gross referrals
and net referrals (those who actually attend JobPath induction session) may include non-attendance and subsequent penalties, other
commitments made prior to referrals ie. CE programme, employment, BTEA, BTWA. These can also account for the differences
between net referrals and PPP’s.
27for the fee structure was set at 15% registration fees and 85% from job sustainment fees (Department of
Employment Affairs and Social Protection, 2018). As of 2017, the split is closer to 35% to 65%.
Contractors maximise their fees if a Jobseeker sustains employment for 12 months with a maximum of four
sustainment fees paid in respect of any client. The JSF is based on Jobseekers sustaining employment at
intervals of 13 weeks, 26 weeks, 39 weeks and 52 weeks.
The number of PPP’s agreed and signed to date is 161,959 which represents the number of people that have
begun JobPath activation engagement. These represent executed outputs for JobPath. Expenditure for
JobPath has increased in recent years as it has become fully established (Figure 10). An evaluation of JobPath
performance is underway that should establish whether the inputs to date have resulted in positive outcomes
under the model (expected completion Q4 2018). Output metrics including frequency of engagements and
caseload per personal advisor are not directly linked to JobPath inputs (expenditure, staffing) as only outcomes
for JobPath determine these under its payment-by-results model. However, outputs would still be useful to
report for comparison across all providers and to provide useful metrics for future PES provision. Despite
reductions in demand for PES, there will remain a cohort of structural LTU and the learnings from JobPath
should help inform future activation policy.
Figure 10 Total JobPath Expenditure to date, Dec 2015 – March 2018
70
58.55
60
JobPath Expenditure € m
50
40
27.79
30
20.49
20
10
2.04
0
2015 2016 2017 Mar-18
Reg Fees JSF Total
Source: DEASP Admin Data
28LES
As demonstrated in Figure 11 and Figure 12, the rollout of JobPath in 2015 and new criteria for LES mediator
caseload resulted in a significant decrease in the number of total LES client engagements for both activation
and non-activation cohorts. Activation engagements decreases from 71,424 in 2015 to 39,984 in 2017 (a 44%
reduction). Similarly over this period, attendees19 decreased from 40,169 to 15,545, a 61% reduction (Figure
11). The non-activation cohort followed this downward trend with engagements falling from 28,004 in 2014
to 9,573 in 2017, a 66% reduction. The number of attendees fell accordingly from 17,228 to 5,000, a 71%
decrease (Figure 12).
This reduction occurred concurrently with the implementation of new caseload targets for LES mediators to
provide a more intensive engagement with clients from mid-2017. Under the replacement basis criteria there
is a maximum caseload per case officer of 120. In 2013, average caseload per mediator was 394 for activation
clients and 195 for non-activation clients. In 2017, average caseload per mediator stood at 181 for activation
clients and 57 for non-activation clients.
Figure 11 LES Activation attendees; engagements; average clients per mediator, 2013 - 2017
80,000 458 467 500
Number of persons/engagements
70,000 450
394
Average Clients per mediator
400
60,000
350
50,000 300
40,000 231 250
181 200
30,000
150
20,000
100
10,000 50
0 0
2013 2014 2015 2016 2017
No. of engagements No. of attendees Average clients per mediator
Source: DEASP admin data
19 Attendees are defined as clients who are referred to LES, who subsequently attend initial GIS or 1-1 meeting.
29Figure 12 LES Non-Activation attendees; engagements; average clients per mediator, 2013 - 2017
50,000 250
45,000 195
Average clients per mediator
No. of people/engagements
40,000 186 200
35,000
30,000 137 150
25,000
20,000 100
15,000 59
57
10,000 50
5,000
- 0
2013 2014 2015 2016 2017
No. of attendees No. of engagements Average clients per mediator
Source: DEASP admin data
Whilst the caseload per mediator has been significantly reduced (approximately 50% reduction in caseload
per mediator), the number of LES mediators and related expenditure (as discussed in section 4) has remained
constant over the period 2013-2017. This period of more intensive engagement does not appear to have
translated into improved outputs. In 2017, LES was not meeting its maximum caseload (currently a yearly
average of 181 per mediator for activation clients) despite large reductions in average caseload per mediator
from 2015. The higher than target caseload per mediator is difficult to assess without further output metrics
including frequency of engagement for clients but could reflect the slower turnover of clients in LES possibly
due to clients staying longer in the programme. Higher caseloads could also suggest that more intensive
engagement for clients is not being realised which could impact their duration and success within the
programme itself. The evidence suggests that there are resource inefficiencies given the reduction in the
target pool of LES clients, the reduced demand for activation services more generally over the period and the
overlap of target client between LES and JobPath.
Job Clubs
Job Clubs referrals, activities and engagements peaked in 2014 before reducing in recent years. Referrals to
Job Clubs has fallen from 13,795 in 2014 to 11,781 in 2017, a 15% reduction. The number of formal workshop
attendees has fallen from 10,136 to 6,946, a 31% reduction and the number of one-to-one engagements has
fallen from 9,365 to 8,258, a reduction of 12% over the 2014 – 2017 period. While staff to client ratio for
referrals are not a basis for operation of Job Clubs in the same way that they are for LES, they are a good
indicator of activity. The average caseload per employee has also reduced with a staff ratio to client referrals
of 188 (a reduction of 14) and staff ratio to client engagements has reduced to 120 (a reduction of 18) as of
2017 (Figure 13).
30You can also read