Spring 2018 VOLUME 12 - Elon University
←
→
Page content transcription
If your browser does not render page correctly, please read the page content below

Visions
Spring 2018
VOLUME 12
VISIONS is Elon’s student-run sustainability journal. Its mission is to
provide an opportunity for students to publish their works that deal with issues in
environmental studies. Visions publishes a variety of Elon student and alumni works,
including research articles, creative writing, poetry, media reviews, photography,
and more. All submissions are reviewed by a team of student editors before
publication. The ultimate goal of Visions is to raise awareness of environmental
issues as well as prompt conversations about sustainability on this campus.

Contributing to VISIONS
Visions seeks compelling and well-written contributions on topics related to the
environment or sustainability. Research articles must be grounded in scholarly
literature, and creative pieces must be original work. All submissions must advance
the goal of the publication.

Submissions for the Spring 2019 volume of Visions are being accepted! Please email
your piece to visions@elon.edu or go to our web page, through Elon’s Office of
Sustainability page, for more information about the criteria for submissions and
information about our journal.

We wish to thank Elon University’s Center for Environmental Studies and the Office
of Sustainability for their support.

Student Editorial Staff                         Production Designers
Bailey Numbers ‘21 Editor-in-Chief              Emily Barger ‘18
Samantha Gardner ‘19                            Julio Dragonetti ‘18
Nicole Hawley ‘21                               Samantha Feher ‘17
Olivia Jacquier ‘20                             Bobby Hoechner ‘18
Soula Kosti ‘18                                 Ellie Moultrup ‘18
Louisa Sholar ‘20                               Jasper Pike ‘18
Georgia Smith ‘19                               Emma Scully ‘18
Sabrina Tuton-Filson ‘19                        Will Timpson ‘18
Kaitlin Welch ‘19                               Sarah Vates ‘18
Jane Williams ‘21                               Zaria Zinn ‘18
Jeff Zoldy ‘18

Faculty Advisors
Scott Morrison - Assistant Professor, Education
Cassandra Kircher - Professor, English
Michele Kleckner - Senior Lecturer, Computing Sciences

                                                                This magazine was printed on Cougar Digital Text
                                                                White. It is Rainforest Alliance Certified and FSC
Cover photo by Jacob
 2 Visions           Staedler ‘19
                Magazine                                        Certified (Forest Stewardship Council.)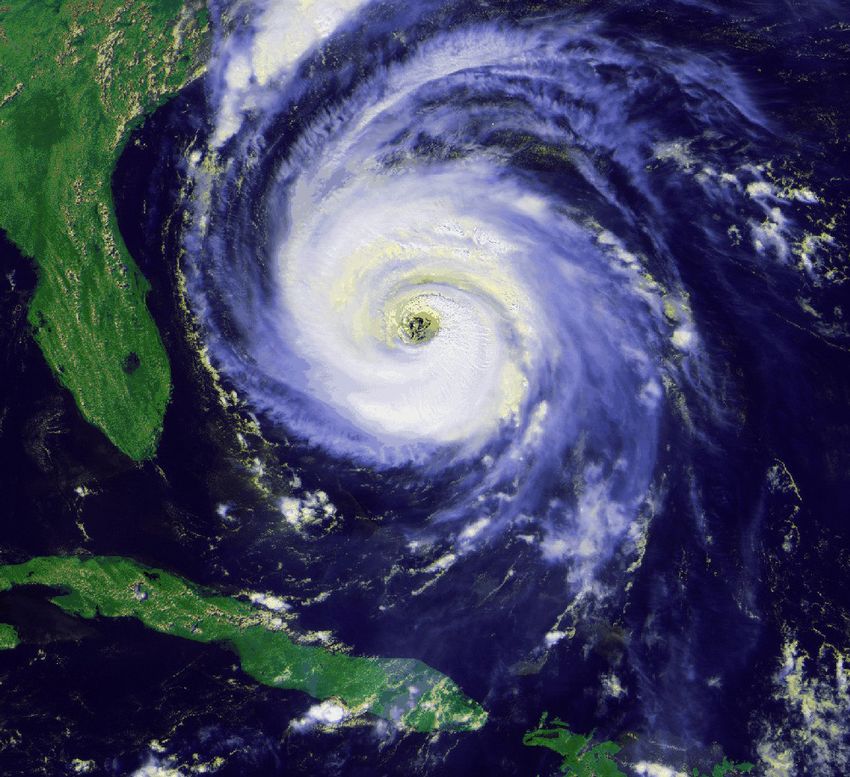
TABLE OF CONTENTS
POETRY
Shades and Cycles 2
A Week in NC 4
Seasonal Changes 22
El Niño 40
The Neighbor’s Chain-Link Fencing 41
BOOK REVIEW
Think Like a Commoner 38
EDITORIAL
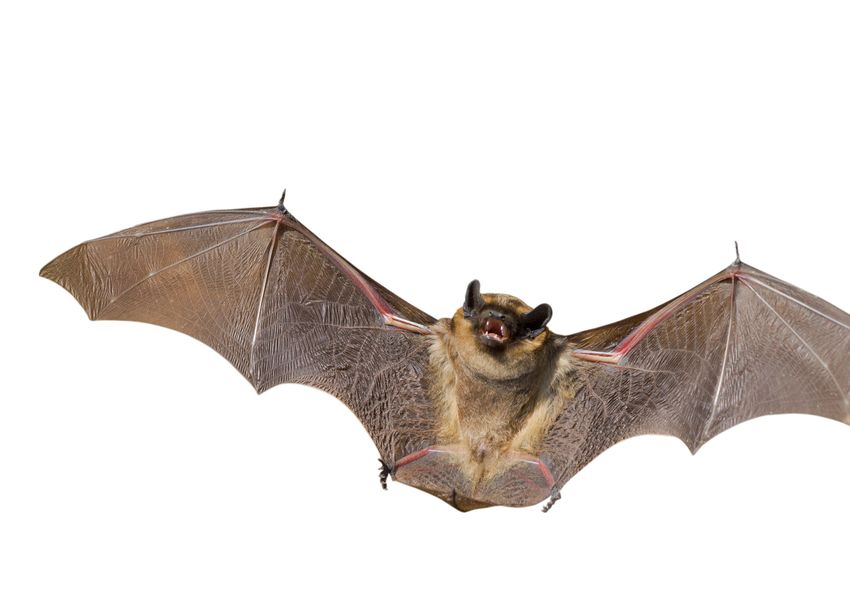
Bats Need Our Help 20
ARTICLES
Distribution of Bat Species Among Texas Eco-Regions 5
Global Warming and Its Impact on Coastal Communities 9
Patterns in the Collection of California Sea Otters 15
Sustainable Development in Ethiopia 23
(Dedicated to Dr. Heidi Frontani)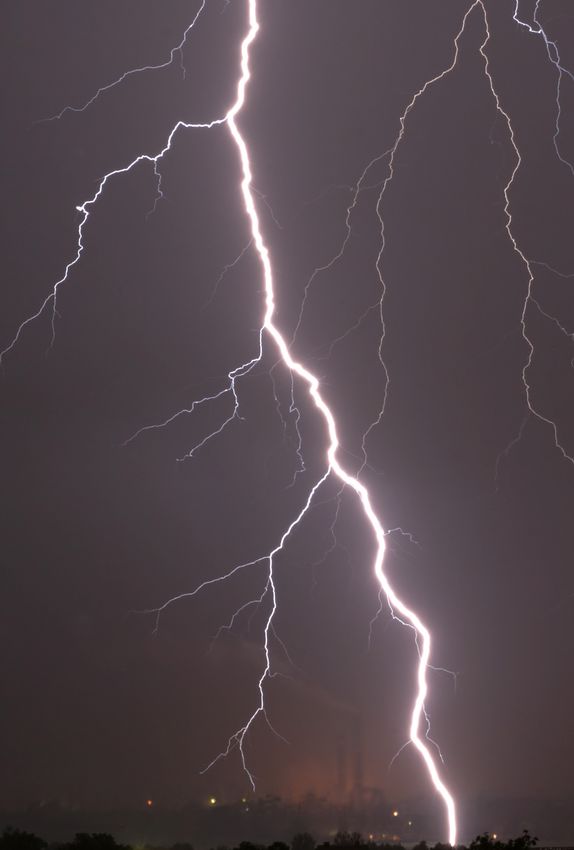
SHADES AND CYCLES OF A BLOOMING SUN
BY ALISSA PARK

1. five months no water           2. in morning’s dewy light

you are my night’s                your fingertips danced
silver air and                    across my skin like lily
your cold uncovered skin          water softly,
my lips’ compulsion               and in bursts
                                  a misting of your warmth
a huddle of expanding breath      upon my cold, freckled
trailing hills in your ribcage,   body
waiting for                       and with sugarcane
a dawn’s soft rising flame        lips you trailed path
                                  from mountain to valley
that in four weeks                slowly carefully
will strip you from               the way a botanist moves
my pale naked hip, make you       from yellow ginger to
my sycamore’s bark                autumn gold
                                  taking time
and threaten to uproot            and taking in
what we have                      each shivering
finally                           breeze from the sun’s
learned how to tend               blushing heat      and now
                                  in morning’s dewy light
                                  sea salt sighs
                                  your name
                                  awaiting reunion
                                  with the ocean’s touch

2 | VISIONS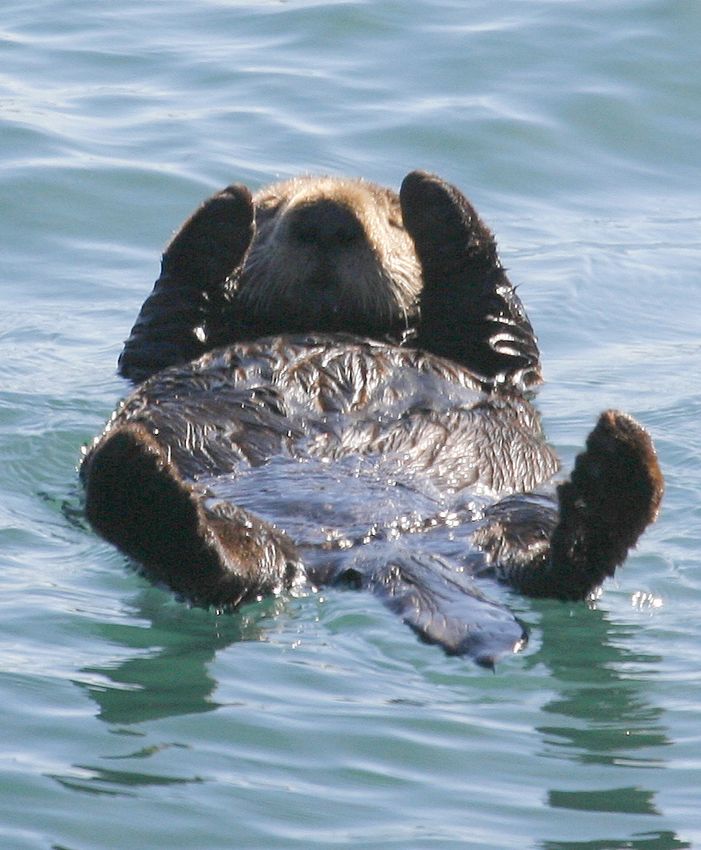
3. six years past

you loved me in that fierce
February winter
snow in a way that brought
the warmth of your skin to
my own
swallowing each
berry-red frosted nip
out to the chill of
the whistles

that even now when
the frozen air hits
the nape of my neck I feel
the soft tingling caress of
the earth’s cold, chapped lips
and the late evening
whiskers of evergreen firs
brush my thigh

as if you became
the heat that left my toes
and the gleam of thin unstable
ice not even pebbles could
rest upon
when you laid me down
on glistening white

and when trees undress
and dew expands across
the morning’s crisp grass and
you are still gone
I find tranquility in the
woodpeckers
those golden-shafted
northern flickers that soar into
our winter

and how they continue to
drum, drum, and drum
drum, drum, and drum
each morning in the sun’s
quiet brightening rise

 Alissa Park ’17 is studying creating writing with a focus in poetry. She is
 originally from Dallas, Texas.
                                                                               Image courtesy of Bethan via Flickr.com

                                                                                                 SPRING 2016 | 3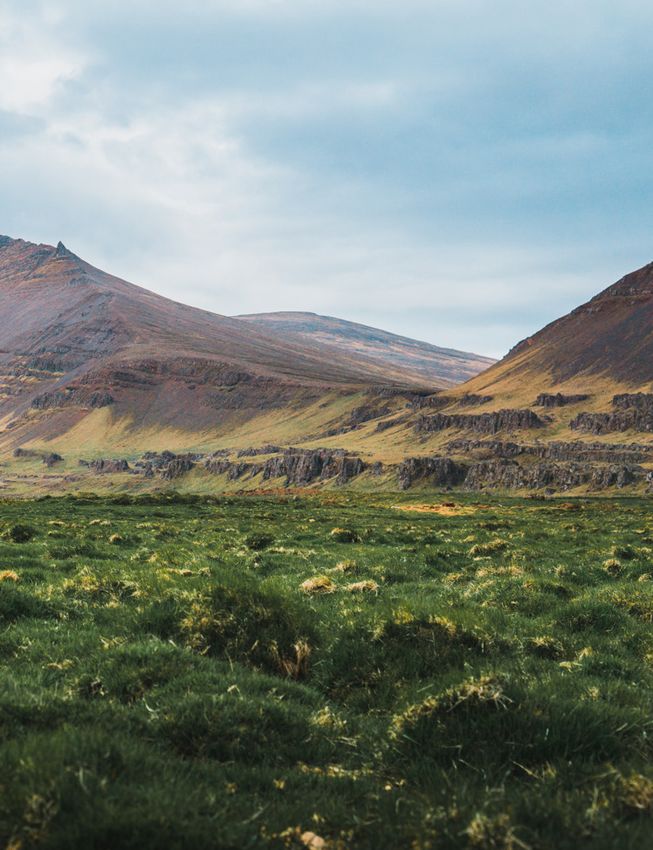
A WEEK IN NC
BY CHUCKIE HAWES

1. Air
When budding breath floats ‘cross the sill
through windows warmed by sun,
prompting the hint of rainstorms chill
and sodden earth to come.

2. Earth
Until a blazing solstice high
above will crack the dirt:
the children play with kites a-sky
as hydrants spit and snort

3. Fire
like leaves from trees that coat the ground,
while warmer drinks are brewed
near rustic fires beneath the sound
of northers brewing too.

4. Water
From cobalt clouds the snow may fall
and fly on teething wind
to freeze the land and so forestall
the thaw to come again.

                                               Chuckie Hawes ‘17 is a double English Lit.
                                               and Cinema and Television Arts major from
                                               Charlotte, NC. He is an Elon Honors Fellow
                                               who enjoys camping, hiking, and adventuring
                                               in the outdoors.
                                                                       Image courtesy of Sharon via Flickr

4 | VISIONS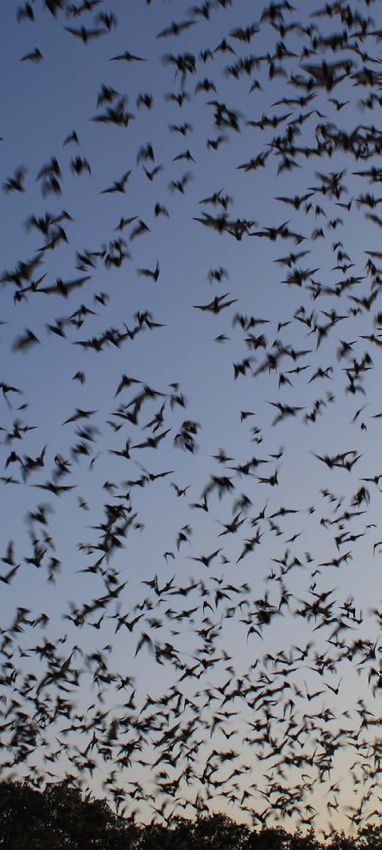
DISTRIBUTION OF BAT SPECIES AMONG TEXAS
ECO-REGIONS
BY CASSIDY LEVY

        Wind energy is a growing source of                     Bats    contribute    to   the    ecosystem
American electricity; however, it can have adverse     processes and mammalian diversity in North
effects on bat and other wildlife populations.         America (Hayes 2013). However, wind farms have
There is a need for a greater understanding of the     been found to kill bats at higher rates than other
relationship between land cover and eco-regions        tall human-made structures (Arnett et al. 2008).
and bat activity to identify ways to decrease          This is believed to be because of bats attempting
the impact of wind turbines on bat populations.        to roost on turbines and the high availability
I began to explore this relationship in Texas on       of prey around turbines (Arnett et al. 2008). A
a statewide scale by comparing bat species             review of bat fatality studies found that 11 of 45
distributions to defined eco-regions. I found that     species of bats living in the United States and
bat species were not evenly distributed through        Canada were found dead at wind farms (Arnett
Texas, with the most species occurring in Texas’       et al. 2008). Estimates for bat fatalities in the
westernmost       eco-region  of Trans-Pecos. The      United States range from 1.2 collisions/turbine/
creation of wind farms should concentrate on the       year to 46.3 collisions/turbine/year in different
Gulf Coast Prairies and Marshes and Backland           regions (Kuvlesky et al. 2007). There are methods
Prairie eco-regions, which had fewer bat species,      that attempt to minimize bat fatalities at wind
in order to avoid collisions.                          sites. The FAA recommends red strobe lights,
                                                       although they have not been found to be effective
INTRODUCTION                                           against bat fatalities (Arnett et al. 2008). While
         Wind farms are a growing source of energy     acoustic “repellers” have not been found to be
in the United States with a projected 42,000           effective, research is beginning to show that
MW capacity (Brannstrom et al. 2011). Wind             ultrasound    broadcasts   may    discourage    bats
energy is seen as a way to decrease dependence         from approaching wind turbines (Arnett et al.
on fossil fuels and their inherent environmental       2013).
damage (Kunz et al. 2007). The U.S. Department
of Energy’s goal is for 20% of electricity to be
generated by wind by 2030 (Brannstrom et al.
2011). However, wind energy is not without its
faults.
         Wind    farms     can       damage wildlife
populations. The creation of wind turbines alters
habitat, which can affect wildlife populations
(Kuvlesky et al. 2007). Construction of wind
farms can introduce exotic species, and the
creation of service roads also creates barriers
to some species and leads to increased wildlife
collision (Kuvlesky et al. 2007). Wind farms
also affect birds because they collide with the
turbines; however, the effects of turbines on
birds have been studied widely (Kuvlesky et al.
2007). Research into bat collisions with wind
turbines began as bird researchers discovered
bat fatalities, so this is a relatively new and
understudied topic (Kuvlesky et al. 2007).
                                                       Image courtesy of Giles San Martin via Flickr.com

                                                                                                           SPRING 2016 | 5
Identifying where bat fatalities occur                                           MATERIALS AND METHODS
can help reduce these fatalities with mitigation                                                   The main sources of data for this research
strategies (Arnett et al. 2008).           Localized                                      were existing records of the USGS Gap Analysis
searches at individual wind farms have been                                               Program and the Texas Natural Resources
conducted but have found no connection                                                    Information     System      (TNRIS).   USGS     provided
between land cover within 100m of the turbine                                             species distribution data for 16 of the 33 bat
or distance to wetlands and bat fatalities (Arnett                                        species present in Texas as can be seen in Table
et al. 2008).       However, there has been very                                          1. The data shows the environment where the
little larger scale research on bat activity, and                                         species is likely to be found in a raster, meaning
therefore potential fatalities, in regards to land                                        that each cell was either positive for the species
cover, elevation, or eco-region. Research has                                             and colored, or negative and colorless. Presence
identified that quantifying bat activity with land                                        data for the remaining species was unavailable
cover to be an important step towards the goal                                            from USGS, so those species were left out of the
of minimizing bat fatalities at wind farms (Kunz                                          maps and analysis. A shapefile with the eco-
et al. 2007). This is especially important because                                        regions in Texas was downloaded from TNRIS.
some bat species are already at risk because of                                           The shapefile was created by Texas Parks and
habitat destruction and fragmentation (Davidai                                            Wildlife GIS Lab from plant ecology field work.
et al. 2015). By looking at the distribution and                                                   The bat distribution data and eco-
diversity of bat species, future research on bat                                          region data was uploaded and formatted using
abundance and activity can be best targeted to                                            ArcMap. The bat distribution data for each of
areas with the most potential.                                                            the species were overlaid to create a map that
         Texas has been the leading state in wind                                         shows the different densities of bat species
energy production since 2000 with nearly one                                              present across Texas within the boundaries of
quarter of the United States’ projected wind                                              each of the eco-regions. The three threatened
capacity (Brannstrom et al. 2011). Texas also                                             species whose distributions were available were
contains multiple eco-regions and 33 species                                              also highlighted in a third map.
of bats (Ammerman 2012). Therefore, the goal
of this research is to identify bat distributions                                         RESULTS AND DISCUSSION
among eco-regions in Texas.                                                                       Figure 1 shows the 11 Texas eco-regions
Table 1 Bat species in Texas used in this analysis.
                                                                                          that were used in this study. In Figure 2, there
                                                               Used in    Threatened or   appear to be more species present in the western
Scientific Name             Common Name                        Analysis   Endangered      half of Texas than the eastern half. Figure 2
Mormoops megalophyll        Ghost-faced Bat                    No         No
Choeronycteris mexicana     Mexican Long-tongued Bat           No         No              also shows that there appear to be few species
Leptonycteris nivalis       Mexican Long-nosed Bat             No         Endangered      with distributions along the Gulf Coast. No eco-
Diphylla ecaudata           Hairy-legged Vampire               No         No
Myotis austroriparius       Southeastern Myotis                No         No              region has a uniform distribution of bat species,
Myotis californicus         California Myotis                  Yes        No              although the Trans Pecos and Piney Woods have
Myotis ciliolabrum          Western Small-footed Myotis        Yes        No
Myotis occultus             Southwestern Little Brown Myotis   No         No              the most uniform distributions. Figure 3 shows
Myotis septentrionalis      Northern Long-eared Myotis         No         No              the distribution of the three threatened species
Myotis thysanodes           Fringed Myotis                     Yes        No
Myotis velifer              Cave Myotis                        Yes        No              separate     from     the     non-threatened   species.
Myotis volans               Long-legged Myotis                 Yes        No              It illustrates that the threatened species are
Myotis yumanensis
Lasiurus blossevillii
                            Yuma Myotis
                            Western Red Bat
                                                               Yes
                                                               Yes
                                                                          No
                                                                          No
                                                                                          present in different eco-regions. Lasiurus ega
Lasiurus borealis           Eastern Red Bat                    No         No              is primarily in South Texas Brush Country,
Lasiurus cinereus
Lasiurus ega
                            Hoary Bat
                            Southern Yellow Bat
                                                               No
                                                               Yes
                                                                          No
                                                                          Threatened
                                                                                          Corynorhinus rafinesquii is found primarily in
Lasiurus intermedius        Northern Yellow Bat                No         No              the Piney Woods, and Euderma maculatum is
Lasiurus seminolus
Lasiurus xanthinus
                            Seminole Bat
                            Western Yellow Bat
                                                               Yes
                                                               Yes
                                                                          No
                                                                          No
                                                                                          found primarily in the Trans Pecos eco-region.
Lasionycteris noctivagans   Silver-haired Bat                  Yes        No                      The largest assemblage of bat distributions
Parastrellus hesperus
Perimyotis subflavus
                            American Parastrelle
                            American Perimyotis
                                                               No
                                                               No
                                                                          No
                                                                          No
                                                                                          to protect is in the Trans Pecos region in western
Eptesicus fuscus            Big Brown Bat                      No         No              Texas, which had several areas with nine species
Nycticeius humeralis
Euderma maculatum
                            Evening Bat
                            Spotted Bat
                                                               No
                                                               Yes
                                                                          No
                                                                          Threatened
                                                                                          present. The Piney Woods eco-region was lighter
Corynorhinus rafinesquii    Rafinesque's Big-eared Bat         Yes        Threatened      than much of central and western Texas but
Corynorhinus townsendii     Townsend's Big-eared Bat           Yes        No              had      more bat distributions than other eco-
Antrozous pallidus          Pallid Bat                         Yes        No
Tadarida brasiliensis       Brazilian Free-tailed Bat          No         No              regions in eastern Texas. While the Piney Woods
Nyctinomops femorosaccus    Pocketed Free-tailed Bat           Yes        No              region does not have as many species present as
Nyctinomops macrotis        Big Free-tailed Bat                Yes        No
Eumops perotis              Western Mastiff Bat                No         No

6 | VISIONS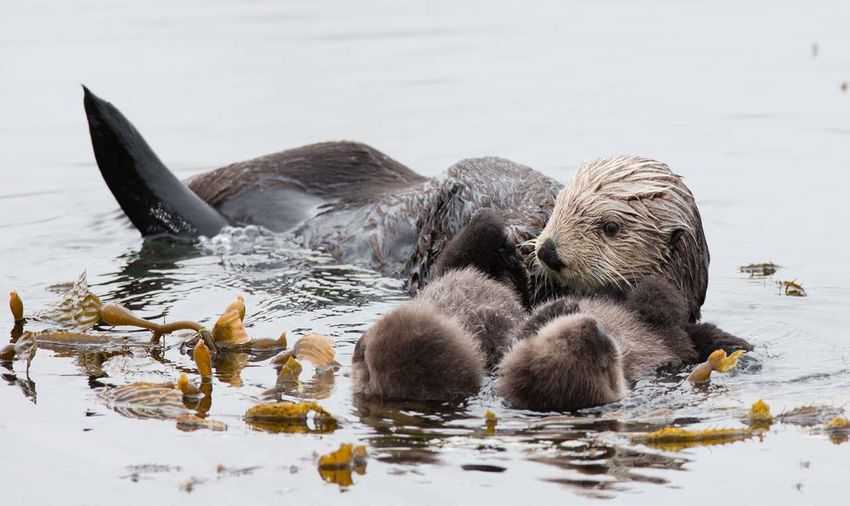
some of the western eco-regions, it is important
                                                                  to consider that it is likely home to a completely
                                                                  different assemblage of species because of its
                                                                  different   habitat,   since      landscape elements
                                                                  have an effect on bat activity and bat species
                                                                  composition (Heim et al. 2015). Therefore, it is
                                                                  important to protect this region as well because
                                                                  species present there are likely not found in
                                                                  the Trans Pecos region. Wind farm developers
                                                                  should consider both the number of species and
                                                                  which species may be affected when determining
                                                                  where to build new wind farms. However, it is
                                                                  important to note that this study looked at bat
                                                                  diversity rather than species abundance, which
                                                                  would also influence how bat species would be
Figure 1 showing the 11 Texas eco-regions used in this study      impacted by wind farms. Threatened species
                                                                  were present in the Trans Pecos, Piney Woods,
                                                                  and South Texas Brush Country eco-regions.
                                                                  This is consistent with the consideration of
                                                                  different species assemblages and furthers the
                                                                  case towards protecting these eco-regions.
                                                                          Based on this data, wind farms within
                                                                  Texas should concentrate within the Backland
                                                                  Prairie, Gulf Coast Prairies and Marshes, and
                                                                  western Oak Woods and Prairies to minimize
                                                                  interference with bats. However, other factors,
                                                                  such as wind speeds, the price of land, human
                                                                  population, protected wetlands, and bird species,
                                                                  will influence where it may be most feasible to
                                                                  create wind farms within these regions. With the
                                                                  coast showing fewer species, it may be worth
                                                                  examining offshore wind options in the Gulf
                                                                  of Mexico. Regions with similar types of land
                                                                  cover and habitat in other states may also be
Figure 2 showing spieces distribution along the gulf coast        good places to start when searching for land to
                                                                  create wind farms; however, further research is
                                                                  required.
                                                                          Larger scale field research is necessary
                                                                  for more precise analysis with bat activity and
                                                                  abundance and not just bat distribution, which
                                                                  was one of the major limitations of this study.
                                                                  This study also did not account for the fact that
                                                                  one species had some distribution only during
                                                                  the summer, or the migratory status of the
                                                                  species, and was limited to the 16 species with
                                                                  distribution data available from the Gap Analysis
                                                                  Program. There is a need for more research
                                                                  looking at different species in different regions
                                                                  for a more accurate estimate of bat activity
                                                                  throughout the United States. Field research in
                                                                  predetermined eco-regions or areas of land cover
Figure 3 showing the distribution of threatened species against   would also allow for statistical analysis of the
non-threatened species                                            data that was impossible in this case.

                                                                                                       SPRING 2016 | 7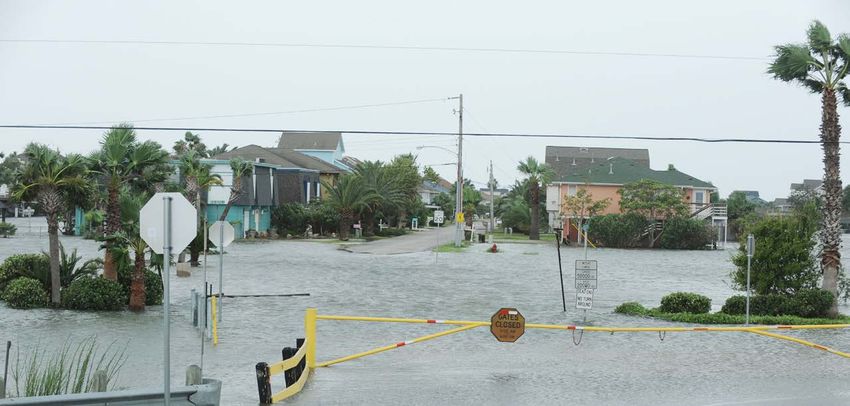
REFERENCES

Ammerman, L.K., Hice, C.L., & Schmidly, D.J. (2012) Bats
of Texas. Available at: http://www.batsoftexas.com/

Arnett, Edward B., W. Brown, Wallace P. Erickson, Jenny
K. Fiedler, Brenda L. Hamilton, Travis H. Henry, Aaftab
Jain et al. “Patterns of bat fatalities at wind energy facilities
in North America.” The Journal of Wildlife Management72,
no. 1 (2008): 61-78. http://dx.doi.org/10.2193/2007-221

Arnett, Edward B., Cris D. Hein, Michael R. Schirmacher,
Manuela MP Huso, and Joseph M. Szewczak. “Evaluating
the effectiveness of an ultrasonic acoustic deterrent for
reducing bat fatalities at wind turbines.” PloS one 8, no. 6
(2013): e65794

Brannstrom,      C.,   Jepson, W. & Persons, N. “Social
perspectives on wind-power development in west Texas.”
Annals of the Association of American Geographers 101,
no. 4 (2011): 839-851.

Davidai, Noa, John K. Westbrook, Jean-Philippe Lessard,
Thomas      G.   Hallam,     and     Gary   F.   McCracken. “The
importance of natural habitats to Brazilian free-tailed bats
in intensive agricultural landscapes in the Winter Garden
region of Texas, United States.” Biological Conservation
190 (2015): 107-114. doi:10.1016/j.biocon.2015.05.015

Hayes, Mark A. “Bats killed in large numbers at United
States wind energy facilities.” BioScience 63, no. 12 (2013):
975-979. doi:10.1525

Heim, Olga, Julia T. Treitler, Marco Tschapka, Mirjam
Knörnschild,     and      Kirsten    Jung. “The        Importance of
Landscape Elements for Bat Activity and Species Richness
in Agricultural Areas.” PloS one 10, no. 7 (2015): e0134443.

Kunz, Thomas H., Edward B. Arnett, Wallace P. Erickson,
Alexander R. Hoar, Gregory D. Johnson, Ronald P. Larkin,
M. Dale Strickland, Robert W. Thresher, and Merlin D.
Tuttle. “Ecological Impacts of Wind Energy Development
on Bats: Questions, Research Needs, and Hypotheses”.
Frontiers in Ecology and the Environment 5, no. 6 (2007):
315–324. http://www.jstor.org/stable/20440676.

Kuvlesky, William P., Leonard A. Brennan, Michael L.
Morrison, Kathy K. Boydston, Bart M. Ballard, and
Fred C. Bryant. “Wind energy development and wildlife
conservation: challenges and opportunities.” The Journal of
Wildlife Management 71, no. 8 (2007): 2487-2498. http://
dx.doi.org/10.2193/2007-248

Cassidy Levy ‘17 is a Junior from Chicago with an
Environmental and Ecological Science major and a
minor in Geographic Information Systems. She is
particularly interested in biogeography.

                                                                       Image by USFWS/Ann Froschauer via Flickr.com

8 | VISIONS
GLOBAL WARMING AND ITS IMPACT ON
COASTAL COMMUNITIES
BY KATHRYN RUE
On October 29, 2012, Hurricane Sandy average wave heights were 32.5 feet, with a
made landfall in the United States (University of maximum storm surge of 13.8 feet produced
Rhode Island, 2015). Commonly referred to as along some portions of the New Jersey coastline
“hurricane” by most individuals in the United (Freedman, 2012; Stirling, 2012). Conditions
States, the storm itself had downgraded to a were optimal for destruction during the height
tropical storm upon making its arrival on United of Sandy’s landfall. A full moon was present
States soil. Initially forming in the Caribbean Sea leading to overall higher tides, a high storm surge
on October 19, 2012, Sandy quickly gathered was predicted and occurred, and the average
strength and grew to be the second largest tropical high tide was predicted to be 20% higher than
storm to ever make landfall in the United States normal due to the direction the storm took when
(Freedman, 2012; Sharp, 2012). The storm’s approaching landfall (Sharp, 2012).
eventual convergence with a low pressure extra- As Sandy developed, it became clear that
tropical disturbance is what ultimately led to the this was no ordinary storm. Typically, extra-
storm adopting the nickname of “Superstorm tropical disturbances impact the Northeastern
Sandy” (Hall, 2015). The effects of the storm United States as they move parallel to the coast.
could be felt for 1000 miles, in all directions, Ordinary storms tend to move in a northward
from the center of the storm with the damage fashion, simply grazing the coastline. Sandy,
field ranging from as far south as Florida and on the other hand, was a rare exception to this
as far north as Maine (Billion-Dollar Weather/ normal pattern. As shown in Figure 1, the storm
Climate Disasters, 2013). approached the coastline almost perpendicular
to it, taking a complete left turn before slamming
head on into New Jersey (Toro, 2013). The
direction of Sandy’s approach directly affected
the severity of the coastal flooding, beach erosion,
and storm surge impacts that Sandy had on
coastal environments lining the northeastern
seaboard (Toro, 2013).
This paper focuses on defining how the
New Jersey coastline will be affected by future
storm surges both in relation to the directionality
and strength of storms in combination with the
ever present issue of sea level rise. It is crucial
to define the elements of climate change and sea
level rise and how they interact with hurricanes
and extra-tropical disturbances. Describing how
coastal populations in New Jersey and other
states will be affected by these components
Causing between $65 and $80 billion in in future scenarios and how they will manage
damages throughout the country, Sandy was future flooding events will also be introduced.
recorded as being the second costliest storm,
second to Hurricane Katrina, in U.S. history CLIMATE CHANGE AND SEA LEVEL RISE
(Billion-Dollar Weather/Climate Disasters, Throughout its history, the Earth has gone
2013). Sandy achieved a record-breaking through a series of alternating climate changes.
barometric pressure reading of 940 millibars Scientists have determined that significant
for a storm affecting the Northeastern portion of natural climatic changes develop on a time scale
the United States (Freedman, 2012). The highest of approximately 100,000 years (England, 2012).
SPRING 2016 | 9In the grand scheme of things, 100,000 years is that human activities over the past 250 years
a relatively short period of time. Earth has been have warmed our planet” (EPA, 2015). Over the
around for nearly 4.5 billion years (England, past century, the Earth has experienced a 1.5°F
2012). Temperatures have varied from intense increase in atmospheric temperature (EPA,
cold to extreme heat. These temperature changes Climate Change: Basic Information, 2015).
have affected every environmental aspect of the Predictive studies show that the temperature
Earth, most notably the shifting of precipitation will continue to increase throughout this century
patterns, growth and retreat of huge ice fields, and well into the next. The consequences of
and the dramatic rise and fall of sea level. These warming temperatures, referred to as global
past pattern changes are naturally occurring. warming, include ocean acidification, shrinking
However, the current climatic trend reveals a ice sheets, glacial retreat, declining arctic sea
speed-up in the processes which cause climate ice, warming oceans, increased observance of
change, a change attributed to anthropogenic extreme weather events, and sea level rise (NASA,
influences. Climate Change: How do we know?, 2015).
Anthropogenic climate change, which It has been observed that global sea levels
is caused by humans, is fueled by the release have risen between four and eight inches in the
of greenhouse gases into the atmosphere. past century (National Geographic, Sea Level
The major greenhouses gases added into the Rise, 2015). As greater amounts of scientific
atmosphere on a daily basis include carbon research have been conducted on this topic, it
dioxide, methane, nitrous oxide, tropospheric can be observed that sea level rise predictions
ozone, and chlorofluorocarbons (EPA, 2015). tend to vary from one research source to the next
As these gases are released, a build-up of their (Gregory, 2013). The heights of both the land and
combined energy reserves remain trapped in the sea are rising and falling at different levels
the atmosphere (EPA, Climate Change Basic in various geographic locations throughout
Information, 2015). This build-up of atmospheric the world leading to decreased accuracy in
greenhouses gases slows the release of the future water level predictions (Gregory, 2013).
Earth’s heat, via infrared radiation, to space and Annually, global average oceanic levels have
leads to an extensive warming of the Earth (EPA, risen 0.13 inches/year in the past 20 years
2015; EPA, Climate Change Basic Information, (National Geographic, Sea Level Rise, 2015). This
2015). Of the gases mentioned, carbon dioxide increase is predicted to continue as the ocean
is by far the most harmful greenhouse gas being continues to absorb heat from the atmosphere.
added today. Its present worldwide average In total, 80% of all heat energy produced via
concentration is approximately 400 parts per fossil fuels is absorbed into the oceans (National
million, a 27% increase from the 1958 recording Geographic, Sea Level Rise, 2015). As the ocean
of 315 parts per million (NASA, 2015). absorbs heat, the water expands in a process
Carbon dioxide is known to be the known as thermal heat expansion. Thermal
primary greenhouse gas contributing to climate (heat) expansion, as well as the addition of water
change (EPA, 2015). It is found naturally in from the melting of glaciers and ice sheets,
the atmosphere, biosphere, hydrosphere, will result in an overall rise in sea level for the
and geosphere and it can be released through foreseeable future if global warming continues
volcanic eruptions as well as plant and animal (National Geographic, Sea Level Rise, 2015).
respiration processes (EPA, 2015). Additionally, While scientists have concluded global
large quantities of carbon dioxide are released sea level will continue to rise well beyond the
into the environment via the burning of fossil year 2100, it is uncertain exactly how much the
fuels (EPA, 2015). Conclusive evidence of climate current level will change (Gregory, 2013). For
change shows “natural causes do not explain example, one researcher expects a 2.5 to 6.5
most observed warming, especially warming foot increase by 2100 while another researcher
since the mid-20th century” (EPA, 2015). predicts only one foot of increase within the
Since the dawn of the Industrial Revolution same time frame (Appenzeller, 2007; National
in the 1750s, global energy consumption Geographic, Sea Level Rise, 2015). Other
through the use of fossil fuels has skyrocketed. predictions claim that the Earth will see a 7 foot
Research presented by the United Nations (UN) increase by 2100 and yet another claims that the
shows there is “a more than 90% probability Earth will only see 1.3 to 3.9 feet of sea level rise
10 | VISIONS(Rutgers University, Is Sea Level Rising, 2013;
Sutter, 2015). This range of predictions makes it
very difficult to gain a complete understanding
of what to expect by the end of the century.
Regardless of the exact increase in sea level
“the process is irreversible. Global warming will
continue” (Appenzeller, 2007).
Although in disbelief now, coastal
populations must begin to plan how they will
adapt to encroachment of a rising sea. As sea
level rises, it has been predicted that “Hundreds
of thousands of square miles of land could be
drowned… displacing tens of millions of people”
(Appenzeller, 2007). Studies estimate that 147
to 216 million people globally will be directly
affected by the warming and rising of ocean
waters (Sutter, 2015).
HURRICANES
Hurricanes are slow moving rotational
low pressure systems that form over warm
bodies of water (NOAA, What is a hurricane?,
2015; Hurricanes: Engines of Destruction,
2013). These low pressure systems go by
several interchangeable names. Hurricanes
typically form in the Atlantic Ocean region
whereas typhoons form in the Western Pacific
and cyclones form in the Indian Ocean region.
Image courtesy of NOAA/National Climatic Data Center
Whether referred to as a hurricane, typhoon,
or cyclone, these low pressure systems are or even move in unpredicted paths typically away
increasing in both strength and severity as global from the shoreline (University of Rhode Island,
temperatures continue to rise (NOAA, 2015). 2015). If the jet stream is encountered when
The path of a hurricane is influenced by the traveling northward, a hurricane will accelerate
directionality of global wind patterns (University very quickly and gain more strength as it moves
of Rhode Island, 2015). Hurricane propagation, towards the north, northeast, or eastern United
or movement of a hurricane from one place to States (University of Rhode Island, 2015).
another, tends to follow the direction of the global Beginning as a tropical disturbance,
wind field (University of Rhode Island, 2015). In hurricanes are capable of transforming
most cases, hurricanes move westward whether themselves from a minor tropical depression
forming in the Gulf of Mexico, Caribbean Sea, or with 23 mph winds, to a more serious tropical
Tropical Atlantic. This is due to the trade winds storm with sustained winds of 39 mph, into a
at these latitudes (15-30°N) and work to steer potentially devastating hurricane exceeding wind
storms to the west (University of Rhode Island, speeds of 74 mph (Moran, 2015). A hurricane
2015). The presence of high pressure systems, will likely form if high sea surface temperatures
typically the Bermuda High, causes hurricanes to are present, winds are present to some degree,
deviate northward from their originally planned and an adequate Coriolis Effect is in place
east to west path. As hurricanes move into higher (Moran, 2015). The Coriolis Effect takes place
latitudes, the overall wind field becomes weaker. due to the deflection of winds to the right from a
Continued northward movement of hurricanes high pressure system to a low pressure system
is reliant upon the presence of both high and in association with the rotation of the earth in
low pressure fields in the mid-latitudes (30- the Northern Hemisphere (National Geographic,
60°N). Without the presence of a pressure field, 2015). Hurricanes tend to be characterized
hurricanes will become weak, slow down, stall, by strong winds, high seas, extreme rainfall,
SPRING 2016 | 11Image courtesy of FEMA/Joeclyn Augustino
and tornadoes. They are capable of developing living in the path of the storm (Moran, 2011).
immense strength and can cause considerable While winds are capable of creating a significant
damage wherever they strike and particularly to amount of structural damage on land, it is
human inhabited regions throughout the world. important to note that varying oceanic conditions
Structurally, a hurricane is made up of an including waves, tides, and surges in addition
eye, eye wall, and outer bands (National Weather to wind speeds heavily influence the water level
Service, 2005). The eye is an area of sinking low associated with the storm (NOAA, Tides and
pressure that is characterized by calm and clear Water Levels, 2008).
weather conditions (National Weather Service, Winds blowing over the ocean create a
2005). The eye wall is found to be the strongest frictional drag that moves surface waters (Moran,
part of a hurricane. Heavy rain, winds, and the 2011). Winds can influence tidal heights. They
formation of tornadoes can be monitored in this also produce or lead to storm surges, which
portion of the storm (National Weather Service, are classified as the most devastating coastal
2005). Naturally, hurricanes will be less severe, component of any hurricane. A storm surge
or intense, with increased distance from the is characterized by an abnormal rise of water,
eye (National Weather Service, 2005). The outer which is typically generated by a storm (NOAA,
bands of a hurricane are characterized by small 2013). Storm surges often pose the greatest
bands of non-severe rain storms with minimal threat to life and property during the landfall of
winds. No two hurricanes are exactly the same a hurricane (National Hurricane Center, 2014;
and on average an estimated 10 to 15 significant Moran, 2011). Flood events and storm surges
hurricanes will form worldwide on a yearly basis are responsible for a considerable portion of the
(Hurricanes: Engines of Destruction, 2015). destruction produced during a hurricane with
Hurricane wind speeds are measured 90% of all hurricane-related deaths being due to
on the Saffir-Simpson Hurricane Wind Scale. excessive storm surges (Hurricanes: Engines of
Initially developed in 1975, this scale classifies Destruction, 2015).
hurricanes into five differing categories (Moran,
2011). Each category is based on a specific COASTAL EROSION AND STORM SURGE
wind speed range with “1” being the least Coastal beach erosion via the powerful
severe and “5” being the most severe (Moran, forces produced by the ocean, occur after almost
2011). By monitoring wind speeds, forecasters every flood or storm-related event. Coastal
and researchers attempt to predict how much erosion occurs when waves and currents strip
property damage will occur for individuals sand from beaches (USGS, 2015). During the
12 | VISIONSerosive process, larger particles of sand are Additionally, there are currently 175 water
carried away from beaches and deposited in level stations located in U.S. coastal waters and
large sand bars out at sea. While these particles several High Water Marks, or lines drawn on
can return to land via deposition during calm infrastructure to mark high elevation levels of
weather conditions, the beach replenishment water rise, used to measure storm surges (NOAA,
process takes significantly longer than the erosion Storm Surge Frequently Asked Questions,
process (Erosion and Deposition by Waves, 2013). In regards to climate change from global
2015; USGS, 2015). Erosion can be particularly warming, it has been predicted as sea level
damaging to coastal environments when rises the overall vulnerability of coastlines to
naturally made dunes in various landscapes are destruction from water inundation will increase
destroyed. Dunes serve as protective barriers (Rutgers University, How Does Sea Level Rise
for human developed infrastructure (USGS, and Storm Surge Interact?, 2013).
2015). Erosion of dunes occurs during higher
than normal flooding or surge induced events A RISING SEA AND MORE SEVERE STORMS
ultimately decreasing the overall volume and Research has shown that if sea level were
elevation of the dunes (USGS, 2015). to rise one foot, storm surges could be responsible
Research has shown both the frequency for a 36% to 58% increase in damages produced
and severity of natural disasters will increase (Rutgers University, How Does Sea Level Rise and
as global warming continues (NOAA, 2015). As Storm Surge Interact?, 2013). Even more severe,
natural disasters such as hurricanes develop with a three foot rise in sea level, a predicted 102%
more frequently as a direct result of climate to 200% increase in coastal damages will occur
change, coastal communities will be at risk of (Rutgers University, How Does Sea Level Rise
experiencing greater than usual storm surges. and Storm Surge Interact?, 2013). New Jersey is
Significant storm surges are known to be the one of the most densely populated states in the
single greatest threat to life and property from a U.S. (Greenberg et al, 2014). With a strong desire
hurricane as it approaches and makes landfall to live near the coastline and antiquated policies
(National Hurricane Center, 2014). A storm that do not allow for coastal infrastructural
surge occurs when the strong winds push sea adaptations to occur, it can be concluded that
water toward the coast, raising the water level development along the New Jersey shoreline
15 feet or higher (NFIP, 2015). Storm surges are will be susceptible to significantly more flood
characterized by an extreme rise in water level destruction during future storm events. With
determined by the following hurricane factors: this being said, various other coastal locations
strength, speed, size, angle of approach to including Virginia Beach, Charleston, and
coastline, central pressure, width and slant of the Savannah, amongst many others, will develop
continental shelf and beach slope, as well as the a greater susceptibility to receive flood-related
natural characteristics and features of already damages as the sea level continues to rise in
established coastlines (National Hurricane future years. While a major hurricane has not
Center, 2014; NOAA, Storm Surge Frequently directly affected these locations, there is still a
Asked Questions, 2015). Storm surges are high likelihood that various coastal locations
amplified during the presence of naturally that have remained unharmed in recent years
occurring high tides particularly during a full could be drastically impacted by a major flooding
or new moon (National Hurricane Center, 2014; event sometime in the near future.
Rutgers University, 2013). Statistically, 52% of United States
Storm surge is not easy to predict. The citizens live in one of the country’s 673 coastal
Sea, Lake, and Overland Surges from Hurricanes communities (NOAA, 2015). With nearly half the
(SLOSH) model, developed by the National country’s population living along the coastline,
Oceanic and Atmospheric Administration (NOAA, there is sure to be high levels of structural
Storm Surge Frequently Asked Questions, 2013), damage produced via storm surges, natural
helps researchers, forecasters, and emergency disasters, erosion, and sea level rise. As climate
managers predict how powerful storm surges change continues and as the global population
will be as well as provides a potential coastal grows, the further development of coastlines
inundation risk assessment plan (NOAA, Storm will be put at greater risk for destruction via the
Surge Frequently Asked Questions, 2013). advances of nature.
SPRING 2016 | 13REFERENCES National Weather Service (October 19, 2005). Tropical
Cyclone Structure. JetStream – An Online School for
Appenzeller, T. (2007). The Big Thaw. National Geographic. Weather. National Oceanic & Atmospheric Administration.
Billion-Dollar Weather/Climate Disasters: Overview. (2013). NFIP. (2015). Flooding & Flood Risks. Retrieved November
Retrieved November 24, 2014, from National Oceanic and 2015, from National Flood Insurance Program: https://
Atmospheric Administration: http://www.ncdc.noaa.gov/ w w w. f l o o d s m a r t. g ov / f l o o d s m a r t / p a g e s / f l o o d i n g _ f l o o d _
billions risks/ffr_overview.jsp
England, J. (2012). High Tide on Main Street. New York: NOAA. (2008, March 25). Tides and Water Levels. Retrieved
The Science Bookshelf. October 2015, from National Oceanic and Atmospheric
Administration: http://oceanservice.noaa.gov/education/
EPA. (2015, September 3). Causes of Climate Change. kits/tides/tides08_othereffects.html
Retrieved September 2015, from United States
Environmental Protection Agency: http://www3.epa.gov/ NOAA. (2013, June 3). Storm Surge Frequently Asked
climatechange/science/causes.html Questions. Retrieved October 2015, from National
Hurricane Center: http://www.nhc.noaa.gov/surge/faq.
EPA. (2015). Climate Change: Basic Information. Retrieved php#2
September 2015, from States Environmental Protection
Agency: http://www3.epa.gov/climatechange/basics/ NOAA. (2015, July 27). Coastal Hazards. Retrieved
October 2015, from National Oceanic and Atmospheric
Erosion and Deposition by Waves. (2015). Retrieved October Administration: http://oceanservice.noaa.gov/hazards/
2015, from Earth Science in Maine: https://sites.google. natural-hazards/
com/site/ear thscienceinmaine/erosion-and-deposition-
by-waves NOAA. (2015). What is a hurricane? Retrieved May 11, 2015,
from National Oceanic and Atmospheric Administration:
Freedman, A. (2012, November 14). 32-Foot Plus Waves oceanservice.noaa.gov/facts/hurricane.html
From Hurricane Sand Topple Records. Retrieved December
1, 2014, from Climate Central: http://www.climatecentral. Rutgers University. (2013). How Do Tidal Cycles Affect
org/news/32-foot-wave -from-hurricane -sandy-topples- Coastal Flooding? Retrieved October 2015, from NJ Flood
records-noaa-finds-15241 Mapper: http://slrviewer.rutgers.edu/about_4.html
Hall, T. M., & Sobel, A. H. (2015). On the Impact Angle Rutgers University. (2013). How Does Sea Level Rise and
of Hurricane Sandy’s New Jersey Landfall. New York, Storm Surge Interact? . Retrieved October 2015, from NJ
NY: Columbia University: http://www.ldeo.columbia. Flood Mapper: http://slrviewer.rutgers.edu/about_2b.html
edu/~sobel/Papers/Hall_Sobel_GRL_resubmitted_revised.
pdf Rutgers University. (2013). Is Sea Level Rising? . Retrieved
October 6, 2015, from NJ Flood Mapper: http://slrviewer.
Hurricanes. (2015). Retrieved May 10, 2015, from Weather rutgers.edu/about_2.html
Wiz Kids: www.weatherwizkids.com/weather-hurricane.
htm Sharp, T. (2012, November 27). Superstorm Sandy: Facts
About the Frankenstorm. Retrieved October 2015, from
Hurricanes: Engines of Destruction. (2015). National h t t p : / / w w w. l i ve s c i e n c e. c o m / 2 4 3 8 0 - h u r r i c a n e - s a n d y -
Geographic: http://environment.nationalgeographic.com/ status-data.html
environment/natural-disasters/hurricane-profile/
Stirling, S. (2012, October 31). History will remember
Greenberg, M. R., Weiner, M. D., Noland, R., Herb, J., Hurricane Sandy. Retrieved December 1, 2014, from True
Kaplan, M., & Broccoli, A. J. (2014). Public Support for Jersey: http://www.nj.com/news/index.ssf/2012/10/
Policies to Reduce Risk After Hurricane Sandy. Risk post_291.html
Analysis: An International Journal, 997-1012.
Sutter, J. D. (2015, June 10). 15 facts about sea level rise
Gregory, J. (2013). Climate Change 2013: The Physical that should scare the s^*# out of you. Retrieved October
Science Basis. Intergovernmental Panel on Climate Change. 5, 2015, from CNN: http://www.cnn.com/2015/06/10/
opinions/sutter-climate-sea-level-facts/
Moran, J. M. (2011). Ocean Studies: Introduction to
Oceanography . Boston, MA: American Meteorological Toro, R. (2013, October 29). Hurricane Sandy’s Impact.
Society . Retrieved October 2015, from Live Science: http://
w w w. l i v e s c i e n c e. c o m / 4 0 7 7 4 - h u r r i c a n e - s a n d y - s - i m p a c t -
NASA. (2015). A blanket around the Earth . Retrieved infographic.html
Semptember 2015, from NASA: Global Climate Change:
http://climate.nasa.gov/causes/ University of Rhode Island (2015). Hurricane Movement.
Retrieved October 2015, from Hurricanes: Science and
NASA. (2015). Climate Change: How do we know? Retrieved Society: http://www.hurricanescience.org/science/
September 2015, from NASA: Global Climate Change: science/hurricanemovement/
http://climate.nasa.gov/evidence/
USGS. (2015, June 8). Coastal Change Hazards: Hurricanes
National Geographic. (2015). Coriolis Effect. National and Extreme Storms. Retrieved October 2015, from U.S.
Geographic. Department of the Interior: http://coastal.er.usgs.gov/
hurricanes/coastal-change/dune-erosion.php
National Geographic. (2015). Sea Level Rise. National
Geographic. Kathryn Rue ’16 is majoring in Environmental
Studies with a minor in Geography. Originally from
National Hurricane Center. (2014, September 5). Storm Tinton Falls, NJ, her independent research topic was
Surge Overview. Retrieved October 6, 2015, from NOAA:
http://www.nhc.noaa.gov/surge/ inspired by the effect that Superstorm Sandy had on
her hometown. Upon graduation, she hopes to obtain
a job focused in natural disaster relief work.
14 | VISIONSPATTERNS IN THE COLLECTION
OF CALIFORNIA SEA OTTERS
ENHYDRA LUTRIS NEREIS
BY JULIA L. NEEDHAM
Aim: This paper looks to examine patterns in the INTRODUCTION
museum collections of Enhydra lutris nereis, also The subspecies Enhydra lutris nereis, more
known as the Southern or California sea otter, commonly known as the Southern or California
based on year acquired and sex, in order to look sea otter, was almost driven to extinction in the
at the impact of Toxoplasma gondii parasitic 18th and 19th centuries by the lucrative fur trade
infections. (Larson et al. 2002). Although they experienced
great genetic diversity loss, populations were
Location: California, USA able to recover after an international treaty was
passed in 1911, putting the sea otters under
Methods: Data for 2,191 total collections of the the protection of the United States government
California sea otter was retrieved from the VertNet (Kenyon 1969). However, sea otters are still
online database. Geographic modeling and considered endangered by the International
statistical analysis of the data were accomplished Union for the Conservation of Nature (IUCN), and
using ArcGIS and Microsoft Excel software. in the past couple of decades, a new threat has
arisen that is preventing Enhydra lutris nereis
Results: Enhydra lutris nereis collections have from full population recuperation.
dramatically increased since the 1980s. Looking Protozoal meningoencephalitis, a usually
at differences in sex, males seem to have higher fatal inflammation of the brain and spinal
risks of developing meningoencephalitis, and they tissues, was first perceived to be a threat to
are also collected more than females, supporting California sea otters in 1992 (Thomas & Cole
previous research. Morro Bay has a greater ratio 1996). The cause has been attributed to two
of collections to land size than Monterey Bay, protozoans, Sarcocystis neurona and the more
so earlier findings that Morro Bay has a larger prevalent Toxoplasma gondii (Miller et al. 2004).
percentage of type x Toxoplasma gondii infections One study noted that infections due to T. gondii
suggest that the type x strain may be more are a major cause of death for subadult and adult
destructive than the type II. sea otters and that they account for 16% of total
fatalities (Miller et al. 2004). The most accepted
Main: Conclusions The increase in number of hypothesis for the prevalence of T. gondii in sea
specimen collections is likely due to the surge in otters is attributed to their food chain. First, T.
fatalities from protozoal infections by Toxoplasma gondii-infected domestic cat feces is entering the
gondii. Males appear to be at a greater risk ocean, being uptaken by filter feeders, and then
of developing an infection because of their being ingested by the otters (Conrad et al. 2005).
migratory nature. There is a potential exception, Since the highest rates of infections in sea otters
where females have had greater collections are concentrated near freshwater outlets, that
in areas that are both protected and lacking idea is even more plausible (Miller et al. 2002).
human inhabitants, possibly because they Although some speculate that otters have mainly
concentrate there for breeding purposes. More been subjected to the parasite through infected
research should be dedicated to both marine and bivalves, there has also been conjecture that sea
freshwater parasitology, and marine protected otters are turning to marine snails, a low-quality
areas should be expanded to afford California alternative to the preferred but scarce abalone
sea otters protection. Because sea otters are an (Johnson et al. 2009). This suggests that there
important keystone species for marine vegetation, is a connection between pathogen exposure and
more research and protection should be devoted the consumption of low-quality food sources,
to ensuring the recovery of the species. and that it is possible “elevated pathogen
Image courtesy of Mike Bard via Flickr.com
SPRING 2016 | 15exposure represents a negative consequence of otters were collected in the early and mid-1900s.
behavioral adaptations that have evolved to cope However, views of local levels (Figure 2) reveal
with limited resources” (Johnson et al. 2009, p. that most otters have been collected in the 1990s
2245). to 2000s.
Genetic research on otter tissue that
tested positive for T. gondii revealed a previously
unknown strain of the parasite with the “type
x” genotype. As the only other alternative to
the known type II genotype, type x Toxoplasma
gondii accounts for 60% of infections (Miller et
al. 2004). The same researchers also found that
type II infected sea otters were concentrated
near Monterey Bay, while type x otters were near
Morro Bay. A different study noted Cambria and
San Simeon as areas with high rates of infection,
but that are lacking large nearby human
populations and freshwater runoff (Johnson et
al. 2009). Also, it is possible that male otters are Figure 1 Collection data for each identified individual from 1908-
2014. The color scale on the left shows earliest to latest data going
more at risk than females because they travel from green to red and is generally applicable to all maps
much further, and therefore cover more area.
One estimate from a logistic model showed that
males are 12 times more likely than females to
be exposed to Sarcocystis neurona (Johnson et
al. 2009).
The purpose of this paper was to examine
data and look for patterns in the museum
collections of Enhydra lutris nereis, analyzing
them statistically and geographically based on
year collected and sex. I looked at the areas
in California that were mentioned in previous
research. My initial hypothesis was that
collections would decrease in the past 20 years
due to high fatality rates from Toxoplasma gondii; Figure 2 Large-scale maps of areas in California, including
Monterey Bay shown here, indicate that more otters have been
however, this was unsupported for reasons on collected in the late 1990s and the 2000s
which I will later elaborate.
Numerical analysis supports this, as
MATERIALS AND METHODS Figure 3 shows that the greatest number of sea
Data was retrieved from the VertNet otters, 87.8% of total collections, was recorded
online database (vertnet.org), making sure to between the thirty-year period of 1980-2010.
include only Enhydra lutris nereis that were The first decade of the new millennium, alone,
collected. The data points were imported into accounted for 35.4% of all historical collections.
Microsoft Excel and all collections without a This seems contrary to the initial hypothesis that
year were deleted. Simple frequency analysis parasite-related fatalities would result in fewer
was used to measure the collections over yearly collections in more recent years. However, this
intervals and to look at which sex, if any, was finding that collections have actually increased
more predominantly recorded. Finally, further could very likely be due to recent interest, both
qualitative analysis was accomplished using in scientific research and public communities, of
ArcMap to geographically model patterns in the California sea otter conservation. Simply, higher
dataset. death rates could actually be promoting more
collections of the species.
RESULTS Furthermore, a side-by-side look at
A small-scale map (Figure 1) of all data Monterey and Morro Bay in Figure 4 shows
collections suggests that most California sea differences in area collections. The Monterey
16 | VISIONSFigure 3 Frequency bar graph on collections showing that 2000-
2010 was the decase with the highest number of collections
Figure 5 Frequency of collections based on sex
Figure 4 Comparing Monterey Bay (a) and Morro Bay (b). Note that Figure 6 Collections of males (left) and females (right)
Morro Bay has been enlarged for easier comparison
Bay data includes 168 females and 215 males male collections in Monterey Bay (Figures 5, 7).
(383 total plus 214 unknowns), while Morro From Figure 6, there is a noticeable difference in
Bay had 138 females and 152 males (290 total collections for males and females at the northern
with 138 unknowns). But because Morro Bay and southern ranges of the California coast.
is about a third the size of the Monterey area, This supports the hypothesis that males are
the former could very likely have a higher ratio more susceptible to parasite disease because of
of collections to land size. This is interesting their wider ranges. The mean 90-day migration
since research has shown that Morro Bay is length was found to be 45 km for males versus
associated with type x Toxoplasma gondii while only 7 km for females (Johnson et al. 2009). The
type II infections are concentrated near Monterey same study also revealed that otters that had a
Bay; most importantly, the type x strain of T. mean 90-day move rate of ≥1km had a 24 times
gondii accounts for 60% of infections (Miller et higher risk than those that traveled less of being
al. 2004). It could be that the type x strain is infected by S. neurona. In addition, males seem
more dangerous to marine mammals than type to have double the chances of T. gondii infection
II. This might be a plausible explanation for the (Miller et al. 2002). This is also probably due to
high counts of specimen collections in Morro Bay the seasonal migrations of males, meaning they
since most museum collections are of deceased are more likely to come into contact with multiple
individuals. However, it is always possible that point sources of polluted freshwater runoff.
spatial frequency patterns are distorted because While it has been posed that San Simeon
of the many scientific experiments that have and Cambria, areas with little freshwater outlets
been completed in these specific areas. and human populations, have high rates of
Overall, the timespan of male and parasite infection in California sea otters, the sex
female collections are very similar. Despite ratio of collections is opposite to other findings
that, it appears like more data was collected (Johnson et al. 2009). Males have actually been
for males, supported by the greater number of collected a lot less in that area than females
SPRING 2016 | 17Figure 7 Males (left) versus females (right) in Monterey Bay
Figure 9 Collections of unknown sex
along with the less common Sarcosystis neurona,
both resulting in lethal meningoencephalitis.
Infected individuals also have higher chances
of shark attacks, possibly because of abnormal
movements that attract attention or a lack of
evasive abilities, due to neurological damage by
T. gondii (Conrad et al. 2005). From the findings,
males do seem to have a higher risk of fatal
infection and Morro Bay also appears to be a
Figure 8 Collection of males (left) and females (right) in San Simeon
and Cambria (enclosed in red) location where death rates from type x T. gondii
are especially high.
(Figure 8). This incongruity may be due to the California sea otters are integral to the
fact that a part of the region is included in ecology of coastal marine systems, particularly
the Cambria State Marine Conservation Area, kelp forests. They act as a keystone species by
and so females might congregate there for safe preying upon sea urchins that would otherwise
habitats for reproduction. Although Morro and voraciously graze on kelp and sea grass beds
Monterey Bay both contain protected areas, large (Estes & Palmisano 1974). In the past, oil spills
human populations could be a large deterrent. have resulted in massive declines of marine
It is also important to note that 27.8% of vegetation, so it is reasonable to say that kelp
all collections were of unknown sex, so patterns forests and the other species that feed and house
may very well be skewed. The gap in data is within them rely on the continued existence of
probably due to more relaxed guidelines related sea otters.
to specimen records in the 70s and 80s since The study of Toxoplasma gondii in otters
most of the unknown data points were from that and other marine mammals is also pertinent to
time (Figure 9). humans because some researchers hypothesize
that people could also have increased risks of
DISCUSSION protozoal infection through seawater ingestion
Opposing the original hypothesis, Enhydra (e.g., swallowing water while swimming) and
lutris nereis collections have dramatically seafood consumption (Conrad et al. 2005). This
increased in the past few decades. This could reason alone should convince municipalities
be attributed to amplified public interest in sea to increase research on protozoal infections in
otter conservation. More importantly, since most marine life. More attention should also be given
collections were of tissue or whole specimens, to expanding marine protected areas (MPAs).
this suggests that the majority of collections were The Marine Life Protection Act of 1999 put MPAs
of deceased sea otters and so there is great cause in place and set up a management system that
for concern that otters are experiencing some permitted limited-to-no human disturbance
sort of fatal event. Most likely, these deaths are (Owens & Pope 2012). Growing conservation
being caused by the parasite Toxoplasma gondii, areas, especially in high-infection but less-
18 | VISIONSYou can also read