State Income Taxes and Racial Equity - Narrowing Racial Income and Wealth Gaps with State Personal Income Taxes - DigitalOcean
←
→
Page content transcription
If your browser does not render page correctly, please read the page content below

State Income Taxes and Racial Equity
     Narrowing Racial Income and Wealth Gaps
             with State Personal Income Taxes
State Income Taxes
 and Racial Equity
 Narrowing Racial Income and Wealth Gaps
     with State Personal Income Taxes

  Carl Davis | Marco Guzman | Jessica Schieder

       Institute on Taxation and Economic Policy
                         October 2021

              INSTITUTE ON TAXATION AND ECONOMIC POLICY
ABOUT THE INSTITUTE ON TAXATION AND ECONOMIC POLICY
ITEP is a non-profit, non-partisan tax policy organization. We conduct rigorous analyses
of tax and economic proposals and provide data-driven recommendations on how to
shape equitable and sustainable tax systems. ITEP’s expertise and data uniquely en-
hance federal, state, and local policy debates by revealing how taxes affect both public
revenues and people of various levels of income and wealth.

ACKNOWLEDGMENTS
The authors wish to thank Kamolika Das, Aidan Davis, Lisa Christensen Gee, Dylan
Grundman O’Neill, Emma Sifre, and Meg Wiehe for research support.

© Institute on Taxation and Economic Policy, October 2021

                                        INSTITUTE ON TAXATION AND ECONOMIC POLICY
Table of Contents

EXECUTIVE SUMMARY....................................................................................................................................................................................... 2

INTRODUCTION...................................................................................................................................................................................................... 4

A NOTE ON THE TERMINOLOGY USED IN THIS REPORT.......................................................................................................... 5

SYSTEMIC RACISM HAS CREATED
VAST RACIAL INEQUITIES................................................................................................................................................................................. 6

STATE AND LOCAL TAX POLICY CAN LESSEN, OR WORSEN, RACIAL INEQUITIES................................................. 8

A CASE STUDY: COMPARING PERSONAL INCOME TAXES IN CALIFORNIA AND VIRGINIA.............................. 10

RECOMMENDATIONS FOR RACE-FORWARD STATE PERSONAL INCOME TAX REFORM.................................13

LEVY HIGHER TAX RATES ON TOP EARNERS....................................................................................................................................13

TAX INVESTMENT INCOME EQUITABLY................................................................................................................................................ 16

TAX PASS-THROUGH BUSINESS INCOME EQUITABLY............................................................................................................... 19

ELIMINATE OR RESTRUCTURE RETIREMENT TAX PREFERENCES.....................................................................................21

ELIMINATE OR RESTRUCTURE HOMEOWNERSHIP SUBSIDIES.........................................................................................24

LOOKING BEYOND THE PERSONAL INCOME TAX........................................................................................................................ 27

LIFT UP RENTERS WITH TAX CREDITS...................................................................................................................................................28

IMPROVE CHILD WELL-BEING WITH TAX CREDITS..................................................................................................................... 33

           CHILD TAX CREDITS............................................................................................................................................................................... 33

           CHILD AND DEPENDENT CARE TAX CREDITS.................................................................................................................... 35

SUPPORT WORKERS WITH THE EARNED INCOME TAX CREDIT (EITC)........................................................................36

REVISITING THE TAX TREATMENT OF MARRIED COUPLES....................................................................................................39

SUPPORT SINGLE PARENTS WITH HEAD OF HOUSEHOLD FILING STATUS..............................................................40

ALLOW LOCAL GOVERNMENTS TO LEVY ROBUST INCOME TAXES................................................................................. 41

CONCLUSION..........................................................................................................................................................................................................42

ENDNOTES ...............................................................................................................................................................................................................43

APPENDIX A | STATE PERSONAL INCOME TAX OPTIONS TO ADVANCE RACIAL EQUITY................................. 52

APPENDIX B | STATE PERSONAL INCOME TAXES: TOP MARGINAL TAX RATES AND INCOME
THRESHOLDS ABOVE WHICH TOP RATE APPLIES...................................................................................................................... 55

                                                                    INSTITUTE ON TAXATION AND ECONOMIC POLICY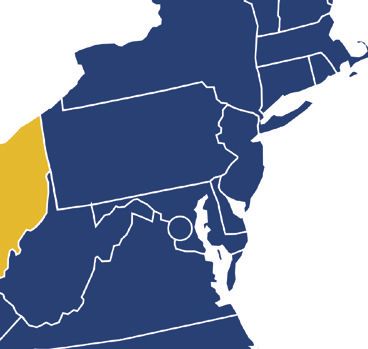
EXECUTIVE SUMMARY
   Historical and current injustices, both in public policy and in broader society, have
resulted in vast disparities in income and wealth across race and ethnicity. Employment
discrimination has denied good job opportunities to people of color. An uneven system
of public education funding advantages wealthier white people and produces unequal
educational outcomes. Racist policies such as redlining and discrimination in lending have
denied countless Black families the opportunity to become homeowners or business owners,
creating vast differences in intergenerational wealth. The lasting effects of these inequities
compound over time.

   Fully addressing these disparities will require a concerted effort across policy areas at all
levels of government. This report focuses on one of many areas where state governments
can advance racial equity: personal income tax reform. Specifically, this report recommends
reforming the tax treatment of investment, business, and retirement income as well as
homeownership and various tax credits for families.

   Tax revenues make possible investments in education, health, housing, and other areas
essential to broadly shared prosperity. But raising adequate personal income tax revenue
to meet these priorities is a racial justice issue that goes beyond dollars raised. Robust,
progressive taxes on income can directly counteract racial income inequality and indirectly
reduce racial wealth inequality as well. With that in mind, this report outlines 10 options that
can advance racial equity through better designed income tax laws.

   The starting point of a racially equitable personal income tax code is a system of graduated
tax rates that asks more of high-income families. Centuries of policy advantage and privilege
have led to a significant overconcentration of white families among the nation’s top earners.
Taxing top incomes is among the most direct ways of lessening income inequality along both
racial and socioeconomic lines, while also raising substantial revenue with which to fund
public investments that combat inequality.

   But ensuring racial equity in state income tax laws requires looking beyond tax rates and
paying close attention to the tax base: that is, the types of income being taxed, and the types
of tax preferences being offered.

   Given the severity of the racial wealth gap, equitable taxation of investment income,
meaning income generated from wealth holdings, is at the heart of racial equity in state
income tax law. The same is true of taxes on business income generated by partnerships and
other pass-through businesses, as this form of income overwhelmingly flows to white families
who are more likely to have access to the start-up capital needed to launch a successful
business.

    Tax subsidies for retirees and homeowners undermine the potential of state personal
income taxes to advance racial equity and should be subject to scrutiny. Discrimination in
the labor and housing markets, among other areas, has created severe racial disparities
in income and homeownership rates that are exacerbated when states provide income
or property tax subsidies to retirees because white people are more likely to have higher
retirement income and homeownership rates.

   Other tax policies have the potential to advance racial equity through the tax code. Means
tested and refundable Child Tax Credits (CTC), for example, boost the after-tax incomes of
a large swath of families but can be particularly important to lower- and moderate-income
families. Dependent care tax credits can also offer a critical boost to families most likely to

                             INSTITUTE ON TAXATION AND ECONOMIC POLICY
                                                2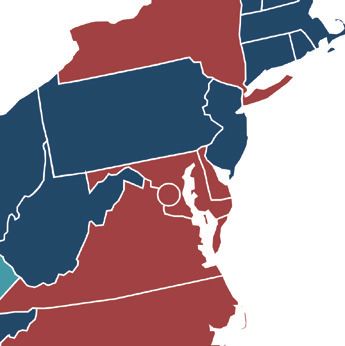
struggle to afford the high cost of childcare. EITCs can bolster the incomes of low-wage
workers, helping families move closer to meaningful economic security. All these credits
advance the economic security of a diverse group of families of many different races or
ethnicities, but they can be particularly powerful for Black, Hispanic, Indigenous, and other
people of color confronting economic hardship created by systemic racism.

   Tax credits directed toward low- and moderate-income renters are an especially promising
option for narrowing racial disparities through state income tax law as an outsized share of
this group is comprised of Black, Hispanic, and Indigenous households. In fact, this report
offers evidence that a tax credit targeted to low-income renters will be even more efficient in
reaching historically marginalized communities than one made available to all low-income
individuals.

   Other income tax reform options with an important racial justice component include
extending tax benefits to single parents in the handful of states that do not already do so,
and empowering local governments to reshape their tax bases in a more progressive fashion
through laws allowing local-level income taxation.

   Racism and discrimination have created highly unequal distributions of income and
wealth across race and ethnicity. While personal income tax laws on their own will not solve
these problems, a well-designed income tax that adheres to the recommendations made in
this report offers one of the most promising routes to begin addressing racial income and
wealth inequality through the tax code.

                            INSTITUTE ON TAXATION AND ECONOMIC POLICY
                                               3
INTRODUCTION
   Under a progressive personal income tax, families and groups with higher incomes pay
higher effective tax rates than either middle- or low-income families. This basic design is
understood as fair by most people because it asks more of those most able to pay, without
adding to the financial hardship of families with lower incomes.1 The core purpose of
progressive income taxes is to raise revenue for public investments. But these taxes are also
an effective way of lessening income inequality, including the vast racial income gap created
through current and historical racism and discrimination. Well-designed income taxes can
also mitigate racial wealth inequality, albeit indirectly.

   The impact of income taxes on families at different income levels has been extensively
researched and discussed. By comparison, the effect of these taxes on families of different
races and ethnicities has received much less attention, though it has been a subject of legal
scholarship since at least the mid 1990s.2 This report builds on that work by bringing together
both new and existing data to illustrate how personal income tax reform can narrow racial
economic disparities. While the focus here is on state-level income taxes, many of these
findings are applicable to the federal personal income tax as well.

   Personal income taxes will not close racial wealth or income gaps on their own. But they
can be part of the solution. At the state and local levels these taxes are particularly important
because so many other revenue sources on which these governments rely—including
sales taxes, excise taxes, fines, and fees—disproportionately impact lower- and middle-
income families and worsen racial disparities.3 Income taxes offer one of the best options for
advancing, rather than hindering, racial equity through state and local taxes.

   Addressing racial economic disparities through the tax code will not only help people in
historically marginalized communities but will also allow society as a whole to benefit from
the inclusive growth that occurs when communities prioritize shared investments. This
report keeps this core goal in mind in discussing policy options for more racially equitable
income taxes.

                             INSTITUTE ON TAXATION AND ECONOMIC POLICY
                                                4
A NOTE ON THE TERMINOLOGY USED IN THIS REPORT
In discussing race and ethnicity, it is necessary to apply labels to groups but also important to acknowledge
that those labels can be limiting, imprecise, or even rejected by many of the people they are meant to
describe.

For instance, we use the term Hispanic in this report to describe people tracing their roots to Spanish-
speaking countries in Latin America or to Spain because it is currently the most widely accepted term
among the group it describes. In the Census surveys we rely on in our analysis, this group includes anyone
who personally identifies as being of “Hispanic, Latino, or Spanish origin.” Although we use the term
Hispanic in this report, we also acknowledge that it is Eurocentric, arguably excludes people with roots in
areas of Latin America that do not speak Spanish, and that many members of this group would prefer to be
called Latino or Latinx (a gender-neutral alternative to Latino).

Similarly, we use the term Black to refer to people who describe themselves as Black or African American. In
public opinion polling of Black individuals, these two terms are roughly equally preferred, with a significant
majority of Black people stating that the two terms are equally acceptable.

This report generally refers to people of Native American descent as Indigenous peoples. We use the term
“American Indian” in our table labels and methodology documents as it seems to have reasonably wide
acceptance among the population it describes. It is the term used in the Census surveys on which we relied
in building our model databases, and it is found frequently in statute.

Throughout this report, the term “white” is generally meant to refer only to non-Hispanic white people.

The phrase “people of color” is an inexact term used to describe people who have been marginalized
because of their race or ethnicity. In the context of this report, it is typically meant to refer to groups
facing discrimination that has resulted in below-average incomes or wealth such as Black, Hispanic,
and Indigenous people as well as Native Hawaiians, Pacific Islanders, and some segments of the Asian
community.

SYSTEMIC RACISM HAS CREATED
VAST RACIAL INEQUITIES
   A long history of racism and discrimination, continuing through the present day, has
created enormous racial disparities. The roots of racial inequities are both deep and broad,
from national public policies and the shortcomings of our economic system down to
countless individual acts of racism.

    Economic disparities across race and ethnicity manifest in health, education, housing,
income, wealth, and many other measures of well-being. Any of these can be relevant for tax
purposes, though income and wealth are typically the two most important. Income is usually
measured as the resources generated or received in the span of a single year, whereas wealth
is the store of resources inherited or accumulated throughout one’s lifetime.

   Racial income gaps are driven by discrimination in pay and hiring, disparities in
geographic access to employment opportunities, and educational achievement gaps
created through an inequitable system of education funding, among other factors.4 The
median income for white households in 2019 was $72,000, compared to $53,000 for Hispanic
households, $44,000 for Indigenous households, and $44,000 for Black households.
Asian households’ median income was $95,000, though it is important to note that a
disproportionate share of Asian households live in high-cost areas such as California, Hawaii,
and New York, and that some segments of the Asian community have median incomes far
below this level.5 Income taxes offer a straightforward way to lessen income inequality both
across race and in general.

   Systemic racism is even more apparent in our nation’s racial wealth gap, which is far larger
than the gap in annual income. Today the median Black household has just 13 cents in wealth
for every dollar held by the median white household while the median Hispanic household
has 16 cents.6 These gaps cannot be explained by the individual achievements of these
households and are largely driven by a lack of intergenerational wealth mobility. The median
household headed by a Black college graduate, for example, has less wealth than the median
white household headed by a person without a high school diploma.7 Far too often, “studying
and working hard isn’t enough for Black Americans.”8

                            INSTITUTE ON TAXATION AND ECONOMIC POLICY
                                               6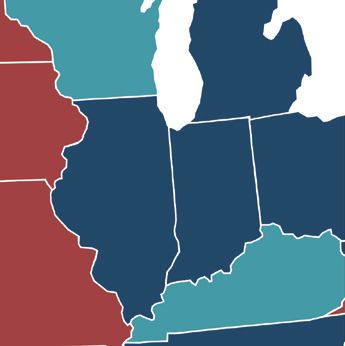
Figure 1
Racial Disparities in Income and Wealth, 2019
                                                                                                  $188,200

               Black

               Hispanic
               White

                                              $72,000
                                $53,000
               $44,000
                                                                                      $36,100
                                                                        $24,100

                          Median annual income                                    Median wealth
Source: Income data from ITEP analysis of 1-year ACS PUMS. Wealth data from Survey of Consumer Finances.

   The effects of the racial wealth gap, created through centuries of racism and enduring
advantages for white wealth-building, carry through across generations in countless ways.
President Roosevelt’s New Deal and other policies in the middle of the last century helped
build the American middle-class. But often, those policies excluded people of color. The
GI Bill, VA loans, and FHA loans, for example, provided a pathway to college education
and homeownership for millions of veterans and civilians. But the programs were either
racist in policy or administration and generally excluded Black people. The effects of these
policies compounded over time, allowing white families the upward job mobility that higher
education enables and the generational wealth building that home ownership facilitates.

  Wealth begets wealth. Lack of wealth can beget the same. So, without adequate start-up
capital or access to credit, people of color are less likely to start a business and more likely to
work for someone else, often for lower pay than their white colleagues.9

  Student loan debt is a universal problem, but people of color are more likely to be weighed
down by it. Instead of buying a house, young college graduates of color are more likely to
have student loan debt because their parents lack the income or wealth to finance the high
cost of college education.10

   Residential segregation persists, in part due to the legacy of government redlining and
white homebuyers’ aversion to living in areas with significant nonwhite populations.11 Instead
of enjoying robust growth in their home equity over time, many people of color have seen
their home values stagnate or even decline.

   Instead of building a nest egg for retirement, people of color are often confronted with
having to make a hardship withdrawal from their retirement accounts because of a financial
difficulty that cannot be resolved by drawing on family wealth.12

   And instead of receiving an inheritance, intergenerational transfers often flow in the other
direction, with working-age people of color often financially supporting the basic needs of
their parents and other family members.13

                                          INSTITUTE ON TAXATION AND ECONOMIC POLICY
                                                             7
The racial wealth gap did not occur in a vacuum: public policy contributed. The gap has
swollen to such a point that it cannot close without a robust policy intervention. One recent
analysis concluded that if current trends continue, it will take Hispanic families more than
2,000 years to reach white households’ current wealth levels while Black households are
estimated to never "catch up” to white households.14 It is against this backdrop that we
consider tax policy in general, and state personal income taxes in particular, as components
of an approach to narrowing racial disparities in both wealth and income.
STATE AND LOCAL TAX POLICY CAN LESSEN,
OR WORSEN, RACIAL INEQUITIES
State and local revenue policy intersects with our nation’s racial disparities in myriad ways.
Inadequate property tax bases can lead to underfunded schools that hinder educational
achievement for students of color. Local governments’ heavy reliance on fees and fines
can lead to over-policing and criminalization of communities of color. And an overreliance
on regressive consumption taxes tends to worsen income inequality along both racial
and socioeconomic lines by requiring families with the lowest incomes to pay a higher
percentage of their earnings in tax.15
State and local tax revenue can, however, be a powerful tool for addressing racial
disparities through the investments they make possible in education, health, housing, and
other areas essential to broadly shared prosperity.
Moreover, taxes on income or wealth can counteract racial and economic disparities.
Estate and inheritance taxes, for instance, can curb the concentration of extreme wealth
in the hands of a small number of families. Personal income taxes, which are the focus of
this report, have the potential to directly counteract racial income inequality and indirectly
reduce racial wealth inequality.
ITEP’s recent analysis of Minnesota’s tax system, which includes a personal income tax,
helps demonstrate this fact.16 Black, Indigenous, and Hispanic households in Minnesota pay
an average overall tax rate slightly below the statewide average largely because of the state’s
progressive personal income tax structure. White and Asian households, by contrast, pay
average rates at, or slightly above, the statewide average.17 The result is a system that narrows
the average income gap between white and Asian residents, who tend to have higher
average incomes, compared to Black, Indigenous, and Hispanic residents—albeit only slightly.
Tennessee’s state and local tax system, which lacks a personal income tax and relies
heavily on sales and excise tax dollars, produces the opposite effect. Sales taxes take a larger
share of income from low- and middle-income families than from well-off families because
lower-income families spend much more of what they earn on basic expenses. This regressive
distribution across income levels shows up in the distribution of taxes across race and
ethnicity as well. In Tennessee, Black and Hispanic families on average are taxed at overall
rates above the statewide average, while white and Asian families are taxed at below-average
rates. Racial income inequality is worsened by the steeply regressive nature of Tennessee’s
tax code.
INSTITUTE ON TAXATION AND ECONOMIC POLICY
8Figure 2
Difference in Tax Rate Relative to Statewide Averageby Race and Ethnicity, in Minnesota and Tennessee
State and Local Taxes as a Share of Income
1.0%
0.9%
0.1% No Data
0.0%
-0.1%
-0.2%
-0.4%
-0.5%
-0.7%
White Asian Hispanic Black American White Asian Hispanic Black American
Indian Indian
MINNESOTA TENNESSEE
-
Source: Institute on Taxation and Economic Policy, March 2021
Note: Hispanic category includes people of all races. Other categories include non-Hispanic people only. American
Indian category (including Alaska Natives) only includes people living away from federally recognized reservations.
Sample size limitations prevent reporting of estimates for American Indian families in Tennessee.
These findings point toward personal income taxes being an essential element of a racially
equitable tax code. But what does a racially equitable personal income tax look like?
At a basic level, more progressive income taxes with higher rates on top earners are
typically more effective in advancing racial equity. Extreme disparities in income across
groups are reduced when groups with higher average incomes face higher average tax
rates. Such a system also lessens racial wealth inequality because income is a component of
building wealth for the long-term, and a progressive system bolsters lower-income families’
opportunities for building wealth relative to a regressive system requiring them to set aside
more of their earnings for paying tax.
But it is vital to look beyond tax rates when assessing the racial equity of personal income
tax codes. The tax base matters as well: that is, the kinds of income that are taxed and the
kinds of tax subsidies that are offered. All too often, the race equity potential of state income
tax codes is undercut by preferences for the wealthy. Two households with the same annual
income can be treated differently under state income tax law. The one with more wealth,
more income from wealth, and more ways to generate wealth – who is more likely to be white
– often ends up paying less tax. This reality informs many of the recommendations made in
this report.
INSTITUTE ON TAXATION AND ECONOMIC POLICY
9A CASE STUDY: COMPARING PERSONAL
INCOME TAXES IN CALIFORNIA AND VIRGINIA
The choices state lawmakers make in setting up their personal income tax codes determine
the distribution of the tax by both income level and race. While most state personal income
taxes chip away at the racial income divide, the extent to which they do so varies. The
analysis in this section helps illustrate this point by looking at the overall racial and economic
distribution of personal income taxes in two states with dramatically different income tax
structures: California and Virginia.
Subsequent sections of this report discuss in more detail many of the income tax policies
that differ between these two states and outline options for racially equitable income tax
reform. In general, the choices California lawmakers have made in setting up their personal
income tax code have done more to advance racial equity than the choices made by Virginia
lawmakers. In both states, however, vast racial disparities persist even after state income taxes
are applied—a fact that will require lawmakers to do far more, through the tax code and other
means, to advance racial equity.
The most pronounced difference between California and Virginia’s income taxes is the tax
bracket structure, especially at the high end of the income scale. California levies marginal
tax rates ranging from 1 percent to 13.3 percent, with that top bracket only applying to taxable
incomes over $1 million (or $1.2 million for married couples). In Virginia, the bracket structure
is much narrower and the rates much flatter, ranging from 2 percent to just 5.75 percent.
Virginia’s top bracket was written into law decades ago and is now extremely outdated. It
applies to taxable income in excess of just $17,000. Unlike in California, most Virginians are
subject to the state’s top income tax rate on a portion of their income.
There are also major differences between these two tax codes for families with low- and
moderate incomes. California has a refundable Earned Income Tax Credit (EITC) and Young
Child Tax Credit, as well as a nonrefundable low-income renters’ credit. Virginia, by contrast,
does not have any refundable tax credits (meaning credits in excess of personal income tax
liability) aimed at helping families, though it does have a nonrefundable EITC and another
nonrefundable low-income credit.
For families in the middle of the income distribution, California offers more generous
personal and dependent credits, and standard deductions, than Virginia.18 It also offers
a Child and Dependent Care Tax Credit to help mitigate the high cost of childcare, while
Virginia offers a more modest deduction for those expenses. California’s tax code is also more
equitable for single parents, who are more likely to be people of color, with more favorable
tax brackets and deductions for head of household filers. Virginia, by contrast, requires single
parents to claim the same standard deduction as other single individuals and does not vary its
tax brackets based on filing status.
Taken together, Figure 3 shows that these changes result in a much more progressive
income tax distribution in California across the income spectrum. It also indicates that for
many low- and middle-income families, California’s personal income tax results in a lower tax
rate than Virginia’s, even though California’s tax raises more revenue overall (calculated per
person or as a share of statewide income) as a result of higher tax rates on extremely affluent
households. This revenue can be used to address the needs of all communities and to provide
targeted services to historically marginalized groups.
INSTITUTE ON TAXATION AND ECONOMIC POLICY
10Figure 3
State Personal Income Taxes Vary Significantly in Distribution by Income Level
Comparing California and Virginia Taxes as a Share of Family Income
9.9%
5.5%
3.8% 3.9% 4.2% 4.6%
2.6% 3.2%
0.5% 2.1% 1.9%
1.1% 0.8%
-0.9%
Lowest 20% Second 20% Middle 20% Fourth 20% Next 15% Next 4% Top 1% Lowest 20% Second 20% Middle 20% Fourth 20% Next 15% Next 4% Top 1%
CALIFORNIA VIRGINIA
Source: Institute on Taxation and Economic Policy, October 2021. Analysis is for Tax Year 2019.
These stark differences in the distribution of personal income taxes by income level also
show up in the distribution of taxes by race. Racism and discrimination have held down
Black and Hispanic average incomes in California to levels 35 to 40 percent below white
average incomes. As a result, California’s progressive income tax asks somewhat less of the
average Black family (4.0 percent of income) or Hispanic family (3.6 percent) than it does
of the average white family (5.0 percent). Because California’s income tax is more sensitive
than Virginia’s to differences in ability to pay across income levels, it also better accounts for
differences in ability to pay across race and ethnic groups. This makes the tax valuable in
reducing racial and economic inequities.
But while California’s income tax is narrowing the state’s racial income gap, it is important
to emphasize that there is still significant room for improvement in California’s tax code.
The equity of California’s income tax, for example, is partly undercut by the fact that the
largest income tax subsidies offered in the state tend to benefit higher-income households
and profitable businesses.19 Moreover, personal income taxes are just one component of
California’s overall revenue structure that also includes regressive levies such as sales taxes,
excise taxes, fees, and fines that worsen racial inequity.20 Overall, California continues to
confront immense racial and economic disparities even after personal income taxes are
collected and could be doing more to advance equity through its tax code.
INSTITUTE ON TAXATION AND ECONOMIC POLICY
11Figure 4
Average State Personal Income Tax as a Share of Family Income
California
Virginia
3.6% 3.4% 4.0% 3.3% 4.4% 3.5% 4.9% 3.7% 5.0% 3.6%
Hispanic Black Multiple Races Asian White
Source: Institute on Taxation and Economic Policy, October 2021. Analysis is for Tax Year 2019
Note: Hispanic category includes people of all races. Other categories include non-Hispanic people only..
Virginia’s personal income tax follows a pattern that is broadly similar to California’s, but
its flatter structure makes it much less effective at narrowing racial disparities. In Virginia,
Black families’ average income is 36 percent lower than white families’ average income
while Hispanic families’ average income is 31 percent lower. Despite these large differences
in economic circumstances, however, effective personal income tax rates relative to income
show little variation across race and ethnicity in Virginia, ranging from a low of 3.3 percent
for the average Black family to a high of 3.7 percent for the average Asian family. As a result,
Virginia’s income tax does less than California’s to address racial and economic inequality.
Implementing the types of reforms identified in this report could make Virginia’s tax system,
and those of every other state, far more effective at combatting racial income inequality.
INSTITUTE ON TAXATION AND ECONOMIC POLICY
12RECOMMENDATIONS FOR RACE-FORWARD
STATE PERSONAL INCOME TAX REFORM
The following discussion outlines 10 reforms that can narrow racial gaps in both income
and wealth. Most of these reforms make personal income taxes more progressive in some way,
but they largely emphasize tax base design rather than focusing solely on tax rates.
While income level is usually the most important factor in determining income tax liability,
a range of other factors such as wealth, homeownership, age, and family structure are also
relevant. These characteristics vary across race and ethnicity and, in many cases, are shaped
by past and ongoing racism.
The following sections emphasize the importance of levying a broad, progressive income
tax free of carveouts for the high-income and high-wealth families who don’t need them.
Specifically, they explore the impacts of repealing tax subsidies or otherwise asking more
of high-income investors, business owners, employees, retirees, and homeowners. And they
examine how state income tax codes can be used to lift lower-income workers, renters, and
families with children.
Some of these reforms, such as paring back tax subsidies for investors, homeowners, and
retirees have been recommended by scholars studying the intersection of taxes and race for
decades.21 We build on their work here by focusing on state-level income taxes rather than
the federal income tax, which has received more attention. We also bring in new and updated
data, including analyses performed through a novel merging of tax and survey data in our
proprietary microsimulation tax model.22 Finally, a table in Appendix A indicates which options
for income tax reform are relevant in each state.
Levy Higher Tax Rates on Top Earners
America is highly unequal and has higher levels of poverty for people of all races than
most other wealthy democracies. Centuries of racism and discrimination in the labor market,
education systems, and society broadly have denied opportunities to many people of color.
One result of this systemic racism is that a disproportionate share of high-income families
Figure 5
More than Four in Five of the Nation's Highest-Income Families are White
80.4%
Overall: share of households
58.6%
Among top 1%: share of households
24.6%
9.9% 10.5%
4.1% 5.0% 2.8% 0.5% 0.2%
White Asian Hispanic Black American Indian /
Alaska Native
Source: ITEP analysis of 2015-2019 ACS data.
Note: Hispanic category includes people of all races. Other categories include non-Hispanic people only.
INSTITUTE ON TAXATION AND ECONOMIC POLICY
13are white. Fifty-nine percent of tax units in the United States are white, but white families
account for roughly 80 percent of very high-income families, meaning those falling among
the top 1 percent of earners. Hispanic, Black, and Indigenous families are all much less likely
than average to be among the nation’s top 1 percent of families by income level. Just 5
percent of the nation's highest-income families are Hispanic, less than 3 percent are Black,
and only 0.2 percent are Indigenous families.
The racial wealth gap is a key contributor to the underrepresentation of families of color
among the nation’s highest-income families. For the small group of families at the very top
of the economic spectrum, income is more likely to be derived from returns on investments
in the stock market and privately owned businesses. More than half of all corporate equities,
mutual fund shares, and private business wealth is held by just 1 percent of the nation’s
wealthiest families.23
Raising taxes on top earners is widely understood to be a powerful tool for building
economic equity. It is also a powerful tool for advancing racial equity both because an
outsized share of top earners’ income flows to white families and because doing so can raise
substantial revenue with which to fund public investments that directly combat inequality.
Several states have implemented this policy option in the last several years including Arizona,
California, Connecticut, Hawaii, Maryland, New Jersey, New York, and New Mexico.
The most recent reform of this type was approved by Arizona voters in November 2020
through a 3.5 percent tax surcharge on income over $250,000 for individuals or $500,000 for
married couples.24 If the reform is allowed to stay in effect as voters intended, the result will
be to narrow inequality in the state across both income and race.
Figure 6 shows how the surcharge improves the overall distribution of Arizona taxes across
incomes by boosting the very low effective tax rates paid by the top 1 percent of earners. This
figure includes the impact of personal income taxes as well as sales taxes, property taxes,
excise taxes, and other levies.25
Figure 6
Arizona State and Local Tax Shares of Family Income
13.0%
11.3%
Surcharge Taxes before surcharge
9.7%
8.5%
7.5% 7.4%
6.9%
13.0% 1.3%
11.3%
9.7%
8.5% 7.5% 6.9% 6.1%
Lowest 20% Second 20% Middle 20% Fourth 20% Next 15% Next 4% Top 1%
Source: Update to ITEP's 6th Edition of Who Pays?, October 2021. This figure includes the impact of tax changes en-
acted through the end of 2020. Additional tax changes, not included here, were passed by the Arizona legislature in
2021 and are the subject of ongoing litigation.
INSTITUTE ON TAXATION AND ECONOMIC POLICY
14Figure 7
Share of Families Facing Tax Increase Under Arizona Surcharge
1.2%
1.1%
0.5% 0.4%
0.3%
Asian White Black Hispanic American Indian
Source: Institute on Taxation and Economic Policy, October 2021
Note: Hispanic category includes people of all races. Other categories include non-Hispanic people only. American
Indian category (including Alaska Natives) only includes people living away from federally recognized reservations.
This figure omits the impact of tax changes passed during Arizona’s 2021 legislative session.
Looking across race and ethnicity, more than four in five dollars raised through the
surcharge will come from non-Hispanic white households, as they are significantly
overrepresented among families at that very high-income level. Figure 7 shows that a very
small share of people of all races are affected by the Arizona surcharge, but also that white
and Asian families are about twice as likely to be affected as Black or Hispanic families, and
more than three times as likely to be affected as Indigenous families.
Shortly after voters approved the surcharge, the Arizona legislature sent Gov. Doug Ducey
a package of bills that effectively negate the levy, albeit in a roundabout fashion.26 The
governor promptly signed those bills, but voters are already working to block that legislation
and reaffirm the surcharge they approved last year.27 The legislation is also likely to be
challenged in court on the grounds that it violates the state constitution.28 As of this writing,
the fate of Arizona’s surcharge remains uncertain. But the potential of this policy to advance
racial equity is clear.
Looking around the country, states have significant room for improvement in their
taxation of top earners. Among states with personal income taxes, the median state has set
its top rate to kick in at taxable income levels of just $60,000 for married couples. Even more
problematic are the eighteen states that apply their top tax rates starting at taxable incomes
below $20,000—including nine states applying a single, flat tax rate to all taxable income.
A full summary of top income tax rates, and the income levels at which those rates apply, is
available in Appendix B.
When state and local tax systems are viewed on the whole—including not just income
taxes but also sales, excise, property taxes and other levies—the picture becomes even
bleaker. Most states tax top earners at a lower overall rate than low-income families.29
Unfortunately, constitutional barriers in some states make addressing this more difficult.
Colorado, Illinois, Massachusetts, Michigan, and Pennsylvania have constitutionally mandated
flat taxes, meaning that they cannot enact targeted rate increases on top earners unless they
first amend their constitutions (Massachusetts voters will have the chance to do so at the
ballot box in November 2022). Additionally, Georgia and North Carolina’s constitutions specify
a maximum top income tax rate, which limits state lawmakers’ ability to raise rates on top
earners. These kinds of constitutional prohibitions work to solidify racial inequity by making it
more difficult to address racial disparities through equitable income taxation.
INSTITUTE ON TAXATION AND ECONOMIC POLICY
15While higher income tax rates on top earners will not bring an end to racial and economic
disparities, such a reform should be a cornerstone policy in any agenda to advance race
equity through the tax code. Asking more of those families with the greatest ability to pay
is an essential characteristic of equitable tax codes. As the following sections of this report
show, lawmakers should also be sure not to lose sight of the tax base. The ways in which
different kinds of income are taxed matters just as much, if not more, than the headline tax
rate.
Tax Investment Income Equitably
Broad-based income taxes apply not just to workers’ wages and salaries, but also to profits
investors receive through capital gains or dividends. Unfortunately, the federal tax system
and every state system disadvantages workers by offering preferential tax treatment to high-
income investors—a group that is predominately white. Ideally, states should pursue the
opposite course by asking more of high-income investors. Doing so can directly counteract
racial economic disparities.
According to the Internal Revenue Service (IRS), less than 9 percent of households
reported net capital gains income on their federal tax returns in 2018—meaning profits from
the sale of assets such as stocks, bonds, real estate, and antiques.30 Most of these gains were
realized by high-income families. Households with federal adjusted gross incomes (AGI) in
excess of $200,000 reported 85 percent of taxable capital gains, even though they accounted
for less than 6 percent of all returns filed. The very wealthiest 0.1 percent of Americans—
those with AGI over $2 million—received more than half, or 53 percent, of all capital gains
income. Households with AGI of less than $100,000—a group that includes 4 out of 5 filers—
collectively received just 7 percent of all capital gains income.
Because capital gains overwhelmingly flow to high-income households, they also tend to
flow mostly to white households. But gaps in asset ownership levels across race and ethnicity
are even larger than the racial income gap, and capital gains income is therefore likely to be
even more skewed in favor of white households than the distribution of income overall.31
The reasons behind the racially inequitable distribution of asset ownership, and capital
gains income, are numerous and systemic. Racist housing policies that prevented people
of color from becoming homeowners are one contributing factor, as homeownership is
a proven path toward building wealth over time. More generally, with vast differences in
intergenerational wealth across race and ethnicity, people of color are much less likely than
white families to receive a significant inheritance that they can invest and use to generate
capital gains income. Making matters worse, there is also evidence that centuries of racism,
discrimination, and false promises have created a wariness among many people of color
to participate in the stock market.32 And perhaps more importantly, investment firms have
been slow to diversify their workforces and to market their products to people of color—
particularly when compared to the real estate or insurance industries.33 As Dorothy Brown of
Emory University explains, for too long the financial industry “hasn’t seen black Americans as
potential customers.”34
Taken together, the result of this long and ongoing history of racism and discrimination
is that investment income is incredibly concentrated in the hands of white families.
Approximately 8.1 percent of Black households and 7.3 percent of Hispanic households own
stocks or mutual fund shares outside of a retirement savings account. Among non-Hispanic
white households, by contrast, the comparable figure is 27.9 percent.35 Even among asset
INSTITUTE ON TAXATION AND ECONOMIC POLICY
16Figure 8
Vast Majority of Assets Likely to Generate Taxable Capital Gains Income are Owned by White Households
59.6%
White
89.1%
12.6%
Black
1.3% Share of population
Share of corporate equities, mutual fund shares, and private business wealth
owned by group
18.7%
Hispanic
0.8%
Source: ITEP compilation of data and projections from the Federal Reserve and U.S. Census Bureau. Population
shares are as of February 2021 while asset ownership shares are for the entire first quarter of 2021. The Hispanic cate-
gory includes people of any race while the Black and white categories include only non-Hispanic people.
owners, the gaps in the asset value are staggering. The median white household owning
stocks or mutual fund shares owns $45,100 in such assets compared to just $20,000 for
Hispanic households and $8,500 for Black households.36
In total, close to 90 percent of the types of assets most likely to generate taxable capital
gains income —private business wealth and corporate equities and mutual fund shares held
outside of retirement accounts—are owned by white families. Just 1.3 percent are owned by
Black families and less than 1 percent are owned by Hispanic families.37
States offering deductions or preferential tax rates to investors should repeal those
carveouts to advance racial equity and put investors and workers on a more even footing.
Nine states currently offer a broad tax subsidy on most or all forms of capital gains income,
and more than a dozen states offer narrower subsidies for capital gains derived from specific
activities (often gains on certain assets located solely within state boundaries, though these
kinds of subsidies have sparked legal questions relating to whether they unconstitutionally
interfere with interstate commerce).38 Some states have made progress on this front in recent
years, including New Mexico which trimmed its capital gains exclusion by 20 percent and
Colorado which largely repealed its exclusion for gains on assets within the state.39
A truly race-forward approach to capital gains taxation requires looking beyond these
more obvious subsidies and pursuing deeper reforms to the way in which capital gains
income is measured and taxed.40
Under a provision known as “deferral,” for instance, income tax on capital gains is paid only
when the asset is sold. Thus, a stockholder who owns a stock over many years does not pay
any tax as it increases in value each year. Salary and wage income, by contrast, is taxed every
year. Eliminating the deferral benefit and shifting to an annual system of taxing capital gains
(sometimes known as mark-to-market taxation) would go a long way toward lessening the
degree to which state income tax codes preference wealth over work. This kind of system
is already used in limited situations involving derivatives and securities held by dealers.41
Implementing it in a broader fashion has been proposed at both the federal level and in New
York State for very high-income or high-wealth people who already have tax accountants
who could handle the additional tax compliance effort involved.42
INSTITUTE ON TAXATION AND ECONOMIC POLICY
17Figure 9
State Income Tax Subsidies for Capital Gains Income
Broad tax subsidy plus deferral
and stepped-up basis
Deferral and stepped-up basis
No broad-based income tax
Source: Institute on Taxation and Economic Policy (ITEP) review of state tax forms and recently enacted legislation.
Notes: Nine states offer large tax subsidies, often a partial exclusion from income, that apply broadly to capital
gains income. Many more states offer partial exclusions for capital gains derived from specific activities that are not
depicted in this map. Every state with a personal income tax offers subsidies for capital gains in the form of deferral
and stepped-up basis.
Eliminating or curtailing “stepped-up basis” offers another worthwhile avenue for reform.
When used in combination with the “deferral” benefit just described, this tax subsidy allows
wealthy families, most of whom are white, to pass stocks and other property down through
the generations without having to pay tax on the income created by those investments.
Ordinarily, if a $100,000 investment grows in value to $1 million, the $900,000 gain would
be considered taxable income at the time the investment is sold. But if a parent holds onto
that investment until death and passes it on to their children, the $900,000 gain is completely
tax-free. That is, the child’s “basis” in the investment is “stepped-up” to $1 million and any
future gain or loss in the asset’s value will be calculated relative to that $1 million value.
This outdated tax subsidy has been an active contributor to the nation’s growing wealth
inequality and the Biden administration has recently proposed paring it back dramatically
for estates with more than $1 million in capital gains.43 If the federal government succeeds
in limiting stepped-up basis, it will be important for states to couple to this reform in order
to ensure a more equitable treatment of capital gains in their own tax codes. Even if federal
policy does not change, however, states should explore limiting or eliminating this provision
in their own tax codes.44
Short of eliminating stepped-up basis or moving in the direction of a mark-to-market tax
system, states might also choose to simply raise rates on capital gains income. Doing so could
help mitigate the subsidies provided through deferral and those provided at the federal level
through special, lower rates applied to capital gains and dividends. That is, taxing capital gains
INSTITUTE ON TAXATION AND ECONOMIC POLICY
18at a higher rate than other sources of income at the state level could lead to a more equitable
taxation of capital overall, since the federal government has unwisely chosen to tax capital
gains at a lower rate than other types of income.
There is some precedent for this at the state level, as Massachusetts already taxes short-
term capital gains at a higher 12 percent rate, compared to the 5 percent rate it applies to
ordinary income.
For state lawmakers concerned with racial wealth inequality, higher taxes on capital gains
income represent one of clearest, shovel-ready approaches to using the tax code to lessen
the extreme concentration of wealth.
Tax Pass-Through Business Income Equitably
Entrepreneurship has long been held up as a vehicle for upward economic mobility and a
way to accumulate wealth in America, but the opportunity to become a successful business
owner is not equally available to all communities. Business owners are more likely to be
white, male, wealthy, and older compared to the rest of the population.45 Nearly 88 percent of
private business wealth is owned by white people even though they account for less than 60
percent of the U.S. population overall. Black people, at 12.6 percent of the population, own just
under 2 percent of business wealth and Hispanic people, at 18.7 percent of the population
also own less than 2 percent of private business wealth.46
Figure 10
White Households Own Significantly More Private Business Wealth
White 59.6%
87.8%
12.6%
Black
1.9% Share of population
Share of private business wealth
Hispanic 18.7%
1.7%
Source: ITEP compilation of data and projections from the Federal Reserve and U.S. Census Bureau. Population
shares are as of February 2021 while asset ownership shares are for the entire first quarter of 2021. The Hispanic cate-
gory includes people of any race while the Black and white categories include only non-Hispanic people.
The distribution of private business wealth is also highly unequal across the economic
spectrum, with 85 percent of such wealth held by the top 10 percent of families and more
than half held by the top 1 percent alone.47 The bulk of private business wealth is owned by a
relatively small group of affluent white families.
Discriminatory practices in the housing market and financial sector have, throughout
history, reduced the ability of communities of color to build and pass on business wealth.
INSTITUTE ON TAXATION AND ECONOMIC POLICY
19Figure 11
Racial Differences in Average Amount of Initial Capital for Startups, by Source
$106,720
White
Black
$56,663
$35,205
$34,426
$19,562
$18,543
$10,809
$7,195
$5,228
$2,849
$2,139
$1,010
$536
$440
Owner's Informal Formal Owner Informal Formal Total Financial
Equity Equity Equity Debt Debt Debt Capital
Source: Robert W. Fairlie, Alicia Robb, and David T. Robinson.
The racial wealth gap and discrimination in lending practices affect capital availability for
minority entrepreneurs—one of the most important requirements for starting a business.
Black entrepreneurs are less able to acquire startup capital from virtually all sources—formal
(banks, venture capital, angel investors, etc.), informal (friends, family, close associates), and
owner debt and equity.48
More than half (53.4 percent) of Black-owned businesses that apply for financing are
denied, which is more than double the rate of white-owned businesses.49 This can be due to
lender racism, lenders being unfamiliar or unreceptive to business ideas that might have a
market in Black communities, or credit challenges that Black borrowers face.50
While the credit-scoring system may seem like a race-neutral way of assessing financial
risk, it can perpetuate the racial wealth gap. For instance, white homeownership rates are
30 percent higher than Black homeownership rates, and not until recently were rental
payments considered in most credit-scoring models.51
These barriers to capital make entry into the business world far more difficult for
entrepreneurs of color. In fact, almost 28 percent of Black-owned firms and nearly 15 percent
of Hispanic-owned firms (compared to 9.4 percent of white-owned firms) were categorized
as “discouraged borrowers,” meaning they avoided applying for credit outright, due to the
expectation that their applications would be denied.52
The effects of past discrimination on business ownership can even be found at the top of
the economic spectrum for Black Americans. The top 5 percent of Black Americans (with a
net worth of at least $357,000) hold 9 percent of their non-financial assets in business equity,
compared to 37 percent for white Americans above a similar level of wealth.53 Because white
families have, overall, more business assets, the benefits of tax subsidies aimed at pass-
through business flow most heavily to them.54
INSTITUTE ON TAXATION AND ECONOMIC POLICY
20Figure 12
State Income Tax Subsidies for Pass-Through Businesses
Partial exclusion of income
Partial exclusion and
preferential rates
Preferential tax rates
No subsidy/no income tax
Source: Institute on Taxation and Economic Policy (ITEP) review of state tax forms and recently enacted legislation.
Under the Tax Cuts and Jobs Act of 2017 (TCJA), the federal government now gives
pass-through business owners a 20 percent deduction for “qualified business income.”55
Fortunately, most states with broad-based personal income taxes have chosen to eschew
the federal government’s policy of offering this kind of special treatment to pass-through
business owners and instead tax profits from those businesses in the same manner as
salaries or wages.
But seven states offer a tax subsidy to pass-through business owners in the form of a
partial exclusion from income, a special set of lower tax rates, or in the case of Ohio, both
policies. These regressive tax subsidies, which primarily benefit higher-income and higher-
wealth business owners who are more likely to be white, needlessly exacerbate the racial
wealth gap and should be repealed. Colorado recently took a step in this direction by
eliminating its deduction for single individuals with income over $500,000 and for married
couples with income over $1 million.56
Eliminate or Restructure Retirement Tax Preferences
Most states with income taxes offer tax preferences – often several different kinds – to
elderly people that are unavailable to the broader public. These can take the form of flat
dollar deductions for people above a certain age or exemptions from tax for specific types of
income such as Social Security or pensions. These subsidies are skewed in favor of older and
more affluent white people and tend to worsen racial inequities in both income and wealth.
INSTITUTE ON TAXATION AND ECONOMIC POLICY
21You can also read