Projected OCS Sand Resource Needs and Effort - Project No: M17PX00021 - Bureau of ...
←
→
Page content transcription
If your browser does not render page correctly, please read the page content below

Projected OCS Sand Resource Needs and Effort
Project No: M17PX00021

June 15, 2018

  Number of
  Anticipated Lease
  Applications by
  State over the 10-
  year Forecast
  Period

U.S. Department of the Interior
Bureau of Ocean Energy Management
Headquarters
Herndon, VA
Prepared for:                       Prepared by:

    Bureau of Ocean Energy Management   W.F. Baird & Associates Ltd.
    Leasing Division
    Marine Minerals Branch
    45600 Woodland Road                 For further information, please contact
    Sterling, VA 20166                  Gordon Thomson at +1 561 400 7820
                                        gthomson@baird.com
                                        www.baird.com

OCS Marine Minerals Forecasting
Project No: M17PX00021

12702.101                                                                         Page ii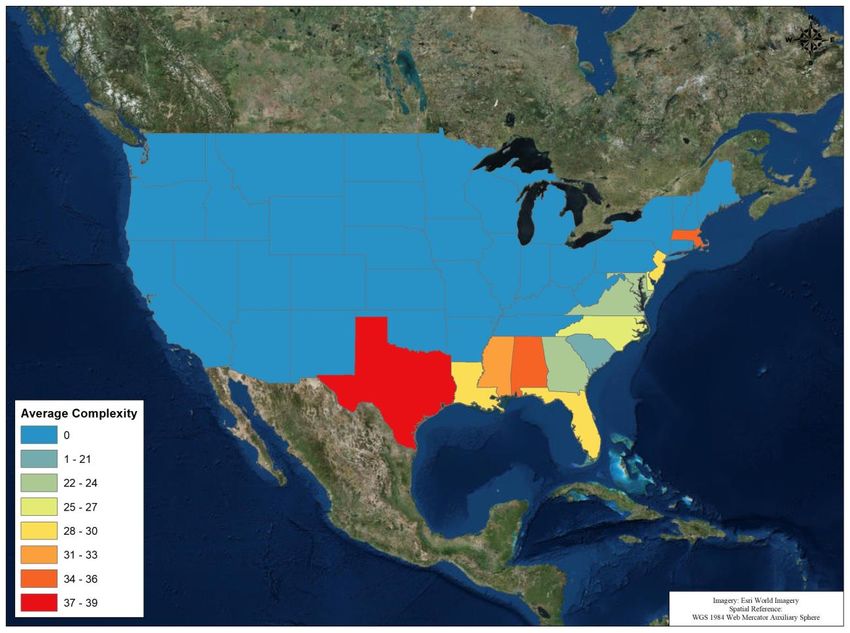
Table of Contents

1.   Introduction .............................................................................................................................1

2.   Database Development ..........................................................................................................3

3.   Data Collection ........................................................................................................................4

               National Database Review and Data Extraction                                                                                  4

               On-Line Reports and Permits                                                                                                   4

4.   Data Compilation ....................................................................................................................5

               Base Scenario                                                                                                                 5

               Elevated Need Scenario                                                                                                        5

               Project Complexity                                                                                                            6

5.   Data Analysis ..........................................................................................................................9

               Alabama                                                                                                                       9

               Alaska                                                                                                                      10

               California                                                                                                                  10

               Connecticut                                                                                                                 12

               Delaware                                                                                                                    12

               Florida                                                                                                                     13

               Georgia                                                                                                                     22

               Hawaii                                                                                                                      22

               Louisiana                                                                                                                   23

               Maine                                                                                                                       25

               Maryland                                                                                                                    26

               Massachusetts                                                                                                               27

               Mississippi                                                                                                                 28

               New Hampshire                                                                                                               30

OCS Marine Minerals Forecasting
Project No: M17PX00021

12702.101                                                                                                                                 Page iii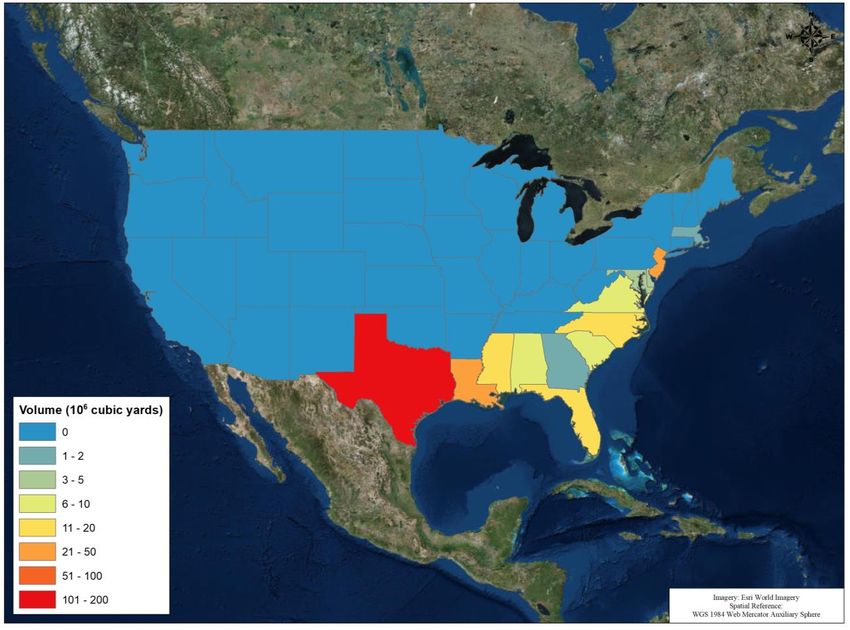
New Jersey                                                                                                                30

                 New York                                                                                                                  38

                 North Carolina                                                                                                            39

                 Oregon                                                                                                                    43

                 Puerto Rico                                                                                                               43

                 Rhode Island                                                                                                              43

                 South Carolina                                                                                                            44

                 Texas                                                                                                                     47

                 Virginia                                                                                                                  48

                 Washington                                                                                                                50

6.     National Need Forecast....................................................................................................... 51

                 Expected Number of Leases                                                                                                 51

                 Expected Lease Volume                                                                                                     52

                 Project Complexity                                                                                                        54

                 Other Considerations                                                                                                      56

7.     Conclusions ......................................................................................................................... 57

8.     Recommendations .............................................................................................................. 58

9.     Acknowledgements ............................................................................................................. 59

10. References............................................................................................................................ 60

OCS Marine Minerals Forecasting
Project No: M17PX00021

12702.101                                                                                                                                Page iv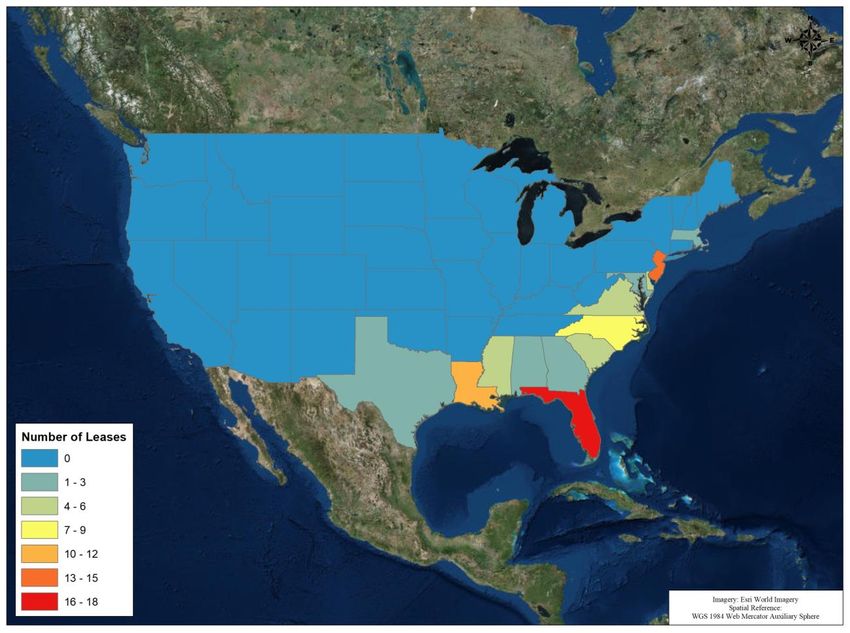
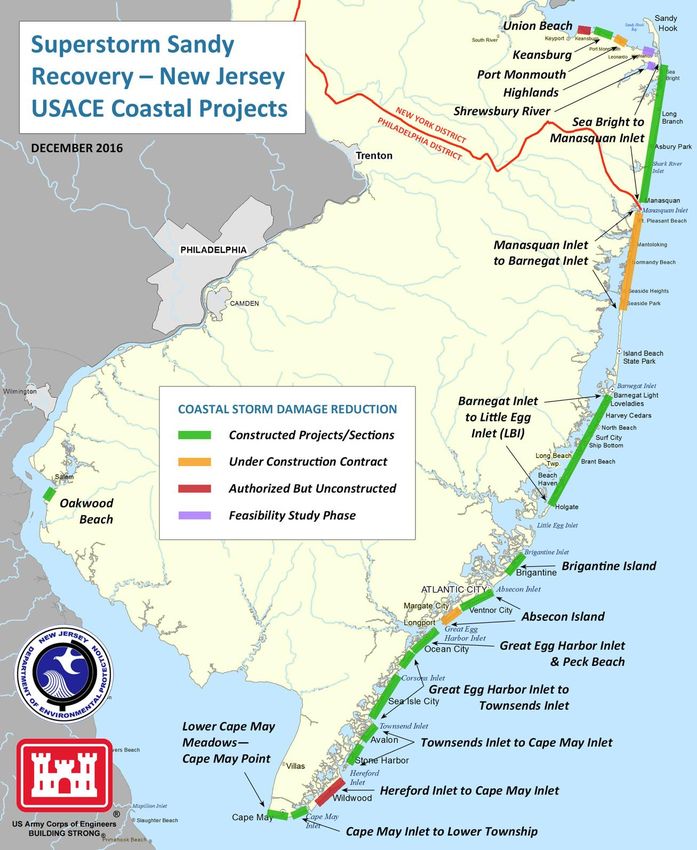
List of Tables
Table 5.1: Number of Expected Lease Applications over the 10-year Forecast Period in Florida ............... 14

Table 5.2: Number of Expected Lease Applications over the 10-year Forecast Period in Louisiana........... 24

Table 5.3: Number of Expected Lease Applications over the 10-year Forecast Period in Mississippi......... 29

Table 5.4: Number of Expected Lease Applications over the 10-year Forecast Period in New Jersey ....... 31

Table 5.5: Number of Expected Lease Applications over the 10-year Forecast Period in North Carolina .. 40

Table 5.6: Number of Expected Lease Applications over the 10-year Forecast Period in South Carolina .. 45

Table 5.7: Number of Expected Lease Applications over the 10-year Forecast Period in Virginia .............. 49

Table 6.1: Total Number of Expected Lease Applications over the 10-year Forecast Period ...................... 51

Table 6.2: Total Volume Included in Expected Lease Applications over the 10-year Forecast Period (millions of
cy) ......................................................................................................................................................................... 53

Table 6.3: Complexity Value of Lease Applications over the 10-year Forecast Period ................................. 55

List of Figures
Figure 1-1: History of BOEM Leases Signed and Total Volume Leased.......................................................... 1

Figure 5-1: Number of Expected Lease Applications over the 10-year Forecast Period in Florida .............. 14

Figure 5-2: Total Lease Volume by Year in Florida for Base and Elevated Need Scenarios ....................... 14

Figure 5-3: Project Complexity Values for Florida Projects.............................................................................. 14

Figure 5-4: Number of Expected Lease Applications over the 10-year Forecast Period in Louisiana ......... 24

Figure 5-5: Total Lease Volume by Year in Louisiana for Base and Elevated Need Scenarios ................... 24

Figure 5-6: Project Complexity Values for Louisiana Projects ......................................................................... 24

Figure 5-7: Potential offshore sand resource areas for further investigation, from the MASSGIS portal ..... 28

Figure 5-8: Number of Expected Lease Applications over the 10-year Forecast Period in Mississippi ....... 30

Figure 5-9: Total Lease Volume by Year in Mississippi for Base and Elevated Need Scenarios ................. 30

Figure 5-10: Project Complexity Values for Mississippi Projects ..................................................................... 30

Figure 5-11: Number of Expected Lease Applications over the 10-year Forecast Period in New Jersey ... 31

OCS Marine Minerals Forecasting
Project No: M17PX00021

12702.101                                                                                                                                                            Page v
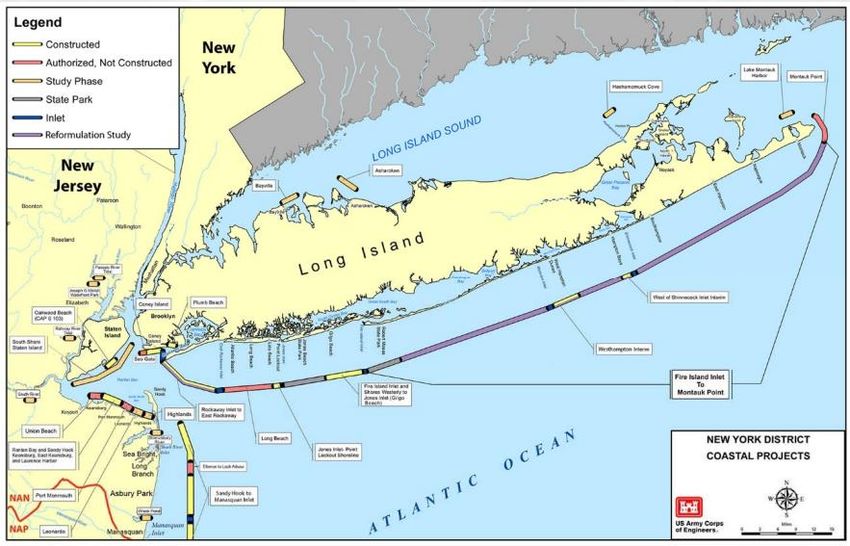
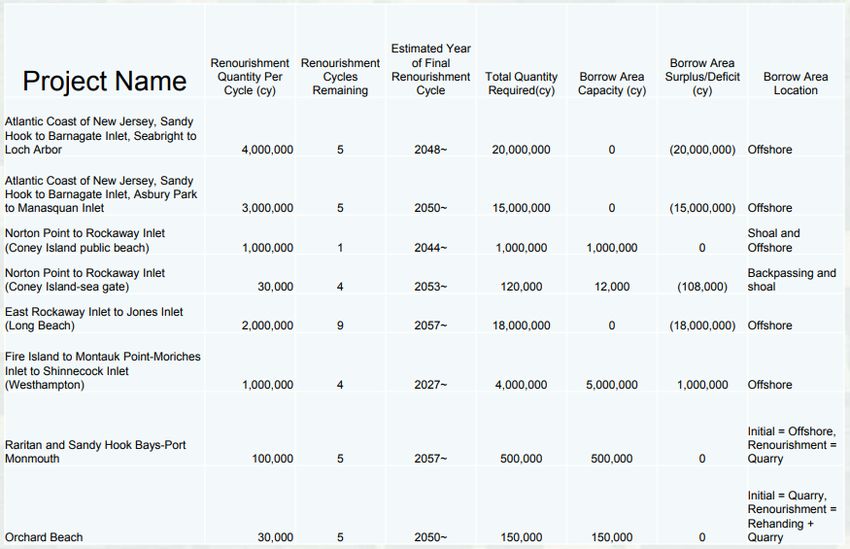
Figure 5-12: Total Lease Volume by Year in New Jersey for Base and Elevated Need Scenario ............... 32

Figure 5-13: Project Complexity Values for New Jersey Projects ................................................................... 32

Figure 5-14: USACE Management of the New Jersey Coastal Projects ........................................................ 34

Figure 5-15. USACE Map of Projects within the New York District (USACE, 2018c) ................................... 38

Figure 5-16: USACE New York District List of Projects with Renourishment Cycles and Borrow Area
Capacities (USACE, 2017c). .............................................................................................................................. 39

Figure 5-17: Number of Expected Lease Applications over the 10-year Forecast Period in North Carolina40

Figure 5-18: Total Lease Volume by Year in North Carolina for Base and Elevated Need Scenarios ........ 40

Figure 5-19: Project Complexity Values for North Carolina Projects............................................................... 40

Figure 5-20: Number of Expected Lease Applications over the 10-year Forecast Period in South Carolina45

Figure 5-21: Total Lease Volume by Year in South Carolina for Base and Elevated Need Scenarios ........ 45

Figure 5.22: Project Complexity Values for South Carolina Projects .............................................................. 45

Figure 5-23: Number of Expected Lease Applications over the 10-year Forecast Period in Virginia ........... 49

Figure 5-24: Total Lease Volume by Year in Virginia for Base and Elevated Need Scenarios .................... 50

Figure 5-25: Project Complexity Values for Virginia Projects .......................................................................... 50

Figure 6-1: Total Number of Expected Lease Applications over the 10-year Forecast Period ..................... 51

Figure 6-2: Color Coded Map showing the Number of Anticipated Lease Applications by State over the 10-year
Forecast Period ................................................................................................................................................... 52

Figure 6-3: Total Volume Included in Expected Lease Applications over the 10-year Forecast Period (millions
of cy) ..................................................................................................................................................................... 53

Figure 6-4: Anticipated Lease Volume by State over the 10-year Forecast Period for Base Scenario. ....... 54

Figure 6-5: Total Complexity Value of Lease Applications over the 10-year Forecast Period ...................... 55

Figure 6-6: Average Complexity Value by State ............................................................................................... 56

Figure 7-1: Historic and Predicted Lease Number and Lease Volume Over Time ........................................ 57

OCS Marine Minerals Forecasting
Project No: M17PX00021

12702.101                                                                                                                                                            Page vi
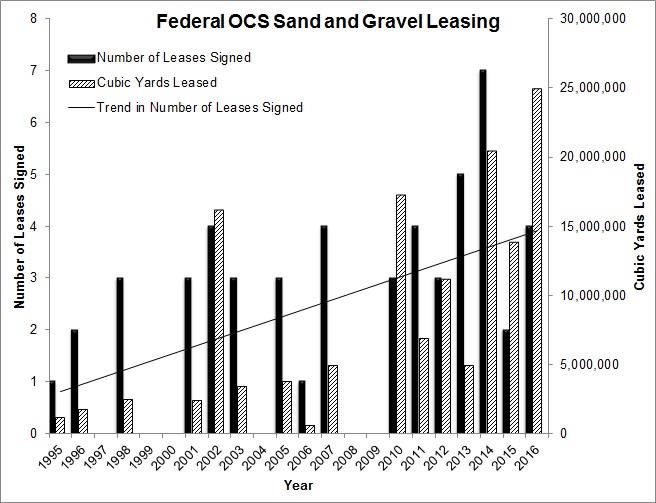
1.          Introduction
United States (U.S.) beaches are the first line of defense against storms, and they provide critical
environmental habitat and valuable recreational benefits. U.S. wetlands are productive ecosystems that
sustain an intricate food chain. Encroachment on these environments and natural destructive processes have
led to decisions to intervene to maintain and restore these natural assets through dredging and placement of
sediment (sand, gravel, shell, and silt/clay). As sediment resources in state waters have diminished over the
years, there has been an increased demand for sediment from the Outer Continental Shelf (OCS) (Figure 1-1).

Figure 1-1: History of BOEM Leases Signed and Total Volume Leased.

The Bureau of Ocean Energy Management (BOEM) Marine Minerals Program (MMP) is the only federal
agency with the authority to convey the rights to dredge OCS mineral resources. With this authority, BOEM is
also charged with ensuring that dredging, handling, and placement of federal sediment resources are
performed in a safe and environmentally sound manner. BOEM has already authorized the use of over 147
million cubic yards (MCY) of sand for such projects, but this is just the start. Unfortunately, sediment sources
along the OCS are increasingly expensive to obtain due to increasing distance from the project area, are
typically not renewable, and have competing offshore interests. Thus, careful planning for the use of these
resources is required to optimize longevity and minimize costs while protecting the environment.

Projected OCS Sand Resource Needs and Effort
Project No: M17PX00021

12702.101                                                                                                 Page 1
Understanding the future demands of sediment for coastal restoration projects is one aspect of effective
management. This report summarizes a forecast of activities that could require OCS sand resources through
2028, a 10-year horizon.

The report describes the methods in Sections 2 through 4, including database development, data collection,
and data compilation. The section on data compilation defines the Base scenario and Elevated Need
scenario, and the project complexity variable. The results are described in Section 5 in a state-by-state
discussion of the history of beach nourishment and OCS sand resource use, as well as that state’s OCS sand
needs forecast. Section 6 steps up a geographic level from the state-level analysis and provides a discussion
of the National Needs Forecast, including the expected number of leases and sand volume requirements over
the next 10 years. The report closes out with conclusions, recommendations, acknowledgements, and
references.

Projected OCS Sand Resource Needs and Effort
Project No: M17PX00021

12702.101                                                                                             Page 2
2.           Database Development
The development of an accurate year-by-year forecast of OCS sand resource demand requires an inventory of
previous and potential nourishment projects along the nation’s Atlantic, Gulf of Mexico, and Pacific coastlines.
These projects can then be assessed for the likelihood that they will need OCS resources, which feeds into the
BOEM’s future lease volume estimate. The timeline, construction volume, and likely borrow area location are
useful in making this determination. However, all of these items are subject to variability, including the potential
for catastrophic events, such as Hurricane Sandy. Thus, sufficient data must be collected to bracket the
potential sand needs. It is also critical that data be compiled and presented in a uniform manner so that they
can be efficiently and accurately analyzed. The Needs Forecast Database (NFD) accompanies this report and
can be updated over time. The following information, where available, was gathered into the NFD.
•    Project Location (name, latitude, longitude)             •   Volume Available from Borrow Area (cy)
•    State                                                    •   Sufficient Volume in Borrow Area for stated
•    Principal Project Sponsor                                    needs (Y/N)
•    Federal Project (Y/N)                                    •   Will Future Borrow Area be Located in OCS
                                                                  Waters (Yes/Likely/Unlikely/No)
•    Is Funding in Place (Y/N)
                                                              •   Reason for Expected Borrow Area to be
•    Funding Source/Program
                                                                  Located in OCS Waters
•    Latest Project Engineer
                                                              •   Are OCS Sand Borrow Areas located within 50
•    Number of Renourishment Events                               miles of the project (Y/N)
•    First Year Periodic Nourishment Began                    •   Is project likely to be constructed using OCS
•    Year Last Constructed                                        sand resources if OCS sand resources are
•    Initial Project Construction Volume (cy)                     greater than 50 miles away (Y/N)
•    Largest Project Construction Volume (cy)                 •   Previous BOEM Lease (Y/N)
•    Total Volume Placed to Date (cy)                         •   Document Reference
•    Renourishment Plan (Y/N)                                 •   Document Link
•    Average Renourishment Interval (yr)                      •   Project Complexity Value
•    Average Renourishment Volume (cy)                            •    Project Lead
•    Anticipated OCS Lease Application Date                       •    Expected Lease Effort
•    Next Anticipated Construction Date                           •    Level of Borrow Area Development
                                                                       Completed
•    Anticipated Volume of Next Nourishment (cy)
                                                                  •    Anticipated NEPA Compliance Effort
•    Basis for Volume estimate (see Section 4.1
     and 4.2)                                                     •    Borrow Area Compatibility
•    Average Annual Loss Rate (cy/yr)                             •    Project Volume
•    Annual Average Nourishment Rate (cy/yr) –                    •    Overall Project Complexity
     calculated field                                             •    Pipeline Discharge Location
•    Is the Project Best Identified as a Beneficial               •    Protected Resources (species and
     Disposal Project (Y/N)                                            habitat)
•    Borrow Area identified for Next Project (Y/N)                •    Infrastructure and Cultural Resources
•    Borrow Area Name                                             •    Multiple Use Conflicts
•    Borrow Area Location (latitude, longitude)               •   General Comments

Projected OCS Sand Resource Needs and Effort
Project No: M17PX00021

12702.101                                                                                                   Page 3
3. Data Collection
The Needs Forecast Database (NFD) was developed by scouring various data sources. This section outlines
our approach for collection of data outlined in Section 2.
National Database Review and Data Extraction
The NFD was initially populated with nourishment projects using data from the publicly accessible U.S. beach
nourishment databases including:
• BOEM Lease Areas on Marine Cadastre (BOEM and NOAA, 2018)
• American Shore and Beach Preservation Association (ASBPA) National Beach Restoration Database
(ASBPA, 2017)
• Western Carolina Beach Nourishment Viewer (Western Carolina University, 2017)
• United States Army Corps of Engineers (USACE) Coastal Systems Portfolio Initiative (CSPI) (USACE,
2017)
• USACE Dredging Information System (DIS) (USACE, 2017b)
These databases include data on project name, location, year completed, history of multiple events, latitude,
longitude, funding source, justification, length, volume, and cost.
These national databases do not always state whether a project is ongoing or pending, though they provide
the nourishment history of some projects. Projects that appeared to be ongoing efforts and are relatively new
(less than 15 years old) were used to populate the NFD. These data were then used during the subsequent
phases of the forecasting effort.
On-Line Reports and Permits
With the preliminary list of projects, on-line sources for details of the various projects, such as permitting
portals and USACE records of federal projects, were reviewed. The intent at this stage was to obtain as much
data as possible prior to contacting project representatives. Thus, the goal of contacting representatives was to
confirm details rather than request data. In instances where additional data are required, BOEM can be
confident other avenues for obtaining data prior to the interview have been exhausted.
Projected OCS Sand Resource Needs and Effort
Project No: M17PX00021
12702.101 Page 44. Data Compilation
The analysis was separated into two primary assessments. The first assessment was the most likely demand
for OCS sand resources based on anticipated resource needs. This was termed the “Base Scenario.” The
“Elevated Need Scenario” was an upper estimate of sand resource needs based on more aggressive
assumptions. The approach to develop these estimates is discussed further in the following sections.
Base Scenario
The Base Scenario provided a forecast that was based on anticipated sand resource needs and thus
represents a likely but lower-end forecast of volumetric needs for OCS sand, gravel, shell, silt, and clay. It
assumed that projects will be constructed on the project sponsor’s expected timeline even though project
sponsors tend to be optimistic with respect to a timeline.
The Base Scenario was developed based on the following approach and assumptions:
• Determined the likely volumetric requirements each year over the next 10 years assuming anticipated
renourishment volume. The anticipated volume was determined using the following hierarchy:
1. Volumes included in project permit applications.
2. Volumes included in project design reports.
3. Historic average annual renourishment volume.
• Determined whether OCS sand resources would be required using the following hierarchy:
1. Pre-existing borrow areas will be fully utilized first, whether located in state or OCS waters.
2. If the borrow area is located in OCS waters, then future borrow area will also be located in OCS
waters.
3. Defer to the project sponsor’s opinion of the likely borrow area location if the existing borrow area runs
out of sand.
4. If the borrow area location is unknown, then assume the borrow area will be located in OCS waters.
• Determined the likely year of project construction using the following hierarchy:
1. Any projects where construction spans two years will be allocated to the first year of construction,
because BOEM must plan for lease issuance for the start of construction.
2. Use construction dates listed in permit applications.
3. Use construction dates listed in funding documents (this is positioned lower than permit application,
because project sponsors may need permits in hand before obtaining funding, and the focus of this
study is to forecast BOEM’s workload).
4. Use construction dates/intervals listed in project design reports.
5. Use historic renourishment interval following the date of the last construction event.
The data were filtered and compiled by year to provide the annual forecast.
Elevated Need Scenario
The Elevated Need Scenario provided a forecast with higher volumetric needs based on more aggressive
assumptions as to the future need of OCS resources. This forecast attempted to incorporate uncertainties
such as:
• Large storm events impacting long sections of the coast creating increased demand (e.g. Hurricane
Sandy).
Projected OCS Sand Resource Needs and Effort
Project No: M17PX00021
12702.101 Page 5• Increased funding to support beach nourishment.
• Revised rules and regulations eliminating borrow areas in state waters requiring use of OCS resources.
• Projects without identified sand resources requiring OCS resources.
• New projects being constructed.
• Existing projects or projects under design being expanded.
The Elevated Need Scenario was developed based on the following approach:
• Determined the likely volumetric requirements each year over the next 10 years assuming the maximum
potential volume of the project using the largest of the following volumes:
1. Initial construction volume (assumes extreme hurricane event impacts the area).
2. Anticipated construction volume of the next event.
3. Tentatively Selected Plan (from federal design document).
4. Locally Preferred Plan (from federal design document).
5. Include potential project expansion based on constructed fill density.
6. Other potential fill volume based on Project Sponsor input.
• Determined whether OCS sand resources will be required using the following hierarchy:
1. Assume OCS resources will be used unless OCS resources are located more than 50 miles from the
project fill area
2. If OCS sands are greater than 50 miles away, then defer to the opinion of whether the project will be
constructed
• Determined the likely year of project construction using the same hierarchy as in the Base Scenario.
The forecast timeline was the same for the Base Scenario and Elevated Need Scenario, as the timing of a
hurricane cannot be predicted. The forecast can be revised to reflect the potential for earlier work should a
hurricane impact a section of coast.
As with the Base Scenario, the Elevated Need Scenario was filtered and compiled by year to provide an
annual forecast through 2027.
Project Complexity
BOEM indicated that the forecast will be used to forecast BOEM workload as well as potential OCS resource
needs. However, workload is not necessarily directly correlated with the volumetric need of a project or the
number of projects. To better evaluate staffing levels, a “Project Complexity” analysis was developed. The
complexity of each project was quantified by applying a point score for various aspects of project that will
impact BOEM personnel review time. Thus, this provides a better forecast of the potential workload for BOEM
personnel each year than simply considering the number of leases. Project complexity was applied to the
Base Scenario only because the Elevated Need Scenario incorporates far greater uncertainty geared more
towards a storm event.
A complexity grade was proposed for various aspects of the project. Points were allocated based on the level
of complexity for various aspects of the project:
• Project Lead
• State or local project where BOEM has significant lead design responsibilities – 7 pts
• State or municipality led project with private consultant – 6 pts
• Federal project with multiple federal agency leads and/or local sponsor – 5 pts
Projected OCS Sand Resource Needs and Effort
Project No: M17PX00021
12702.101 Page 6• Federal project led by another federal agency – 4 pts
• Expected Lease Effort
• New Non-competitive Negotiated Agreement – 5 pts
• Amendment likely to trigger NEPA – 4 pts
• Minor Amendment – 1 pt
• Not Applicable – 0 pts
• Level of Borrow Area Development Completed
• Borrow area likely to be located in OCS water but no preliminary location identified – 5 pts
• Previously used borrow area but unusual case leading to added complexity – 4 pts
• Borrow area to be located in OCS water with approximate location identified – 3 pts
• Borrow area is located in OCS water and has been developed – 2 pts
• Borrow area is located in OCS waters and a portion has been previously dredged – 1 pt
• Federal agency led using a borrow area that is in state waters – 1 pt
• Local sponsor led using a borrow area that is in state waters – 0 pts
• Anticipated NEPA Compliance Effort
• Environmental Impact Statement (EIS) – 7 pts
• Supplemental EIS – 5 pts
• Programmatic Consultation – 3 pts
• Environmental Assessment – 2 pts
• Determination of NEPA Adequacy – 2 pts
• NEPA Completed already – 0 pts
• Not Applicable - BA in state waters – 0 pts
• Borrow Area Compatibility
• The mean grain size, sorting value, silt content, color, and carbonate content must be close to the
native material to be considered beach compatible material – 2 pts
• The mean grain size, silt content, and to a lesser extent color, must be reasonably close to the native
material to be considered beach compatible material – 1 pt
• Mean grain size and silt content are not of significant concern once the material is broadly similar to
the intended project need – 0 pts
• Project Volume
• >15 MCY – 4 pts
• 5-15 MCY – 3 pts
• 2-5 MCY – 2 pts
•• Pipeline and Discharge Location
• Submerged Pipeline AND Pumpout Station are in OCS Waters – 2 pts
• Submerged Pipeline OR Pumpout Station are in OCS Waters – 1 pt
• Neither Pipeline nor Pumpout Station is in OCS Waters – 0 pts
• Protected Resources (species and habitat)
• Project area has numerous protected resources requiring above average coordination and careful
review of lease conditions – 4 pts
• Project area has one or two protected resources requiring above average coordination and careful
review of lease conditions – 3 pts
• Project area has numerous protected resources, but they can be covered by standard lease
conditions – 2 pts
• Project area has limited protected resources, but they can be covered by standard lease conditions –
1 pt
• Project area is outside of a protected resource area – 0 pts
• Infrastructure and Cultural Resources
• Project area has extensive infrastructure (pipelines, cables, etc.) and/or cultural resources requiring
offsets and crossing agreements – 3 pts
• Project has minimal infrastructure or cultural resources to avoid – 1 pt
• Project area has been cleared, and there is no infrastructure in the vicinity of the project – 0 pts
• Multiple Use Conflicts
• Close to artificial or natural reefs requiring additional offsets and monitoring – 3pts
• Close to sensitive fishing grounds – 2 pts
• Close to United States Coast Guard anchorages – 1 pt
• Other potential conflicts that must be considered that are outside of normal expectations – 1 pt
The maximum complexity value using this system is 50. The average complexity value was 28.
Note, if it was determined that a project’s future borrow area would not be located in OCS waters, then data
was not compiled for that project. Neither would a full complexity value analysis be performed. Rather than
erase this project, it was left in the database so that future reviewer could see that it had been considered.
However, some of the complexity values auto populate (such as volume) based on information within the
spreadsheet leading to a low complexity value that is not truly representative. Thus, any analyses involving
the complexity value should filter out projects that will not use an OCS borrow area in the future.
The “Multiple Use Conflicts” is entered as a value to allow for additive values. For example, a project could be
close to sensitive fishing grounds and artificial reefs and another potential conflict, leading to point score of 6.
Projected OCS Sand Resource Needs and Effort
Project No: M17PX00021
12702.101 Page 85. Data Analysis
This section provides a state by state analysis of data compiled for the 24 coastal states that border OCS
waters. Each state discussion starts with a summary discussing the results of this study including the state’s
nourishment history and past use of OCS resources, the state’s OCS sand forecast (which projects will need
OCS sand and the number of leases), a discussion of the complexity values for those projects requiring OCS
leases, and a summary of the references used to determine the state forecast. The coast of each state has
then been analyzed to determine if a project requiring offshore resources may be forthcoming and the potential
source of this sand. Some states have been broken into sub-areas (county or geographic region) due to the
volume of potential projects and thus more easily locate an individual project within the discussion.
BOEM has executed 54 leases authorizing the use over 147 MCY to restore the nation’s coasts (BOEM,
2017). Forty-two projects have been completed using OCS resources.
A discussion of the national forecast of the number of leases and volume of sand required over the next 10
years, as well as the complexity values for these projects, is included in Section 6.
Alabama
There have been 15 nourishment events along Alabama’s coast since 1986 at a total cost of $67M (ASBPA,
2017). To date, Alabama has not used OCS resources to construct a beach nourishment project (BOEM,
2017).
Two projects are projected as being likely to use OCS resources in the next 10 years, Dauphin Island West
and Perdido Pass. The Base Scenario for expected volume need is more than 9.5 MCY with an Elevated
Need scenario of 19.2 MCY. Both projects have a complexity value of 34. The complexity values are higher
than the national average of complexity values of 28, primarily due to both projects being state led and each
requiring a new lease.
Numerous beach nourishment projects have been constructed along the Alabama coastline including
placement along Gulf Shores to Orange Beach and eastern Dauphin Island. Beneficial dredging of Perdido
Pass has constructed projects along Perdido Key and Orange Beach. However, to date, these projects have
all used sand resources located in state waters.
The Gulf Shores/Gulf State Park/Orange Beach stretch of shoreline was last nourished in 2013. A specific plan
to renourish this section of shoreline could not be located, though this area has a history of repeated beach
nourishments extending back to 2001. A review of the previous project documents shows that the projects
dredged sediment from borrow areas located in state waters, including a potentially reusable source at Perdido
Pass. However, the project has tended to be large, and the potential for needing OCS resources is likely. The
renourishment intervals have also been relatively short and average three years between 2001 and 2013. The
longest interval was seven years. This followed the largest nourishment in 2005/06. Given that renourishment
periods tend to increase over time, a seven-year renourishment period was estimated for the next project,
suggesting a 2020 construction. The largest project volume was used for the Elevated Need Scenario, while
the average of the renourishment volumes was used for the Base Scenario.
The Alabama Barrier Island Restoration Assessment (National Fish & Wildlife Foundation, 2016) is “building
on previous studies to conduct a scientific feasibility study to assess the current and future function of Dauphin
Island, develop options for restoration, and evaluate the feasibility and cost associated with restoration
actions.” This restoration effort may include nourishing the western end of Dauphin Island. Previous
nourishment efforts for Dauphin Island proposed using borrow sources in state waters (Coastal Planning &
Engineering, Inc., 2010). However, this project was listed as likely to use OCS resources if the project moves
Projected OCS Sand Resource Needs and Effort
Project No: M17PX00021
12702.101 Page 9forward as there is an Offshore Material Disposal Site (OMDS) close to the project and the previous borrow
area Is close to Sand Island, which may prompt concerns. This project was proposed for Deepwater Horizon
(DWH) oil spill funding as Dauphin Island was heavily impacted due to the oil spill but there is no current
timeline for this project. A 2024 lease application was assumed for planning purposes.
The East Dauphin Island Project was constructed using sand dredged from just south of Sand Island. Future
projects will likely use beneficial disposal from Mobile Pass navigation channel given the close proximity. This
was recently constructed and was the first nourishment effort. Thus, there is no expected use of OCS sands in
the next 10 years.
Alabama is also applying Deepwater Horizon (DWH) oil spill funds for several coastal projects. These projects
are currently progressing or have been constructed but do not require OCS resources (East Fowl River
Restoration & Watershed Study, D’Olive Creek Watershed Restoration, Gulf State Park Enhancement Project,
Oyster Reef Restoration in Baldwin County, Swift Tract Living Shorelines, Marsh Island).
Alaska
There have been dozens of nourishment projects along Alaska’s coast dating back as far as 1922 (USACE,
2012) but almost all of them have been beneficial disposal projects. The total cost of these projects has
exceeded $164M (USACE, 2012), the overwhelming majority of which was required to maintain navigation for
Nome Harbor.
No OCS lease applications are expected for Alaskan projects within the 10-year planning horizon.
Very few dedicated beach nourishment projects have been undertaken in Alaska (Smith & Hendee, 2011) and
the state has no formal erosion control program (USACE, 2009). The Alaska Department of Environmental
Conservation (ADEC) developed their BEACH Program in 2002 in response to the authorization of The
BEACH Act by Congress; however, this program focuses mainly on providing grants to local communities,
tribal governments, and watershed councils to sample beach water for the presence of fecal contamination.
North Slope Borough’s (NSB) Beach Nourishment Program was authorized in 1991. The NSB invested over
$20M for a beach nourishment program using an offshore dredge to place gravel on the shoreline. This project
provided protective sediment nourishment to about 3,000 feet of shoreline before it was abandoned after being
severely damaged in a storm in 2000.
The 1995 Barrow and Wainwright Beach Nourishment Program: Budget and Cash Flow Update prepared by
BTS/LCMF, Inc., stated the Wainwright Beach Nourishment Project began with material dredged from offshore
borrow source sites and placed on the beach in 1995 to dissipate wave and storm energy, and to provide a
buffer zone. Approximately 95,000 cy of material were placed on the beach. Subsequent storms reportedly
have removed most of the gravel beach nourishment material. Again, no plans to reinstitute this project could
be found.
On the east coast of Cook Inlet, beach fill was placed in front of a sheet-pile retaining wall constructed at the
toe of an eroding bluff just north of the Nikiski ship terminals, in 2004. Again, this does not appear to be a
concerted effort that would require future OCS resources.
The shoreline in many parts of southern Alaska is rising due to glacial rebound. Elsewhere, melting of
permafrost is causing significant erosion. The typical response to date is to use structures to slow erosion or
retreat.
California
Projected OCS Sand Resource Needs and Effort
Project No: M17PX00021
12702.101 Page 10California has a greater number of nourishment projects performed to date (435) than any other state in the
US (ASBPA, 2017), though a lease to use OCS sand resources has never been issued in California (BOEM,
2017).
No application for an OCS lease is expected in California in the next 10 years due to a combination of water
depth and permitting restrictions.
There are 48 beach nourishment projects listed in the NFD, and none of them have used OCS sand
resources to date (BOEM, 2017). Most of the nourishment projects have relied on sand dredged from
navigation channels (California Geological Survey, 2005). Because of the narrow shelf, OCS sand resources
are generally in waters too deep for dredges in the US commercial fleet to access (Moffat Nichol, 2009).
According to the Coastal Regional Sediment Management Plan for The San Diego Region: “dredging at
depths greater than 90 feet would require specialized equipment and may not be cost-effective.” Along most of
the coast from CA to WA, the OCS starts in water depths that exceed 90 feet.
The California Coastal Sediment Master Plan (California Coastal Sediment Management Workgroup, 2012),
developed by the California Coastal Sediment Management Workgroup (CSMW), of which BOEM is a
member, did not list any beach nourishment projects that may use OCS resources. This is a collaborative
effort formed in 1999 by federal, state, and local agencies and non-governmental organizations committed to
evaluating and addressing California's coastal sediment management needs on a regional, system-wide basis.
Historically, most of the replenishment/nourishment activities in California have been pursued as local, rather
than regional, projects. They have been dominantly “opportunistic” projects, meaning that beach restoration
was not the primary purpose of the placement of fill. Rather, the beach systems were the receiving (disposal)
sites for dredged material from other primary activities such as harbor construction or channel maintenance.
Studies by the California Geological Survey (2005) and AECOM (2011) were used to identify beneficial
disposal projects in the NFD. Of the 48 projects, 30 were identified as beneficial use of navigation material
and 18 were identified as for beach nourishment from offshore sand in state waters. Only in recent years has
the number of “deterministic” projects become more common. In these projects, beach restoration through
replenishment and nourishment is the primary purpose. The Regional Beach Sand Project of the San Diego
Association of Governments (SANDAG) was the first regional deterministic beach-nourishment program on
the Pacific Coast of the U.S. The San Diego Regional Beach Sand Project II (AECOM, 2011) includes multiple
sites, but the borrow areas are all located in state waters.
The USGS recently completed a series of detailed offshore geology maps as part of the California Seafloor
and Coastal Mapping Program (United States Geological Survey, 2015). The maps have identified several
potential offshore sources of sand, including relatively thick (30 to 80 feet) deposits located within a couple of
miles of Pillar Point, Pescadero Point, Pigeon Point and the mouth of Waddell Creek. While these deposits
could prove to be rich sources of sand, removal for beach nourishment will face significant engineering, cost,
and regulatory challenges. Also, offshore sediment sources tend to be finer grained than the sand on native
beaches.
Monterey Bay National Marine Sanctuary (MBNMS) extends along 276 miles of shoreline from Marin County
to Cambria. The MBNMS enforces 13 federal regulatory prohibitions designed to preserve and protect the
natural and cultural resources and qualities of the ocean and estuarine areas within its boundaries, including:
• Drilling into, dredging, or otherwise altering the submerged lands of the sanctuary; or constructing, placing,
or abandoning any structure, material, or other matter on or in the submerged lands of the sanctuary (with
the exception of several activities, such as boat anchoring and harbor maintenance projects).
• Discharging or depositing, from within or into the sanctuary, any material or other matter (with the
exception of several activities, such as dredged material disposal at designated sites).
Projected OCS Sand Resource Needs and Effort
Project No: M17PX00021
12702.101 Page 11• Discharging or depositing, from beyond the boundary of the sanctuary, any material or other matter that
subsequently enters the sanctuary and injures a sanctuary resource or quality.
Given these regulations, dredging state or OCS sand resources in the MBNMS will face significant
environmental and regulatory challenges. It was determined that it was highly unlikely that a project would
come to fruition that would dredge OCS resources. However, current projects in the ASBPA database that
were adjacent to the USGS/BOEM Marine Sand Resource Assessment Study areas were assigned as
“Unlikely” in the NFD.
Connecticut
There have been nourishment events at 27 sites along the Connecticut coast since 1955. Overall, Connecticut
has placed over 4.8 MCY of sand along its beaches at a cost of over $15M (ASBPA, 2017). Connecticut has
not constructed any projects using OCS resources.
Given that there are no projects in Connecticut expected to require OCS resources, none of the projects have
a complexity rating.
Given the paucity of beach nourishment projects in Connecticut and the longer distance to OCS waters, no
OCS lease applications are anticipated for beach nourishment projects in Connecticut in the next 10 years.
Connecticut has employed beach nourishment in the past but predominantly in the western portions of Long
Island Sound. Connecticut’s shoreline is almost fully protected from waves developing in the Atlantic Ocean by
Long Island and fronted by Long Island Sound. The submerged lands in Long Island Sound are considered
state submerged lands over which BOEM would not exert regulatory authority for leasing.
Only one recent beach nourishment project (constructed in the last 20 years) could be identified, which was
the Hammonasset Beach State Park, Madison project. This relied on sediment dredged from the Housatonic
River.
Delaware
Delaware’s history of beach nourishment stretches back to 1953. Delaware has constructed close to 220
projects totaling over 35 MCY at a cost of over $180M (ASBPA, 2017). Delaware has not used OCS
resources for any of these projects to date (BOEM, 2017).
It is projected that four OCS leases may be required in the next 10 years, two for Bethany/South Bethany and
two for Fenwick Island. Bethany/South Bethany has a four-year renourishment interval while the Fenwick
Island project has a five-year renourishment interval meaning that at least two leases are likely for each
project. These leases combine for over 2.6 MCY of sand.
These projects each have a complexity value of 27, which matches the average level of complexity value for
potential projects using OCS sands.
Delaware has instituted several large-scale beach nourishment projects at Fenwick Island, Bethany Beach/
South Bethany Beach, and Dewey Beach/ Rehoboth Beach. A review of the Environmental Assessment for
Sand Borrow Area B (United States Army Corps of Engineers, 2016) suggested that the current borrow areas
have sufficient sand to sustain the proposed projects over the next decade. However, there are concerns
about the quality of material within the Bethany/South Bethany borrow area. Contractors complained about the
difficulty of dredging sand due to the high gravel content (personal communication with Mike Powell at
DNREC). This would likely create a need to use a different borrow source and one likely offshore in federal
waters. Thus Bethany/South Bethany has been listed as being likely to require an OCS lease. The
Projected OCS Sand Resource Needs and Effort
Project No: M17PX00021
12702.101 Page 12Bethany/South Bethany has a four-year renourishment interval suggesting that multiple leases may be
required over the 10-year NFD study period. The project has a complexity value of 27, which is average.
Having multiple discharge sites adds to the complexity but previous investigations have identified the
approximate location of the borrow area which simplifies the effort.
The material within the Dewey/Rehoboth beach borrow area appears satisfactory and thus no OCS resources
are expected to be required here.
The borrow areas for Fenwick Island have beach compatible material. However, OCS borrow sources are
immediately offshore of the project site and thus offer an affordable option. Thus, it has been deemed likely
that the Fenwick project may elect to apply for a lease to use OCS resources. The Fenwick Island project has
a five-year renourishment interval and thus it is possible that two leases will be required over the 10-year
forecast period. Fenwick Island also had a complexity value of 27, to mirror the average project complexity
value.
Delaware has a sand bypassing system at Indian River Inlet that assists in regional sediment management
(RSM). Thus, the shorelines in the vicinity of the inlet are managed based on RSM principles.
There are smaller nourishment projects along the Delaware Bay coastline. To date, these efforts have
exclusively used sand resources located within state limits. A review of the plans for these projects suggests a
continuation of the use f state resources. The latest discussions include the beneficial use of the Delaware
River for renourishment efforts (USACE and DNREC, 2016).
Florida
Florida has a long history of using OCS resources for beach nourishment dating back to 1944 (ASBPA, 2017).
Overall, Florida has spent more than $1.26B to place over 300 MCY of sand along its beaches (ASBPA,
2017), and beach nourishment efforts are expected to continue as beaches are a major driver of Florida’s
economy. BOEM has executed 22 lease agreements in Florida resulting in the placement of over 25.5 MCY of
sand to restore 142.4 miles of shoreline (BOEM, 2017).
It is anticipated that 16 projects will likely seek OCS leases in the next 10 years with another two rated as
possible though unlikely (Table 5.1 and Figure 5-1). The projects requiring OCS resources are the federal
projects in St. Lucie, Broward, Indian River, Miami Dade, Flagler, Brevard, Martin, Duval and Pinellas
Counties. The total lease volume under the Base Scenario could be 16.3 MCY while under an Elevated Need
scenario the volume would be 41.6 MCY.
The complexity ratings for Florida projects requiring OCS resources range from 39 for the Broward County and
St Lucie projects to 17 for the Pinellas County Sand Key and Duval County projects. For comparison
purposes, the average complexity rating for likely projects is 28.
The Florida Department of Environmental Protection (FDEP) Bureau of Beaches and Coastal Systems online
permit system was heavily utilized as a data source for this effort (FDEP, 2018), providing information about
permitted and planned borrow areas and volume requirements. Numerous projects recently had
Environmental Impact Statements (EIS) or Environmental Assessments (EA) prepared. These documents
were also valuable reference sources (e.g., USACE and BOEM, 2016). The Federal Business Opportunities
website (www.fbo.gov) also provided information on borrow areas used for awarded federal projects.
Projected OCS Sand Resource Needs and Effort
Project No: M17PX00021
12702.101 Page 13Table 5.1: Number of Expected Lease 5
Applications over the 10-year Forecast Period
Number of New Leases per year
in Florida
Higher Lower 4
Year
Certainty Certainty
2018 1 0 3
2019 3 1
2020 3 0
2
2021 2 0
2022 1 0
2023 3 1 1
2024 1 0
2025 1 0 0
2018
2019
2020
2021
2022
2023
2024
2025
2026
2027
2026 1 0
2027 0 0
Year
Total 16 2 Higher Certainty Lower Certainty
Figure 5-1: Number of Expected Lease Applications
over the 10-year Forecast Period in Florida
15 150
Total Project Complexity Value
13 125
Total Lease Volume (Mcy)
10 100
8 75
5 50
3 25
0 0
2018
2019
2020
2021
2022
2023
2024
2025
2026
2027
2018
2019
2020
2021
2022
2023
2024
2025
2026
2027
Year Year
Base Scenario Elevated Need Higher Certainty Lower Certainty
Figure 5-2: Total Lease Volume by Year in Figure 5-3: Project Complexity Values for Florida
Florida for Base and Elevated Need Scenarios Projects
Given the large number and complexities of projects in Florida, a county by county discussion is provided.
Projected OCS Sand Resource Needs and Effort
Project No: M17PX00021
12702.101 Page 145.6.1 Bay County The Panama City Beach project dominates the length of shoreline along Bay County. This was last constructed in 2017 using numerous offshore borrow areas. Sand resources remain available within these borrow areas, and it is not anticipated that OCS resources will be required within the 10-year horizon. Mexico Beach has been constructed using truck hauled sand of late. 5.6.2 Brevard County BOEM has issued several leases to assist Brevard County with nourishment of their beaches. Three of the nine anticipated leases over the next 10 years are for projects within Brevard County: Mid Reach/Patrick Air Force Base, North Reach, and South Reach/Indialantic. The North and South Reaches were constructed in 2018 and have leases that expire in 2020. The renourishment interval is approximately six years, suggesting that another lease agreement will be required within the 10-year horizon. Also, if there are any large storm events, it is likely that OCS resources will be required for repairs. The estimated volumes required for the next renourishment total approximately 3 MCY. The project complexity for these projects (23 to 26) is lower than the average project complexity (27.8), because leases have already been issued for these projects, and the main challenges are known. 5.6.3 Broward County Given the large population and significant tourism derived from Broward County’s beaches, they must continue to maintain their beaches. However, Broward County is running out of sand and has turned to upland sand sources for their latest (2017) renourishment efforts. Any additional exploration for offshore resources will likely occur in OCS waters. Broward is also looking at the potential for using offshore sand from OCS waters located offshore of counties to the north. Nearshore hardbottom limits the volume of sand that can be placed in any given project for Segments II and III of the Broward County Shore Protection Project. Thus, the anticipated volume of over 4.6 MCY may be higher than the ultimately constructed volume. These nearshore resources also increase the complexity of the project, so they each have a complexity rating of 39. The limited resource availability in southeast Florida also makes finding sand for projects difficult, which increases project complexity. Thus, Broward has the highest project complexity value of any project. Hillsboro Beach maintains its beaches using sand bypassed from Hillsboro Inlet. There is a borrow area located in state waters at the north end of the County that has been used and potentially has some additional sand remaining within it. It is not anticipated that an OCS lease will be required for this project area in the next 10 years. 5.6.4 Charlotte County Charlotte County has several reaches with beach nourishment projects. However, it is not anticipated that any of these projects will require OCS sands in the next 10 years. Manasota Key has identified numerous borrow areas, but while ranging from 2 to 4.5 miles offshore, these are all in state waters, because the state/federal boundary is approximately 10.5 miles offshore at this location. Knight Island and Bocarilla Island are considering the Stump Pass ebb shoal and offshore borrow sources to renourish their beaches. Again, they are all located in state waters, so there is no expectation of needing an OCS lease. Projected OCS Sand Resource Needs and Effort Project No: M17PX00021 12702.101 Page 15
5.6.5       Collier County
Collier County held a BOEM lease for Vanderbilt/Pelican Bay, Park Shore, and Naples Beach. This lease
expired in April 2018. Collier County has returned to using upland trucking due to the expense of offshore
sand, but it is likely that dredging from the OCS will return as an option. Due to the timing, this project has been
included as a separate lease for future needs. It is assumed that the existing lease will be used and/or
extended for the next renourishment period in 2019. A new lease has been included for a potential 2022
project, given that the renourishment period is typically three years. The project complexity for Collier County is
32, which is above average. The project complexity value is driven by nearshore hardbottom concerns and
multiple discharge sites and potential borrow areas.

South Marco Island will be nourished using sand dredged from Caxambas Pass. Therefore, no future need for
OCS resources is anticipated.

Marco Island/Hideaway Beach has a relatively low fill volume based on the permit application project
description. Borrow areas have been identified in the immediate vicinity of the project area (Big Marco
Pass/Capri Pass borrow area, Hideaway Beach nearshore borrow area, and Collier Bay borrow area).

5.6.6       Duval County
The 2016/17 renourishment placed about 1,060,000 cy of OCS sand to the beach and dunes following the
passage of Hurricane Matthew on October 7, 2016. The sand was dredged from Duval Shoal South, which will
likely continue to serve as the borrow area for the next decade. Another renourishment is planned in late 2018
to repair damage caused by Hurricane Irma. A new lease is anticipated for submittal in 2023 to support
construction of the next regularly scheduled project in 2025. The anticipated lease volume is 1.4 MCY. This
project has a relatively low project complexity value (17) as many studies have already been completed and
only a minor amendment to the existing OCS lease is anticipated.

5.6.7       Escambia County
There are three main sections of shoreline in Escambia County: Perdido Key, Pensacola Beach, and Santa
Rosa Island.

Perdido Key is requesting state funding to support a project using a borrow area located within state waters.
An eight-year renourishment interval is anticipated with intended construction in the next year or two.
Therefore, there is no need to locate an OCS borrow area within the 10-year NFD horizon.

Pensacola Beach was renourished in 2016 using sand located immediately offshore. There is sufficient
volume remaining in the borrow area for future nourishments that OCS sand is not anticipated as being
needed within the 10-year horizon of the NFD. Pensacola Beach has also been nourished using upland sand
sources.

To date, there has been little support for beach nourishment along Santa Rosa Island east of Pensacola
Beach with the last effort in 1961.

5.6.8       Flagler County

The USACE is leading the effort to construct the Flagler County Shore Protection Project. Borrow areas have
been identified in OCS waters (USACE, 2014c) and the Chief signed the report is December 2014. The project
is now waiting federal funding in WRDA 2018 so it’s not clear as to the start date of the next project. For
planning purposes, a start date of 2021 has been assumed. A state permit application could not be located.
This lease has a below average complexity value of 24 due to a developed borrow area.

Projected OCS Sand Resource Needs and Effort
Project No: M17PX00021

12702.101                                                                                                 Page 16
5.6.9       Franklin County
The County applied for a permit to nourish Alligator Point in 2006, but this project has been dormant. A borrow
area has been developed, but it is located in state waters.

5.6.10      Gulf County

Cape San Blas and the St. Joseph Peninsula are located in Gulf County. St. Joseph Peninsula is currently
scheduled to be constructed in the summer of 2018 using a borrow area located in state waters. However, an
OCS borrow area was identified and included in the permit application. Thus, future projects may use an OCS
source, and this has been listed as likely. The complexity value is just below average at 26.

Some nourishment from beneficial disposal of the navigation channel to St. Joe may be expected, but this
would be at the northern end of the St. Joseph Peninsula and not likely to affect the need for OCS resources.

5.6.11      Hillsborough County

Hillsborough County is the eastern side of Tampa Bay. There are no large-scale nourishment projects within
Tampa Bay, and none are expected. Therefore, no projects within Hillsborough County have been included in
the NFD.

5.6.12      Indian River County
Indian River County has significant nearshore resources that limit the volume of sand that can be placed
during any individual project. County projects have mostly focused on dune nourishment projects using upland
sand. However, they are limited in resources within state waters and have identified a potential borrow area in
OCS waters. Therefore, Indian River County has been listed as likely to use OCS resources in the NFD within
the next 10 years. Nearshore hardbottom increases the project complexity value to 33, which is above
average.

5.6.13      Lee County
Lee County has several sections of shoreline with a long history of beach nourishment projects. However, the
state/federal boundary offshore of Lee County is close to 10 miles offshore. Thus, there is greater potential to
locate sand resources in state waters.

Gasparilla Island has had three nourishment projects, the last in 2013, though another project is imminent. The
borrow area is located in state waters.

Costa Caya is an uninhabited barrier island. No projects are anticipated for this island in the next 10 years.

North Captiva Island is sparsely inhabited and has no bridge to the mainland. Thus, it is difficult to access, and
beach nourishment projects are difficult to justify economically. Therefore, a beach nourishment project using
OCS resources is not anticipated in the immediate planning horizon.

Captiva Island has an Erosion Prevention District to help fund their nourishment program, which extends back
to 1961. Sanibel and Captiva Islands have a history of joint projects, because the two islands are separated by
Blind Pass, a relatively small inlet. Projects along these islands have multiple offshore borrow areas, with one
located up to 9.6 miles offshore. However, all of these borrow areas are still within state waters, and it’s
unlikely that they will need a borrow area within 10 years that goes into OCS waters. Weight limits on bridges
going out to the island limits upland sand as a cost-effective source.

Projected OCS Sand Resource Needs and Effort
Project No: M17PX00021

12702.101                                                                                                Page 17
You can also read