State of The video streaming industry has reached a tipping point
←
→
Page content transcription
If your browser does not render page correctly, please read the page content below

State of

        The video streaming industry
        has reached a tipping point

Copyright © 2022 The Nielsen Company (US), LLC.
Watch anything good lately?
Of course, you have. How could you not? The amount of video programming today is staggering—and growing. As of February
2022, Gracenote, a Nielsen company, listed more than 817,000 unique program titles across U.S. traditional TV and streaming
services, with many of those titles featuring hundreds of individual episodes and chapters. Back in December 2019, there were
just over 646,000 unique program titles.

While many of those titles form the bedrock of the traditional TV universe, more recent content, especially during the past two
years, has been developed for over-the-top (OTT) release across the growing expanse of streaming services. And as choice
proliferates, consumers will increasingly rely on content platforms and services to provide them with the content they’re most
interested in.

Percentage of titles available across linear TV and streaming services
As of February 2022
                                                                                                       Program example | Platform

                     SVOD exclusively                            15%                                   Stranger Things    Netflix

                                                                                                                                             The significant shift in how consumers engage with video
               SVOD non-exclusively                                                        41%         Friends            HBO Max and        content has forever altered TV viewing, and the groundswell
                                                                                                                          syndicated TV
                                                                                                                                             of OTT platforms and content to engage streaming-hungry
                                                                                                                                             consumers highlights two critical takeaways:
Free ad-supported VOD services                                                       36%               Revenge            The Roku Channel

       Transactional VOD services                                                                53%   Yellowstone        Amazon, Apple TV
                                                                                                                                              1   Consumers have spoken, and streaming is
                                                                                                                          and Google Play         here to stay

                Linear TV exclusively                             16%                                  Wheel of Fortune ABC                       The explosion of new platforms, services and
                                                                                                       (current season)
                                                                                                                                              2   channels has become dizzying to consumers, and
                                                                                                                                                  there is no blueprint for companies to secure their
         Linear TV non-exclusively                                             24%                     Blue Bloods        CBS and many
                                                                                                                          OTT platforms           long-term loyalty or their own business growth

Note: Percentages do not sum to 100% because the titles are not mutually exclusive
SVOD–Subscription video on demand
Source: Gracenote Global Video Data

                                                                                                                                                                             Copyright © 2022 The Nielsen Company (US), LLC.   2
Tracking the impact of connectivity on media consumption
The near ubiquity of internet connectivity has exponentially fragmented the media landscape,        Audiences couldn’t be happier with the growing expanse. Last year, Americans watched
providing consumers with seemingly countless ways to satiate their hunger for content. In the       nearly 15 million years’ worth of streaming video content, and streaming providers are steadily
fall of last year, more than 81% of U.S. homes had at least one TV-connected device1, up from       increasing their share of consumers’ total TV time. In February of this year, content from
72% back in 2019. That connectivity, combined with the hundreds of direct-to-consumer options       streaming platforms accounted for just under 29% of consumers’ total time with TV, ahead of
that offer everything from high-profile movies to DIY and adventure to sports programming, has      broadcast programming (26.4%) for the fourth straight month.
transformed how we use our TVs. Late last year, Americans 2 and older spent 32% of their total
                                                                                                    But despite the significant growth of the streaming industry, consumers’ media appetites are
TV time with TV-connected devices (68% with traditional TV). Among kids 2-17, the percentage
                                                                                                    bigger than just one option can satiate, especially with respect to genres like news and sports,
was a whopping 64%.
                                                                                                    which command significant audiences across live TV. Despite the growing choice of viewing
To keep pace with consumer behavior, streaming-first mindsets have become table stakes for          options, the television set remains the dominant device for reach, but the phrase “watching TV”
content creators and distributors. Many traditional TV companies, such as Discovery and HBO,        means much more than it has historically.
have already pivoted by earmarking some—or even all—of their new content for their own
                                                                                                    Today, television sets are simply becoming giant screens—a means of engaging with any and
streaming services. That’s a significant shift from where streaming started: online subscription-
                                                                                                    all content, including audio. In fact, smart TVs are as popular for streaming music as smart
based distribution as an alternative to traditional video rentals.
                                                                                                    speakers.

                                                                                                    Devices consumers use for their paid audio streaming services

                                                                                                                                         Smartphone                                                                                        80%

                                                                                                                                      Smart speaker                                           41%
                                                                                                            (e.g., Amazon Alexa, Google Home, Sonos, etc.)

                                                                                                                                             Smart TV                                         41%

                                                                                                                                             Computer                                      39%
Kids 2-17 spend

64%
                                                                                                                    Internet connected device                                            37%
                                                                                                    (e.g., Roku, Apple TV, Chromecast, Amazon Fire TV, etc.)

                                                                                                                                                  Tablet                           31%
of their TV time with
                                                                                                                          Connected car system                              24%
TV-connected devices
                                                                                                    Source: Nielsen streaming media consumer survey

                                                                                                    1 Any device that enables internet access (e.g., connected gaming consoles, connected DVD players, Roku)

                                                                                                                                                                                                    Copyright © 2022 The Nielsen Company (US), LLC.   3
In addition to reaching the biggest audience, TV also drives the most engagement across our
media options, as the average adult spends 4 hours and 49 minutes watching TV each day—and
we still spend more than twice the amount of time watching traditional live programming than
content we access through our connected devices, especially with the return of live sports after
a tough 2020. Between January and September of last year, 98% of the most viewed broadcast
programs were sports, and 72% were across cable programs, engaging consumers for a total of
more than 189.5 billion minutes2.

Average daily time with media
Hours:minutes Q4 2021
                                                                  Time-      TV-connected
                                    Live TV                     shifted TV      devices

                                    2:53                          0:34          1:22

                                                 4:49
                                              Total use of TV
Source: Nielsen National TV Panel

                     Americans spend more than

                   2x               as much time with live TV as they do with content
                                    they access through connected devices

2 Nielsen national TV measurement

                                                                                                   Copyright © 2022 The Nielsen Company (US), LLC.   4
Tracking the explosion—and impact—of streaming choice
It’s difficult to imagine a successful streaming service not offering a wide variety of choice, but   Across age groups, consumers 35-49 spend the most money on streaming services, as 24% pay
today’s offerings are vast and varied. That growth and variety has enticed consumers to forego        for five or more. Furthermore, consumers aren’t simply replacing their traditional TV options with
living with just one or two options, especially as emerging platforms continue placing big bets on    OTT options. In many cases, consumers continue to add to their media options when content
high-profile content intended to attract new audiences.                                               appeals to them. They do this to a degree, largely because of cost: 56% of survey respondents
                                                                                                      say cost is the primary reason why they don’t subscribe to more services.
Number of paid streaming services among paid video subscribers
2022            18%                       24%               23%            18%        10%      7%
                                                                                                      Streaming video share of time spent by age
2019                       35%                             33%               21%            8% 3%     February 2022

                                               1   2   3   4      5   6+                                   13%          5%      6%            15%                      31%                                         31%
Source: Nielsen streaming media consumer surveys
                                                                                                                                      P2-11        P12-17    P18-24     P25-34        P35-54           P55+

                                                                                                      Source: Nielsen Streaming Platform Ratings
And audiences are eating it up—even when cost is a factor. In fact, a recent custom survey
found that 93% of Americans plan to either increase their paid streaming services or make no
change to their existing plans. While reflective of those we surveyed, this data stands somewhat      Monthly spend on video                                                     Average weekly time
opposed to market expectations by many, such as Deloitte, of significant churn as the streaming       streaming services                                                         streaming video content
wars escalate.                                                                                                                                                                   In billions of minutes
                                                                                                           I use, but don’t
                                                                                                      personally subscribe               2%
Bundling is the streaming future that                                                                                                                    The struggle to find content is real, and
                                                                                                                                                         the complexities are increasing as media

consumers want
                                                                                                                                                         companies seek to optimize consumer
                                                                                                                                                         experiences. A notable example is how
                                                                                                                                        NBCUniversal leveraged its various consumer endpoints,
                                                                                                                                        including Peacock, for the 2021 Summer Olympic Games
Streaming appetites aside, the amount of time in any given day is fixed, and the increasingly vast landscape has many consumers
                                                                                                                                        in Tokyo and the 2022 Winter Olympic Games in Beijing.
feeling maxed out and unsure where to find the content they’re most interested in.
                                                                                                                                        When consumer feedback indicated that the streaming
While cost always plays a role in any decision to add or subtract services, the abundance of choice has survey respondents feeling      experience during the 2021 Summer Olympics was
overwhelmed by too many options as well. Nearly half (50%) say that the increase in options makes it challenging to find what they’re   confusing, NBCUniversal changed its tactics. The revised
looking for, which represents another consideration for companies seeking to acquire new customers.                                     streaming strategy dramatically simplified consumers’
                                                                                                                                        ability to find the content they wanted during the 2022
The frustration has many wishing for streaming content bundles, somewhat of a pivot from the days when many digital-first               Winter Olympics.
consumers were on a pilgrimage to cut the cord from the bundled content offered by cable and satellite services. Today, 64% have
hopes for streaming bundles, while only 9% blatantly disagree that there’s a need for bundled services.                                 2021 Summer Olympics in Tokyo
                                                                                                                                        Live streaming
                                                                                                                                        • Peacock: Gymnastics, track & field, men’s basketball and
                                                                                                                                          some exclusive studio programming during the Summer
                                                                                                                                          games, with basketball exclusive to paid tiers

                                                                                                                                        • NBCsports.com: broadcast primetime and other events,
                                                                                                                                          but access required a pay TV login

64%                                                                                                                                     Replay streaming
                                                                                                                                        • Peacock, NBCOlympics.com and the NBC Sports app
of viewers say they wish there was a bundled
video streaming service that would allow them
                                                                                                                                        2022 Winter Olympics in Beijing
to choose as few or as many video streaming
services that they wanted, more like channels                                                                                           Live streaming
                                                                                                                                        • Peacock

                                                                                                                                        Replay streaming

46%
                                                                                                                                        • Peacock

of viewers say it’s harder to find the video streaming
content that they want to watch because there are too
many streaming services available to consumers

                                                                                                                                                                      Copyright © 2022 The Nielsen Company (US), LLC.   6
There is growing industry awareness that consumers are feeling overwhelmed, and providers are starting to respond. While
many efforts have largely focused on allowing audiences to add select services to existing packages (e.g., add Showtime
to a range of OTT services), select companies have bundled traditional and streaming offerings, such as Xfinity and Apple
TV. Verizon will soon join, as its announced +play platform involves partnerships with Netflix, Peloton, Disney+ and other
streamers. The service will allow customers to discover, purchase and manage some of their favorite subscriptions—at no
additional cost.

But bundling is just one way to help consumers find what they’re looking for. With so much content available, streaming
services can do much more to personalize the content discovery experience and drive deeper viewer engagement with
video content.

Making it easy for audiences to find new content they’ll love is key. That way viewers don’t get stuck aimlessly scrolling or
reverting to half-watching a stale, yet familiar choice and disengaging. Applying hyper-detailed video descriptors to content
catalogs can help here, as they crystalize the storylines and context that make up the essence of a show or movie. This
data enables nuanced discovery paths and offers fresh and relevant program recommendations that are aligned with a
viewer’s individual tastes and viewing history.

 Recommendations and suggestions can certainly play a role in content discovery, but they don’t do enough to make video
 content—which is very visual—stand out. In the streaming realm, the video carousel is the storefront. Visitors aren’t
 logging in to read. They’re logging in for visual experiences. And that’s where personalized images can enhance a platform’s
 visual merchandising.

 Let’s say a new release becomes available
 and a platform does its best to push it to
 viewers, but it only uses one representative
 image. That image may not appeal to every
 potential audience member. But if the platform
 uses different images to appeal to different
 viewers, the video carousel quickly becomes
 a personalized storefront that elevates the
 customer experience.

                                                     Source: Gracenote Personalized Imagery

                                                                                                  Copyright © 2022 The Nielsen Company (US), LLC.   7
Content is a key differentiator
   In addition to struggling to find what they’re looking for, consumers are increasingly seeking content they identify with—
   content that reflects who they are. And for many, that means seeking content outside of the biggest channels.

   Share of screen ranking by platform for identity groups

                                 Broadcast                                          Cable                         SVOD

                  White                            59.5%              White                 79.6%   White                75.1%

                  Men                              56.3%              Men                   56.5%   Men                  57.4%
                                                                                                                                 Across the streaming landscape, streaming video on-demand
                  Women                            43.7%              Women                 43.5%   Women                42.6%
                                                                                                                                 (SVOD) options remain the biggest draw, but ad-supported video-
                  Hispanic/Latinx                   22.1%             Black                 13.3%   Black                17.9%   on-demand (AVOD), multichannel video programming distributors
REPRESENTATION

                                                                                                                                 (MVPDs) and virtual MVPDs (vMVPDs) accounted for a combined
                  Black                             21.0%             LGBTQ                  7.6%   Hispanic/Latinx       8.5%
                                                                                                                                 36% of total streaming minutes between July and December 20213.
                  LGBTQ                               3.1%            Hispanic/Latinx        3.6%   LGBTQ                 4.0%

                  MENA                               2.4%             MENA                   3.5%   East Asian            2.8%   Percent of streaming minutes
                  East Asian                         2.0%             East Asian             1.4%   MENA                  2.1%
                                                                                                                                 July-December 2021

                  South Asian                        0.5%             South Asian            1.1%   South Asian           1.5%

                  Southeast Asian                    0.5%             Southeast Asian        0.2%   Southeast Asian       0.7%

                  Native Americans                    0.1%            Native Americans       0.1%   Native Americans      0.4%           53%                              25%                               10%
                 Source: Gracenote Inclusion Analytics, 2020-2021 TV season

                                                                                                                                       Total SVOD                       Total AVOD                Total MVPD/vMVPD

                                                                                                                                 Note: “Other” categories, which sum to 12%, not included
                                                                                                                                 AVOD includes YouTube and YouTube TV
                                                                                                                                 Source: Nielsen Streaming Platform Ratings

                                                                                                                                 3 Nielsen Streaming Platform Ratings

                                                                                                                                                                                       Copyright © 2022 The Nielsen Company (US), LLC.   8
vMVPDs, which allow consumers to access an array of VOD streaming content, live broadcast programming and cable sources,                Ad-supported streaming options are also attracting more diverse
have become increasingly popular as consumers tap into digital channels to access new content options. Over the past three              audiences than traditional TV and SVOD options. For example,
years, vMVPD adoption has grown from 7.1% of all TV households to 12.5%5, with YouTube TV, Hulu+ Live, DirecTV Stream and               Pluto TV, an ad-supported video service owned by Paramount
Sling TV driving much of the growth.                                                                                                    (formerly ViacomCBS), attracts about twice as many Black viewers
                                                                                                                                        as traditional linear TV (36% vs. 17%). Similarly, Black audiences
vMVPD adoption is rising                                                                                                                account for 39% of Tubi’s viewership (Tubi is an ad-supported
                                                                                                                                        streamer owned by FOX).
                  13%
                                                                                                     AGE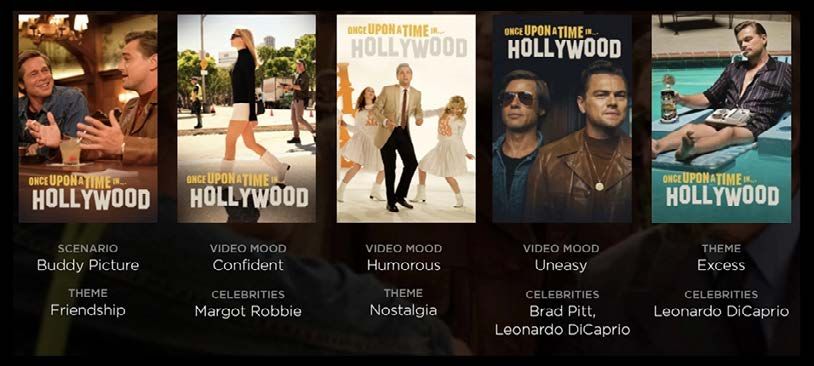
The bottom line                                                                              Sources
                                                                                             Gracenote Global Video Data
                                                                                             Gracenote Inclusion Analytics
Today’s media landscape is a treasure trove of options for consumers, and the volume
                                                                                             Gracenote Personalized Imagery
of streaming content continues to expand as platforms add more content. With an
audience-first mindset, the media industry can help consumers find what they’re looking      Nielsen National TV measurement
for and use what they know about their evolving viewing behaviors to keep them               Nielsen NPOWER
engaged. And as consumers engage with new ad-supported options, marketers can                Nielsen Streaming Content Ratings
leverage TV and streaming-specific segments to ensure they’re reaching and engaging
                                                                                             Nielsen Streaming Platform Ratings
with their desired audiences. Additionally, buyers and sellers can tap into streaming-rich
media planning tools to identify the incremental reach that streaming audiences bring to     Streaming Media Consumer Survey
                                                                                             The Nielsen Streaming Media Consumer Survey was conducted in English-only from Dec. 14, 2021-
cross-platform campaigns to understand the full picture of who they are targeting.
                                                                                             Jan. 6, 2022, via an online survey. It was based on a representative sample of 1,394 U.S. adults 18+ who
                                                                                             currently use streaming video and/or audio services.
The audience will steer the future of the streaming landscape, and the media industry
can help consumers in their media journeys by leveraging data to ensure they never get
lost along the way.

                                                                                             About Nielsen

                                                                                             Nielsen shapes the world’s media and content as a global leader in audience measurement,
                                                                                             data and analytics. Through our understanding of people and their behaviors across all
                                                                                             channels and platforms, we empower our clients with independent and actionable intelligence
                                                                                             so they can connect and engage with their audiences—now and into the future.

                                                                                             An S&P 500 company, Nielsen (NYSE: NLSN) operates around the world in more than 55
                                                                                             countries. Learn more at www.nielsen.com or www.nielsen.com/investors and connect with
                                                                                             us on social media.

                                                                                             Audience Is Everything®

                                                                                                                                                                      Copyright © 2022 The Nielsen Company (US), LLC.   10
You can also read