State Support of Public Universities - PRESENTED TO THE JOINT COMMITTEE ON WAYS AND MEANS, SUBCOMMITTEE ON EDUCATION - Oregon.gov
←
→
Page content transcription
If your browser does not render page correctly, please read the page content below
State Support of Public
              Universities
              PRESENTED TO THE JOINT
              COMMITTEE ON WAYS AND
              MEANS, SUBCOMMITTEE ON
              EDUCATION
              BEN CANNON, Executive Director
              VERONICA DUJON, Director of Academic Policy and
              Authorization
              JIM PINKARD, Director of Postsecondary Finance and
              Capital
              2021
230           NOTE: this presentation includes minor corrections made after the hearing and reported to the
  230         Committee in follow up letters.
        EOU
Introduction:
  Oregon Public
  Universities
  BEN CANNON, Executive Director,   OIT   EOU

  HECC

  Guest speakers:
  TOM INSKO, President, Eastern
  Oregon University

  ASHLEY COX , graduate of Oregon
                                    UO    SOU
  Institute of Technology

231
Budget Themes: Investing in Postsecondary Education and
      Training Will Move Oregon Forward

       Sustained Reinvestment to                                              Address Oregon’s
                                          Invest in
       Support Affordable, Quality                          Prioritize the          College
                                     Reskilling/Upskilli
         Postsecondary/Training                             Underserved,         Affordability
                                     ng the Workforce
       Options, and Reengage the                           Eliminate Racial   Crisis, Prioritizing
                                     to Ensure Oregon
       Tens of Thousands who Did                             Equity Gaps       Those Who are
                                      Recovers Strong
          Not Enroll During the                                                Struggling Most
                Pandemic

232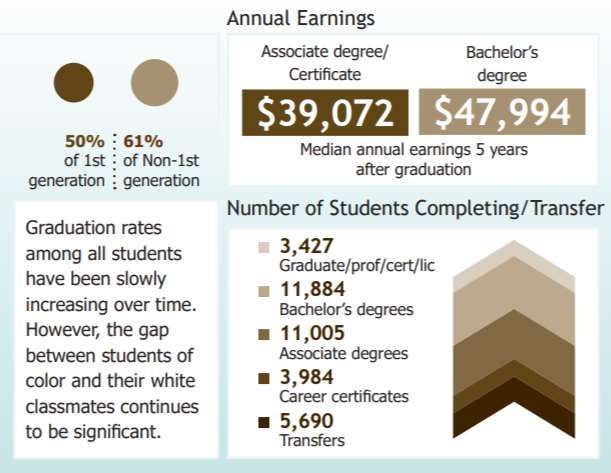
The PUSF is
                                                                                                       38.9% of the
 State Support for Public Universities                                                                 HECC budget.

              Activity                       Description                      2019-21 LAB      2021-23 CSL       2021-23 GRB
      Public University Support     Funds critical investments to public      $836.9M GF      $886.1M GF        $836.9M GF
      Fund                          universities to support educational and
                                    operational expenses

      Change from 2019-21                                                                                       0.0% from LAB
                                                                                                                -5.9% from CSL

      Support Debt Service on       Supports debt service on previously       $403.8M Total   $403.8M Total     $430.2M Total
      Previous University Capital   approved capital projects for the
                                    universities
      Projects                                                                 $200.5M GF      $200.5M GF         $226.8M GF
                                                                               $ 36.9M LF      $ 36.9M LF         $ 36.9M LF
                                                                               $ 4.1M OF       $ 4.1M OF          $ 4.1M OF
      Change from 2019-21                                                                                       6.5% from LAB
                                                                                                                6.5% from CSL

233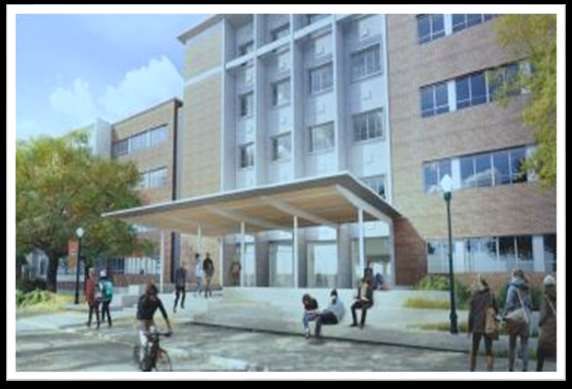
Public Universities: New Capital Funding

    Activity                      Description                       2019-21 LAB          2021-23 CSL     2021-23 GRB
University New Capital   New general obligation bond proceeds    $77.7M OF Limitation   N/A            $309.4M OF Limitation
Funding                  funding five new capital construction                                         ($80M State Paid)*
                         projects and Capital Improvement and
                         Renewal distributions for all public                                          *GRB recommends reserving an
                         universities.                                                                 additional $225M in bonding
                                                                                                       authority for 2020 session to
                                                                                                       complete work on 10-year
                                                                                                       strategic plan for capital
                                                                                                       investments.

Change from 2019-21                                                                                    298.2% from LAB
                                                                                                       -100% from CSL

  234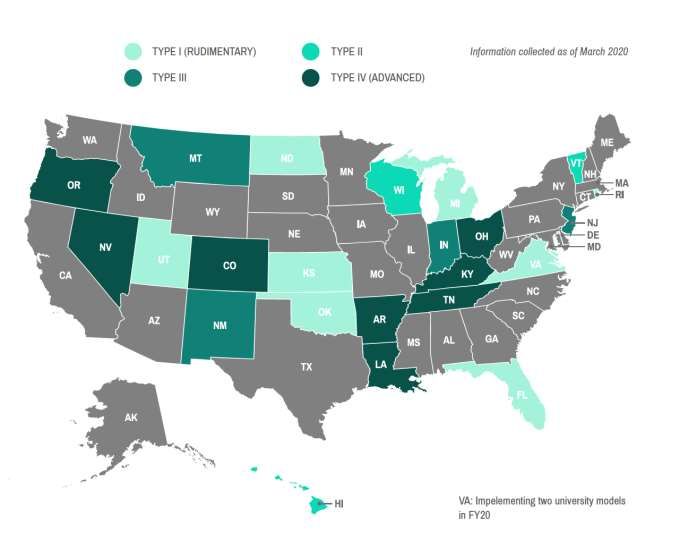
Public University Sports Action Lottery
           Activity                           Description                           2019-21 LAB     2021-23 CSL        2021-23 GRB

 Sports Lottery Program   The Sports Action Lottery was established in ORS        $14.1M LF       $13.5M LF       $15.1M LF
                          461.535 and ORS 461.543 to provide funding for
                          intercollegiate athletics at public universities. The
                          statute sets aside 12% of funds for non-athletic
                          graduate student scholarships. The remaining
                          88% is distributed to the intercollegiate athletic
                          departments at public universities.

 Change from 2019-21                                                                                              7.25% from LAB
                                                                                                                  11.75% from CSL

235
Oregon’s 7 Public
  Universities:
  Serving Oregon
  Students and                    UO    EOU

  Communities
  VERONICA DUJON, Ph.D.
  Director of Academic Policy &
  Authorization

                                  OIT   UO

236
7 Public Universities, Diverse Missions

                                                                                                                             Approximately 80% of
                                                                          PSU
                                                                                                                             total public university
                                                                                                                             enrollment is at the three
                                                    WOU                                                                      largest institutions (PSU,
                                                                                                                             UO, OSU).
                                                                                                                       EOU

                                                             OSU

                                                                   UO                                                        Oregon’s regional
                                                                                                                             comprehensive
                                                                                                                             universities play a
                                                                                                                             significant role in the
                                                                                                                             economy, community, and
                                                                                                                             education attainment
                                                                                                                             (EOU, SOU, WOU, OIT).

                                                          SOU
                                                                    OIT

237    Source: HECC Statewide Snapshots. Size of circles represents relative size of enrollment at the institutions.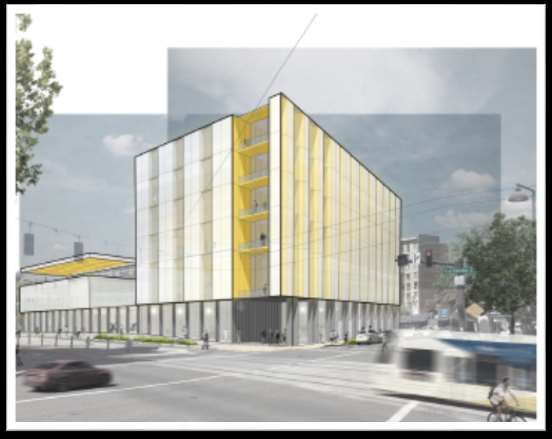
Snapshot of Enrollment at
Oregon’s Public Universities
•     Oregon’s universities enrolled 126,462 students in
      2018-19, including 70,278 resident
      undergraduates.
•     Of resident students in universities, 21% were 1st
      generation college students.
•     Of resident students, 70% were pursuing an
      undergraduate degree or certificate.
      • Primary areas of instruction:
              10% Admitted Graduate/Professional
              70% Admitted Undergraduate
              20% Non-degree seeking
          View the full Statewide Snapshots Report, Oregon
          Resident Students at Public Institutions, 2018-19
          https://www.oregon.gov/highered/research/Pages/snapshots.
238       aspx
Undergraduate Enrollment has Decreased in the Universities
                                      Public University Undergraduate Enrollment by Headcount and Residency
      80,000         74,023
      70,000                                                                                                                                                68,932
      60,000

      50,000

      40,000
                                                                                                                                                            33,605
      30,000         24,273

      20,000

      10,000

            0
                       2010               2011                2012               2013               2014                2015         2016   2017   2018   2019
                                                                                        Resident               Non-Resident

239      Source: HECC analysis of student-level records from public universities. Includes undergraduate and nonadmitted students.
Serving a More Diverse Student Body: Resident Enrollment by
Race/Ethnicity
100%
Asian American
90%
Black/African American
80%
70% Hispanic/Latinx
60%
Native American/AL
Native
50%
Native Hawaiian/Pac.
40% Islanders
30% Two or more
20%
Unknown
10%
White
0%
2010-11 2011-12 2012-13 2013-14 2014-15 2015-16 2016-17 2017-18 2018-19 2019-20
240 Source: HECC analysis of student-level records from public universities. Includes undergraduate, graduate, and nonadmitted students.Public Universities are Serving a Diverse Student Body:
Resident, Public University Enrollment by Race/Ethnicity – Annual Headcount
through 2019-20
9,555
6,856
5,036
4,703 4,442
4,582
4,190
1,449 1,486
1,364
1,003 718
434 299
2010-11 2011-12 2012-13 2013-14 2014-15 2015-16 2016-17 2017-18 2018-19 2019-20
Asian American Black/African American Hispanic/Latinx Native American/AL Native
Native Hawaiian/Pac. Islanders Two or more Unknown
53,632
43,206
2010-11 2011-12 2012-13 2013-14 2014-15 2015-16 2016-17 2017-18 2018-19 2019-20
White
Source: HECC analysis of student-level records from public universities. Includes total annual headcount for resident, undergraduate and non-admitted undergraduate
241 students at universities.2019-20 Completions
25,080
Total Degrees/Certificates Earned
at
Oregon Public Universities
16,435
by Residents
242 Source: HECC analysis of student-level records from public universities. Includes undergraduate, graduate, and nonadmitted students.Resident Degree Completion has Increased Even as
Resident Enrollment has Declined
Resident Degrees and Enrollment
18,000 62,000.0
16,000 60,000.0
14,000
58,000.0
Resident Enrollment (FTE)
12,000
Resident Degrees
56,000.0
10,000
54,000.0
8,000
52,000.0
6,000
50,000.0
4,000
2,000 48,000.0
0 46,000.0
2006-07 2007-08 2008-09 2009-10 2010-11 2011-12 2012-13 2013-14 2014-15 2015-16 2016-17 2017-18 2018-19 2019-20
BA/BS Grad. Certificate Master's PhD Professional FTE Enrollment
243 Source: HECC analysis of student-level records from public universities. Includes undergraduate, graduate, and nonadmitted students.Graduation Rates Have Risen at Oregon Public Key Performance Metric #7 –
UPDATED February 2021
Universities
At public universities, the percentage of first-time, full-time freshmen who earn a
bachelor’s degree within six years rose from 61.1% to 67.2% in the last decade
Highest rate 75.4%
61.1% 67.2%
65.4%
54.9% 52.9%
Lowest rate
2005 2006 2007 2008
2009 2010 2011 2012 2013 2014
Cohort year
University - Resident students University - Nonresident students
Source: HECC analysis of student-level records from public universities. University rates include resident and non-resident, first-time, full-time freshmen and include inter-
244 institutional graduations. Highest and lowest rates for 2019 reflect the highest and lowest rates by institution for Oregon resident students.Snapshot of Completion at at
Oregon’s Public Universities
• In 2018-19, 66% of 1st time, full-time university
freshmen completed a bachelor’s degree within 6
years.
• The completion gap between students of color and
their white classmates continues to be significant.
View the full Statewide Snapshots Report, Oregon
Resident Students at Public Institutions, 2018-19
https://www.oregon.gov/highered/research/Pages/snapshots.
245 aspxThe Majority of Transfer Students Complete, but not at Rates
Equivalent to Peers
GRADUATION RATE BY TRANSFER STATUS, 2019-20
Freshmen who were still enrolled in third year
Transfer students who entered with 90+ credits
85%
Percent who earned bachelor’s degree
Transfer students face
an uphill challenge
67% with inconsistent
requirements and too
many hurdles that
derail them on the
path to completion
0.0%
Source: HECC analysis of student-level records from public universities. Notes: For this analysis, “transfer students” are defined as new, resident students who were admitted to the
246 university with 90 or more credits from an Oregon community college. Rate for non-transfer students includes new, resident, first-time, full-time freshmen who were still enrolled in
their third year.Resident Undergraduate Degrees Awarded at Oregon Public
Universities, by Pell Grant Status
12,000
10,562 10,567
10,205
10,000 9,601
8,676 9,002
8,487 8,666
8,271 8,123 8,046 7,995 8,158
7,691 7,689 7,878 7,783 7,631
8,000 7,221
6,235
6,000
4,000
2,000
0
2010-11 2011-12 2012-13 2013-14 2014-15 2015-16 2016-17 2017-18 2018-19 2019-20
Pell No Pell
Source: HECC analysis of student-level records from public universities. Notes: Degree totals do not include certificates or Associate degrees. Collection of Pell data
247
began in 2002-03. A student receiving a Pell in any year before graduating is included in the Pell category. In 2008 Pell Grant eligibility was expanded significantly.Earnings Have Risen Steadily for Most Groups, Key Performance Metric
#13-14
and the Racial/ethnic Earnings Gap has Narrowed
(2018-19)
Median earnings of university graduates with bachelor’s degrees, five years after completion,
It is too
over time and disaggregated by race/ethnicity.
early to
know if this $50,460
$49,294
progress will $45,517 $48,073
$47,994
slow or $45,546
$45,177
$40,447 $44,342
reverse as a $40,228
result of the $39,490
$39,320 $38,117
pandemic. $36,272
Reporting year
2016 2017 2018 2019 2020
All students Native American or Alaska Native
Asian American Black or African American
Source: HECC analysis of Oregon public university student-level records and earnings data from Oregon Employment Department.
248
Notes: Includes individuals who were awarded a bachelor’s degree and were employed in Oregon five years later.Graduation rates at public universities are rising Key Performance Metric
#7-8
overall, and most racial/ethnic gaps have
narrowed, but wide gaps remain (2019) Public university graduation rates
have risen for Hispanic/Latinx and
Percentage of public resident, university first-time, full-time white students but not as noticeably
freshmen who earn a bachelor’s degree within 6 years, overall and by for African American or Native
American students.
race/ethnicity
79.4%
71.5%
68.1% American Indian or Alaska Native
62.2% 67.2% Asian American
61.1% 60.0% 59.3% Black or African American
56.4% Hispanic or Latinx
52.6% 52.2%
51.5% Native Hawaiian or Pacific Islander
White
42.4% 42.9% TOTAL
Fall 2014 entering cohort
2005 2006 2007 2008 2009 2010 2011 2012 2013 2014 Resident: 67.2%
Cohort year Nonresident: 65.4%
Source: HECC analysis of analysis of student-level records for public university data on resident, first-time, full-time freshmen students. Nonresident graduation rate by race/ethnicity for the 2014 cohort is as
follows for universities: Asian American (64.5%), Black/African American (51.2%), Hispanic/Latinx (63.5%), Nat. American/AL Native (44.0%), Nat. Hawaiian/Pac. Islander (40.7%), White (66.7%), All students
249 (65.4%). Notes: Currently there is no historical data for the Native Hawaiian or Pacific Islander category. Prior to the 2010 cohort, the Asian American group included Native Hawaiian and Pacific Islander
categories.Time to Degree by Underserved groups at Universities
Bachelor’s Degree, Universities
By Race/Ethnicity By 1st Generation Status
4.5 4.5
3.7 4.0 3.7 3.7 3.7 4.0
3.7 3.7
Asian American Black/African American
1st Gen Non-1st Gen Unknown
Hispanic/Latinx Native American/AL Native
By Gender By Pell Eligibility
4.2 4.0
4.0
3.7
3.7
Female Male Unknown Pell Recipient Non-Pell Recipient
Source: HECC analysis of student-level records from public universities. Shows median years to a Bachelor’s degree earned in 2019-20 by resident, first-time freshmen. Pell
250 eligibility includes students who ever received a Pell grant. First generation status is indicated only for those students who filed a FAFSA or ORSAA.Public University
Funding in Oregon
JIM PINKARD, Director of
Postsecondary Finance and Capital EOU OSU Cascades
PSU UO
251History of Public University Investment
State Funding for Universities (in millions)
$1,600 $1,504.1 $1,508.8
$1,400 $1,305.6
$1,200
$1,000
$760.7
$800
$600
$400
$200
$0
2007-09 2009-11 2011-13 2013-15 2015-17 2017-19 2019-21 LAB 2021-23 CSL 2021-23 GRB
Public University Support Fund State Programs (Including One-Time Programs) Public Service Programs
Outdoor School (LF) GF Capital Debt Service
Sports Lottery
Sources: HECC Office of Postsecondary Finance and Capital.
- Legislative funding change during the 2013-15 biennium separated State Programs from the Public University Support Fund.
252
- 2013-15 State Programs includes ETIC (ETSF) appropriation after transition to OEIBPublic University State Funding (GF Only)
$1,200 $1,135.2
$1,088.7
$1,025.3
$1,000
$800
$644.3
931.2 884.7
$600 837.7
778.5
706.4
$400 633.3
671.3 562.6
626.2 617.1 592.2 486.5
543.1
$200
190.5 204.0 204.0
119.7 153.2
68.7 86.8 89.2
$0 18.1 21.2 26.5 30.3 39.4
1999-01 2001-03 2003-05 2005-07 2007-09 2009-11 2011-13 2013-15 2015-17 2017-19 2019-21 2021-23 CSL 2021-23
GRB
Debt Service University Support (non inflation)
253 Source: HECC Office of Postsecondary Finance and Capital. The general fund appropriations depicted include PUSF and state programs (excluding one-time programs).State Appropriations per Resident Student FTE
(Adjusted for Inflation)
$11,630 $10,952 CSL
$9,921 $10,503 GRB
$9,385 $8,279 $8,257 $9,126
$7,247
$7,457 $7,745
$6,585
$5,718
1999-01 2001-03 2003-05 2005-07 2007-09 2009-11 2011-13 2013-15 2015-17 2017-19 2019-21 2021-23
Notes:
• Includes Debt Service
• University data includes PUSF and State Programs
• Enrollment for 2021, 2022, 2023 assumed at 2020 levels
• Inflation adjustment based on HECA
• Excludes non-resident university enrollment
Source: HECC Office of Postsecondary Finance and Capital. The HECA is the higher education cost adjustment factor. It includes different cost categories than a consumer
254 based inflation measure like the CPI.Student Success
and Completion
(SSCM) Model
JIM PINKARD, Director of OIT UO
Postsecondary Finance and Capital
SOU UO
255Overview of the Public University Support Fund (PUSF)
$836.9 Million •Legislatively-adopted PUSF for HECC
distribution to Oregon’s seven public
(2019-21) universities in 2019-21.
•HECC distributes 49% of the
$410.1
$426.8 Million appropriation in the first year of the
biennium (FY20), 51% in the second
(FY2021)
(FY2020) (FY21).
$21.5
$28.2
$30.3
$78.7 •The amount per university
is determined based on a
$23.6 $141.2 formula the HECC
$103.3
establishes via
administrative rule (ORS
350.075).
256
EOU OIT OSU PSU SOU UO WOUThe Transition to an Outcomes-Based Funding Formula
The HECC’s Equity Lens is a
cornerstone for its policy Commitment
and budgeting. Formula to review
formula every
redesign was one of its five years.
operational uses. 2015
HECC adopted a
new formula that
Advisory Group aligns state
A workgroup resources with
developed a new desired outcomes:
model focused on: especially
equitable student
- Student outcomes success. Four-year
2014
- Equity phase-in (2015-
With university 2019).
- In demand degrees
independence,
HECC sought - Mission differential
accountability
257
through a revised
funding formulaFunding Formula Guiding Principles
Support public service
Promote resident Provide funding
activity and regional
student success stability
missions
Incentivize progress to degree
Differential mission support Data averaging
Incentivize degree outcomes
Phased-in focus on
Regional university support
completion
Incentivize underrepresented
population completions
Incentivize in-demand Research support Stop Loss/Stop Gain
degrees
258Closely Aligned with Best Practice • Current formula is closely aligned with national best practice • Type IV indicates highest level of alignment • Among the states with higher portion of funding for completions • Among the states with a robust equity mechanism 259
Current Formula Design
      Mission Differentiation – 17%
      • Allocation off the top                                                    Mission
                                                                                 Differential
      • Based on historical levels + inflation                  Activity
                                                                 Based
                                                                                  Funding

      • Provides funding stability for regional institutions    Funding

        and acknowledges mission specific needs
                                                                           Completion
                                                                            Funding
      Activity-Based – 33%
      • Based on course completions
      • Cost-weighting of courses by discipline

      Outcomes-Based – 50%
      • Includes degree completions at all levels
      • Transfer bachelor degrees are discounted               Total Allocation
      • Additional weights for underserved students and
        completions in critical areas

260
Is the formula working?
DEGREES AWARDED TO
UNDERREPRESENTED COMPLETION RATES ARE STEM COMPLETIONS
STUDENTS ARE IMPROVING ARE GROWING
GROWING
• 10% annual growth in • 2.3% annual growth in • 50% growth in total
degrees awarded completions per 1,000 FTE resident, bachelor STEM
degrees awarded
6,000 400
3,000
300
4,000 2,000
200
2,000 1,000
100
0 0 0
2010 2014 2018 2010 2014 2018 2005 2010 2015 2018 2019
261 Source: Analysis of data provided by HECC Office of Research and Data.2019-2020 Funding Formula Review Process
21 Workgroup members • Objective formula designed to
maximize student success
including institutions,
• Formula designed to meet state’s
students, faculty and Assumptions higher education goals
consulting experts • Local governance with central
coordination
14 Meetings over 12 months
through October 2020; • Focus on student success with
pause for pandemic emphasis on equity
• Encourage attainment in high-
Guiding Review demand fields
Workgroup advised HECC • Recognize distinctions in mission
staff; public updates and Principles • Recognize cost differences
discussion at HECC • Clearly defined, current data
meetings • Clarity, simplicity and stability
262Process and Technical Recommendations
Hold periodic interim
Modernize the cost weights
advisory group meetings to
and apply graduate
discuss technical formula
education adjustment
issues; collect surveys
Change the definition of
Make the area of study
STEM, update bilingual
bonus additive rather than
education measure, and one
multiplied by the cost weight
degree per student
263Policy Recommendations
Apply weighting to all Simplify mission
transfer students and also differentiation with more
apply CC transfer bonus objective design
The discount recognizes that not all the No more line items – four
instruction occurs at the awarding components: base payment, regional
institution access, research and public service
Further collaboration across sectors is Significantly simplified with a limited
possible underscoring transfer amount of funding
pathways
264Impact on Total Funding Distribution
Current Revised Variance Total funding
distribution by
EOU 20,996,848 20,362,382 (634,466) (3.0%) institution before
29,421,165
and after the
OIT 28,976,212 (444,953) (1.5%)
recommended
OSU 134,780,800 128,985,661 (5,795,139) (4.3%) improvements using
PSU 99,712,572 102,573,689 2,861,117 2.9%
FY2020 data
SOU 22,696,196 23,943,100 1,246,904 5.5%
UO 75,630,667 76,930,398 1,299,731 1.7%
WOU 26,842,063 28,308,871 1,466,808 5.5%
TOTAL $ 410,080,311 $ 410,080,311 - -
265Formula Funding per Resident FTE
Current Revised Variance Total funding distributed
for all components of the
EOU 13,172 12,774 (398) (3.0%) formula divided by the
number of full-time
OIT 11,439 11,266 (173) (1.5%) equivalent (FTE) resident
students enrolled
OSU 8,346 7,987 (359) (4.3%)
PSU 6,518 6,705 187 2.9%
Mirrors the trend in
SOU 8,607 9,080 473 5.5% overall funding; Changes
are largely due to
UO 6,668 6,782 115 1.7% mission differentiation
7,358 redesign
WOU 7,760 402 5.5%
TOTAL $7,702 $7,702 - -
266What’s a degree worth?
A Focus on Equity
Degree Component Values
(Undergraduate, Non-Transfer)
25,000
$20,125 $30.6 million for equity
$18,709
20,000
3,667
15% of outcomes funding
4,189
$13,471 Avg incentive of $5,463
15,000 3,392
$12,836 1,675
3,667 4,189 3,897 4,608
10,000
1,005
5,000 9,169 9,169
8,377 8,377
$33.0 million for equity
0 16% of outcomes funding
history, current history, revised engineering, engineering,
current revised
Avg incentive of $5,934
degree cost weight area of study equity
267Affordability and Institutional Costs JIM PINKARD, Director of Postsecondary Finance and Capital 268
Snapshot of Affordability at
Oregon Public Universities
• In 2018-19, 60% of public university students were
  unable to meet expenses with expected resources,
  including family contributions, student earnings,
  and grant aid.
• In 2018-19, 61% of public university students did not
  receive any public grant aid
• On average, students earning a Bachelor’s degree
  leave with $22,273 in federal loan debt

        View the full Statewide Snapshots Report, Oregon
        Resident Students at Public Institutions, 2018-19
        https://www.oregon.gov/highered/research/Pages/snapshots.
269     aspx
Shifting Costs from State to Student – Education and General Revenue
FY 2003 FY 2020 Students, through
1% tuition and fees, are
paying for a much
9% larger proportion of
total education and
general expenses
46% 53%
25% over time.
66%
State Appropriations
Other Revenue
Tuition and Fees
270 Source: Office of Postsecondary Finance and CapitalTuition and Fees Vary Slightly Across Campuses (2020-21)
$16,000
$13,857
$14,000
$12,538 $12,165
$12,000 $10,917
$10,113 $10,146
$10,000 $9,405
$8,000
$6,000
$4,000
$2,000
$0
EOU OIT OSU PSU SOU UO WOU
Source: 2020-21 standard student budgets for undergraduate students enrolled full-time as compiled by OSAC from institutional data.
These amounts do not include insurance, loan fees, nonmandatory fees, or program-specific fees. Actual costs will vary depending upon
program of study, course load, and other factors.
271Public University Cost of Attendance (including Tuition and Fees) Rises
Each Year
State and federal grants trail behind college cost
Average Public University Cost of Attendance, Tuition and Fees, and Maximum Need-Based Grants
over Time Average yearly cost of
$30,000 attendance for public
$27,733
universities
$25,000
Public universities
$19,271 average tuition and
$20,000 fees (not including
OHSU)
$15,000 Maximum OOG at 4-
$11,306 year institution
$10,000
$7,217
$6,345 Maximum Pell Grant
$5,000
$5,550
$3,600
$1,950
$0
2010-11 2011-12 2012-13 2013-14 2014-15 2015-16 2016-17 2017-18 2018-19 2019-20 2020-21
272 Source: COA and OOG data: HECC Office of Student Access and Completion. Pell Data: US Department of Education :
https://studentaid.gov/understand-aid/types/grants/pell and https://ifap.ed.gov/dear-colleague-letters/GEN2101Earnings for University Graduates Over Time and
Key Performance Metrics #13 and 14
by Race/Ethnicity
Description: Median earnings of university graduates with bachelor’s degrees, five years
after completion, over time and disaggregated by race/ethnicity.
University Graduating Class of 2020
$53,640
$49,293 $48,910 $48,374
$46,969
$44,293
$48,413
$39,038
Asian Black or Hispanic or Native Native White
American African Latinx American or Hawaiian or
American Alaska Pacific
Native Islander
Graduating year
273 Source: HECC analysis of student-level records for public universities.University Cost Drivers (Mandates)
The universities identified Budget Cost Drivers – Educational &
nearly 400 mandates they are General
required to fulfill.
• Nearly 250 of these are federal, Projected Increase over
ranging from discrimination 2019-21
provisions to financial aid provisions
to copyright requirements. 88% of Compensation $133,507,997 7.3%
increased
• 91 state mandates apply to all costs are Health Benefits $35,370,928 9.4%
universities and 33 to specific salary and
universities with an additional 25 related Retirement Benefits $52,265,704 12.8%
imposed by OAR. benefits
Other Personnel Costs $18,781,947 7.5%
• These state level or OAR mandates
range from mandates on health Services & Supplies $33,743,400 4.2%
care to veterans to
underrepresented students to Total $273,669,975 7.4%
faculty and beyond.
274 Source: HECC analysis of ORS 352.069 Report. These costs are applicable to the Educational & General (E&G) fund only.Potential Funding Scenarios – PUSF
A Range of Options
Reductions Current (GRB) CSL Base Funding 40-40-20 Plan
+5.9% to +7.4% to +25% to
-8.5% to $765.8M $836.9 million
$886.1M $898.9M $1,046.3M
Annual tuition Use of fund Significant tuition Would allow most Amount needed to
increases of 10-25% balances ongoing increases on most universities to keep reach 40-40-20 state
for resident, campuses; reduced tuition at or below 5% higher education plan
undergraduate tuition Existing affordability by 2030
enrollment Preserves student
Potential reduction of declines for some Potential use of support investments Would include the
programs; layoffs, fund balances production of 2,800
furloughs and other Program Maintains progress additional bachelor’s
staffing actions reductions and Potential program toward statewide goals degrees annually
other actions cuts and longer
Magnitude and mix of already taken graduation times
actions dependent on
reduction amount
275What can we expect with base funding?
Completions per 1,000 FTE The total number of
400 annual completions has
grown 26% since 2010.
300
The number of
completions per 1,000
200 FTE has grown to 307 in
2019.
100 A similar rate of growth
infers an additional 2,400
annual completions by
0
2010 2014 2018 2022
2023.
Source: Analysis of data provided by HECC Office of Research and Data.
276
Note: Includes associate, bachelors, and graduate degrees as well as all certificates.How About Equity Gains?
Annual Degrees Awarded to The number of degrees
Underrepresented Students awarded has grown 10%
8,000 annually since 2009.
6,000
The percent of degrees
awarded is now at 22% of
4,000
total degrees up from 9%
in 2010.
2,000
A similar rate of growth
0
implies 28-30% by 2023.
2009 2013 2017 2021
Source: Analysis of data provided by HECC Office of Research and Data.
277 Note: Includes resident and nonresident degrees and certificates. Underrepresented includes low-income, underrepresented racial/ethnic group, military and rural students.Capital
Construction
Request
JIM PINKARD, Director of SOU
Postsecondary Finance and Capital
EOU UO
278Total Educational and General Overview of Capital Investment
(E&G) Space Value of State Issued Bonds, 2009-2021
Total Gross Square Feet: 16,954,757
WOU
5%
EOU
4% OIT
Invested by State in University
4%
$1.53B Capital Construction Projects
UO
(XI-G, LRB and XI-Q)
26%
OSU
39%
SOU Invested by the Universities in
7% $888M
• $10+ billion value capital (XI-F)
PSU
15%
• >40% 50+ years old
279 Source: Reported by the institutions as of September 2020. Investment numbers come from DAS Capital and HECC staff.HECC University Capital Principles
1 All state-backed debt will support the Strategic Capital Development
Plan through investments in education and student support spaces.
Institutions must plan for the ongoing operational and
2
maintenance needs of their facilities.
State-backed debt will extend the useful life of current assets,
3 expand the capacity to meet student needs, or further competitive
advantages.
280Strategic Capital Development Plan
Main Recommendations Rubric Changes
To provide a high-level
Invest in capital renewal Based on the plan,
summary of state capital
and improvement HECC revised the
needs for public universities
rubric to place more
based on demographic, focus on:
economic, industry, and other
Incentivize collaboration • Renewal and repair
environmental factors
of existing facilities
• Success of
Define institutional roles underserved
- Developed by outside experts students
and missions
- Completed October 2019 • Addressing
- Four main recommendations deferred
Improve capital planning maintenance
and seven key findings
practices • Collaboration
281University Capital Prioritization Process
• “The commission shall establish a HECC rubric development:
process for reviewing [public October 2019
university] requests to issue state
bonds” (ORS 352.089).
University capital submission: April 2020
• HECC staff recommendations are
based on institution-submitted HECC Staff Prioritization:
information. May 2020
• Projects are scored and ranked HECC adopts for inclusion in ARB:
using a Commission-adopted June 2020
rubric.
GRB finalized list: December 2020
2822021-23 University Capital Rubric
• 24 pts – Space renewal, workforce or completion priorities
Strategic Capital Development Plan • 12 pts – Addressing deferred maintenance issues
(1-52 points) • 8 pts – Support research & economic development
• 8 pts – Collaboration with interested parties
Operational Savings and Sustainability (1-8 • Does the project reduce operational costs, support continued efficiency or
points) increase the sustainability of the facility?
Life safety, Security or Loss of Use • Does the project meet life, safety and code compliance needs of mission critical
(1-10 points) items or improve the security of the facility?
Institutional Priority (1-5 points) • What’s the priority within the existing master plan?
Student Success for Underserved Populations (1- • How will the project impact the success of students from underserved
10 points) populations?
Leveraging Institutional Resources
• Is the project funded by a campus match or pledged resources?
(1-15 points)
283Public University Capital Request (GRB)
Prioritized Capital Construction Request, 2021-23 Biennium, GRB (in thousands $)
Total State Institutional Total Project
Universities Project XI-Q XI-G
Funds Funds Cost
All Capital Improvement and Renewal 80,000 80,000 80,000
PSU The Gateway Center Reuse and Extension 45,000 5,000 50,000 5,000 55,000
OSU Cordley Hall Renovation Phase II 61,000 25,000 86,000 57,000 143,000
EOU Inlow Hall Renovation Phase II 17,700 565 18,265 565 18,830
UO Heritage Renovation Project 52,650 5,850 58,500 5,850 64,350
OSU Phase 2 Remediation & Campus Infra. 15,830 835 16,665 835 17,500
Subtotals 272,180 37,250 309,430 69,250 378,680
XI-F(1) BONDS XI-G BONDS XI-Q BONDS
Backed by university revenues; University matches state Fully state paid
Can be utilized for non education bonding commitment. Restricted Restricted to state-owned
and general (E&G) projects to higher education institutions buildings only
University pays full debt service State pays debt service State pays debt service
284 Note: The intent of the GRB may have been to fund the OSU-Cascades Student Success Center project and not the OSU Phase II remediation project.Capital Repair and Renewal Funding
• Current capital improvements
Provides critical state • Code compliance
funding to address: • ADA and safety-related projects
• aka “Deferred maintenance”
May 2018
Workgroup February 2019
HECC established identifies key
workgroup to factors and HECC adopts rule
review Capital recommends new to use adjusted
Improvement and allocation E&G GSF and
Renewal (CIR) framework density factor
distribution
Recommendation: Increase funding from $65M to $80M consistent with SCDP as top priority.
285Noteworthy Example – Partnership and Innovation
PSU Gateway Center
Creates new space for the Graphic
Design program whose graduates are
in high demand
Partners with the City of Portland and
TriMet
Reduces operational expense by
$1.3M annually and replaces two
antiquated structures
286Noteworthy Example – Strategic Capital Development Plan
Alignment
OSU Cordley Hall Renovation,
Phase II
Renovates central biological science
teaching facilities
Significantly reduces deferred
maintenance
Supports research science and
prepares students for careers in
health, science and industry
287Noteworthy Example – Modernizes and Improves Academic Space
EOU Inlow Hall
Maximizes existing space for expanded
programs and access to academic
support services
Completes seismic improvements and
renovates building envelop, HVAC and
controls
Improves energy efficiency and
thermal conditions for users
288State Funded University Debt Service History
Total State Funded Debt Service GF + LF (in millions)
$450.0
$416.0
$400.0
$350.0
$300.0
$250.0 $238.4
$200.0 $182.9
$151.6
$150.0
$114.7
$101.2
$100.0 $82.1
$50.0
$52.7
$33.1
$0.0
2005-07 2007-09 2009-11 2011-13 2013-15 2015-17 2017-19 2019-21 LAB 2021-23 GRB
289 Source: OUS Budget Summaries 2005-2006, through 2014-15, HECC BRS 2016-17, and Governor's Recommended Budget (2017-19) and (2019-2021).Providing a Key Route to Upward Mobility
Oregon universities enroll over 102,000
students including over 68,000 Oregon
residents, award degrees and certificates to
over 25,000 students including 16,000
Oregon residents annually, and their
operational funds represent 38.9% of the
appropriations in the HECC budget. In a
tomorrow in which 97% of all Oregon jobs
with above-average earnings will require a
postsecondary credential or degree,
universities will continue to provide a key
route toward upward mobility for all
citizens.
290 Source: Enrollment and completion data: HECC data. Projections: Oregon Employment Department. (2020). Oregon Occupational Employment
Projections 2019-21 and Occupational Employment Projections 2019-29State Programs and Services JIM PINKARD, Director of Postsecondary Finance and Capital 291
Public Universities: State Programs

             Activity                     Description                        2019-21 LAB 2021-23 CSL    2021-23 GRB
      Public University State   Continues investments to the universities    $44.9M GF   $45.1M GF     $47.8M GF
      Programs                  for Dispute Resolution Center, Oregon
                                Solutions, Signature Research Centers, and
                                others programs.

                                Adds funding for the Veterinary Diagnostic
                                Lab, which used to be included in the
                                Public University Support Fund.

      Change from                                                                                      6.29% from LAB
      2019-21                                                                                          5.97% from CSL

292
Public Universities: Statewide Services
Activity Description 2019-21 LAB 2021-23 CSL 2021-23 GRB
Agricultural Experiment Provides funding for the Agricultural $76.2M GF $80.5M GF $80.3M GF
Station Experiment Station.
Change from 5.3% from LAB
2019-21 0.0% from CSL
Forest Research Preserves funding for the Forest Research $11.4M GF $12.1M GF $11.8M GF
Laboratory Laboratory.
Change from 3.5% from LAB
2019-21 -2.5% from CSL
OSU Extension Service Preserves General Funds OSU Extension $56.0M GF $59.3M GF $55.7M GF
Service, and continues Lottery Funds for $45.3M LF $48.8M LF $45.3M LF
the Outdoor Schools Program.
Change from -0.3% from LAB
2019-21 -6.6% from CSL
293You can also read