Status of the Bluefin tuna Management Strategy Evaluation
←
→
Page content transcription
If your browser does not render page correctly, please read the page content below

Status of the Bluefin tuna
Management Strategy Evaluation
        Principle, uncertainty grid & operating models, performance
               statistics, various candidate harvest strategies

                                     Eider Andonegi
                                AZTI – Marine Research

 Joint MEDAC and SWWAC meeting - Workshop on Eastern Bluefin tuna Harvest Strategy, 19th July, 2021.
Management Strategy Evaluation
       What is that?

           2
                          © AZTI 2020. Todos los derechos reservados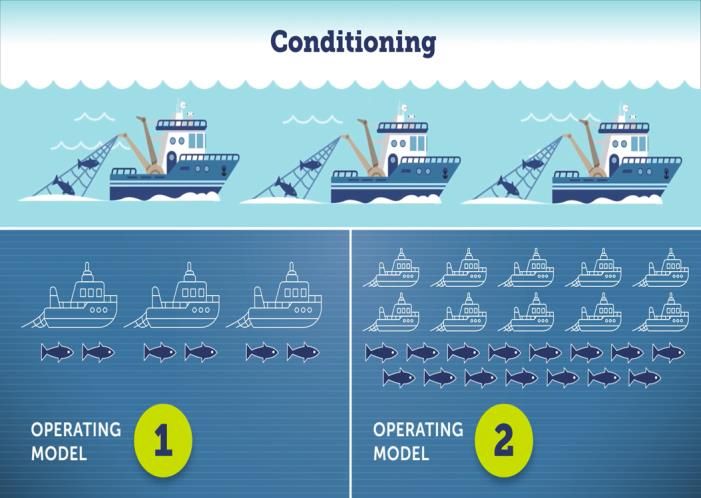
MSE

⮚ A simulation approach that
  formalizes the introduction of
  uncertainty into the decision-
  making process

⮚ The objective is to identify the
  management strategies that
  are robust to uncertainty
  before they are put in place
MSE - Steps
 •   Identification of management objectives
 •   Identification of statistical indicators of performance
 •   Hypotheses for operating models (OMs)
 •   Conditioning of the OMs using data and knowledge
 •   Weighting of hypotheses depending plausibility
 •   Identifying candidate management procedures (MPs) / harvest strategies (HS)
 •   Projecting the OMs forward in time using the MPs as a feedback controller: impact of
     management
 •   Identifying the elements of MPs that best meet management objectives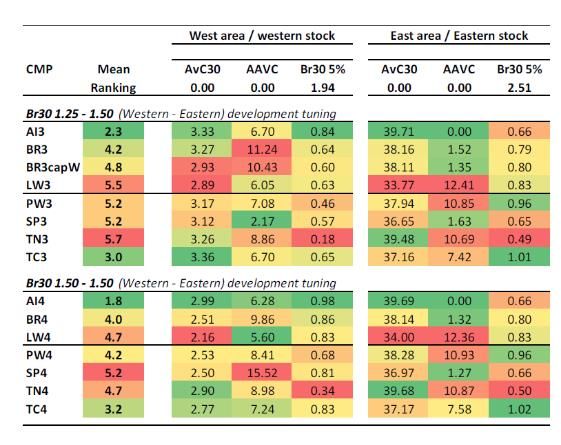
MSE for Atlantic BFT

      5
                       © AZTI 2020. Todos los derechos reservados
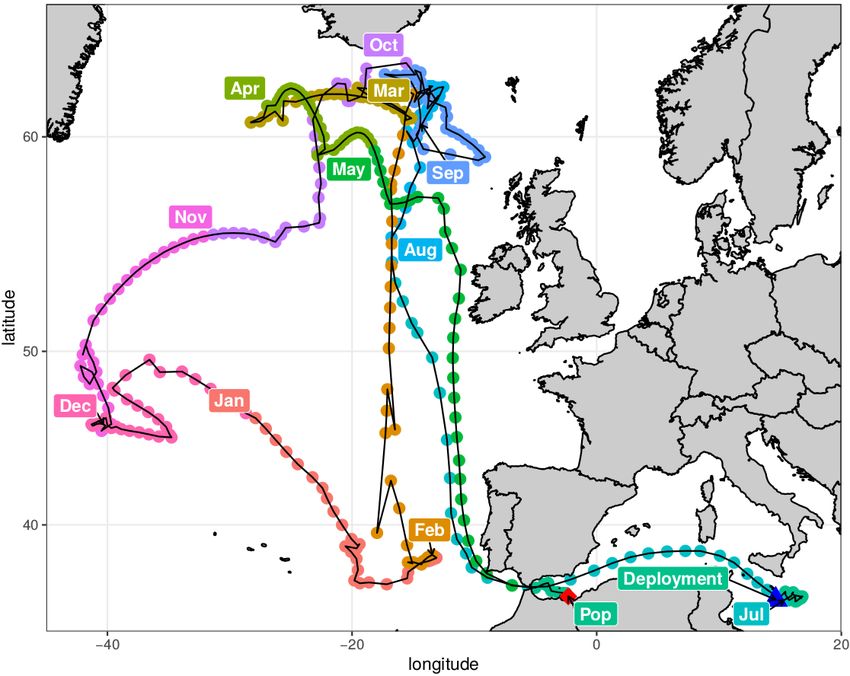
Some background on Bluefin
Atlantic Bluefin tuna (Thunnus thynnus; ABFT) is challenging
 ●    Emblematic large migratory species: complex spatial dynamics
 ●    Migration in and out of the Med, not fully understood

Exploitation
  ●   Very valuable fishery
  ●   Complex exploitation history
  ●   International fishery >20 countries
  ●   Specific exploitation process (Fattening farms)

Management
 ●  Managed in two independent stocks: East and West
 ●  Stocks are mixing, pop structure still under research
 ●  Western fishery catch eastern fish
 ●  90% of total catch are Eastern, Western smaller stock
 ●  60% of East TAC = Med Purse seiners
BFT MSE – How is it organized?

  •   Funded within the ICCAT research program (GBYP)
  •   One contractor in charge of the implementation
  •   Developed a complete R package
  •   Small technical group that reports to the BFT Group, which makes
      the key decisions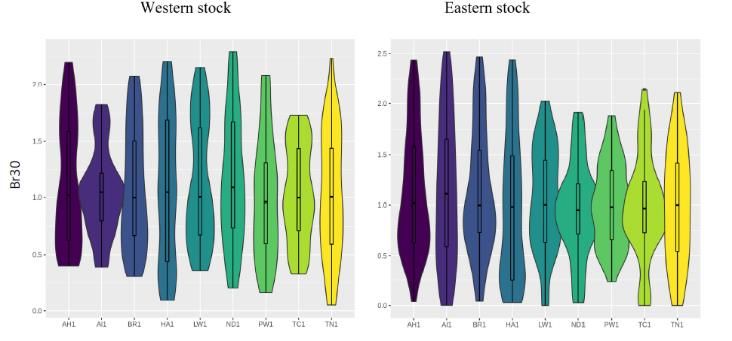
BFT MSE – The Operating Model(s) - OM
                  ●   Simulates the real stock and the fishery under
                      certain hypothesis about their dynamics and
                      interactions.
                  ●   Modifiable Multi-stock Model (‘M3’) - age
                      structured.
                  ●   Equations complicated by the quarterly
                      temporal structure.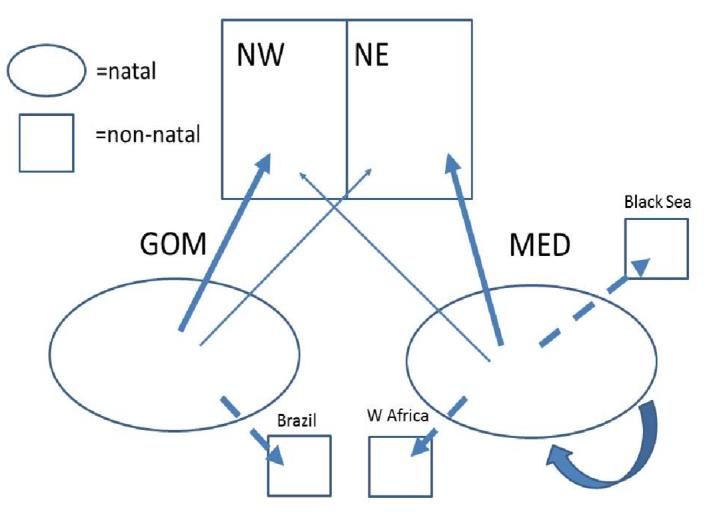
BFT MSE – OM: fitting to data

• Fishery-dependent information – CPUEs

BFT MSE – OM: fitting to data

• Fishery- independent information:
BFT MSE – OM: fitting to data

• E-TAGs for Spatial Transitions

 ●   NOAA, DFO, WWF, AZTI, UNIMAR, IEO, UCA, FEDERCOOPESCA, COMBIOMA, GBYP, IFREMER, Stanford University:
     1307 tags, 598 tag transitions
BFT MSE – OM: fitting to data
• Stock of Origin data from :
• OTOLITHS MICROCHEMISTRY
• GENETICS
• Others
• Length-comp
• Total catch
• Index of SSBBFT MSE – OM: Uncertainty axes
BFT MSE – OM: Uncertainty axes
Factor: Recruitment
          Western stock                              Eastern stock
level 1   B-H with h=0.6 (“high R0”) switches to h = 50-87 B-H h=0.98 switches to 88+ B-H h=0.98
          0.9 (“low R0”) starting from 1975
level 2   B-H with h=0.6 fixed, high R0                 B-H with h=0.7 fixed, high R0
level 3   Historically as in level 1. In projections,   Historically as in level 1. In projections, 88+ B-H
          “low R0” switches back to “high R0” after     with h=0.98 switches back to 50-87 B-H with
          10 years                                      h=0.98 after 10 years

Factor: Spawning fraction/Natural mortality rate for both stocks
level A Younger spawning (E+W same)/High natural mortality
level B Older spawning (different for the 2 stocks)/Low natural mortality (with senescence)                   Reference Grid:
Factor: Scale*                                                                                                    48 OMs
         West area                                      East area
level -- 15kt                                           200kt
level - 15kt                                            400kt
+
level    50kt                                           200kt
+-
level    50kt                                           400kt
++

Factor: Length composition weighting in likelihood
level L   0.05
level     1
H
BFT MSE – OM: Uncertainty axes
Length Comp Wt L
Scale -- -+ +- ++
Spawn. Frac. / M A B A B A B A B
Recruitment: 1 OM_1 OM_4 OM_7 OM_10 OM_13 OM_16 OM_19 OM_22
Recruitment: 2 OM_2 OM_5 OM_8 OM_11 OM_14 OM_17 OM_20 OM_23
Recruitment: 3 OM_3 OM_6 OM_9 OM_12 OM_15 OM_18 OM_21 OM_24
Length Comp Wt H
Scale -- -+ +- ++
Spawn. Frac. / M A B A B A B A B
Recruitment: 1 OM_25 OM_28 OM_31 OM_34 OM_37 OM_40 OM_43 OM_46
Recruitment: 2 OM_26 OM_29 OM_32 OM_35 OM_38 OM_41 OM_44 OM_47
Recruitment: 3 OM_27 OM_30 OM_33 OM_36 OM_39 OM_42 OM_45 OM_48BFT MSE – OM: Robustness test
Priority Robustness test description
1 Western stock growth curve for eastern stock.
2 Catchability Increases. CPUE-based indices are subject to a 2% annual increase in catchability in the future.
3 Unreported overages. Future catches in both the West and East areas are 20% larger than the TAC as a result of
IUU fishing (not known and hence not accounted for by the CMP).
4 High western mixing. The old mixing axis factor level 2: 20% western stock biomass in East area on average from
1965-2016.
5 ‘Brazilian catches’. Catches in the South Atlantic, including relatively high takes during the 1950s and 60s, are
reallocated from the western stock to the eastern stock.
6 Time varying mixing. Eastern stock mixing alternates between 2.5%and 7.5% every three years.
7 Non-linear indices. Hyperstability in OM fits to data is simulated in projection years for all indices.
8 Persistent change in mixing. Eastern mixing increases from 2.5% to 7.5% after 10 years.
9 Varying time of regime change in R3.
10 Intermediate parameter levels for M, growth, maturity, scale, regime shifts.
11 Zero eastern stock mixing. No Eastern stock in the West area.
12 Upweight US_RR_66_144BFT MSE – OM: Plausibility weighting
• Delphi approach
• through an online Poll (deadline February 14th)
• Poll characteristics:
• Blind
• Reflecting authorship
• Default score for levels within an axis, and justification required when
differing from it.
• Eligible participants: restricted to the attendees of 2020 December BFT meeting
• recruitment level R3 was considered less plausible than the other two R levels
• Process in standbyBFT MSE – The Management Procedure(s) – MP
/ Harvest Strategies (HS)
Simulates different proceses:
• Data collection: observation model
• Assessment: Estimation/assessment model – status
estimator
• Advice: Harvest Control Rules (HCR)
• Implementation.
41 cMPsBFT MSE – The Management Procedure(s) - MP
CMP Status estimator Summary of HCR References
AH Biomass estimate calculated via larval TAC is a product of biomass estimate and F0.1 estimate. SCRS/2020/144;
indices and the associated catchability SCRS/2021/122
estimates.
Spawning and vulnerable biomass for
Regional biomass fished at a fixed harvest rate. Uses CAPs,
AI each stock in each area are estimated by SCRS/2021/028
bottoms and variable TAC changes.
an artificial neural network.
Weighted average of index J is used
TACs set using a relative harvest rate (Catch/J) from a reference
directly for each area, where weights are
year (2018) applied to the 2-year lagged moving average of the
BR inverse variances (adjusted for SCRS/2021/121
weighted index J. Quadratic decline in reference HR multipliers
autocorrelation) for each individual data
when J is below a nominated level.
series
Similar to BR, using a weighted average SCRS/2021/032;
EA Adjust TAC by ratio between Icur a target value T.
of index Icur. SCRS/2021/P/046
HA TAC is based on trend in indicator and Current index value relative mean of recent 3 years represents SCRS/2021/122
biomass of a second indicator the harvest rate applied to the biomass estimated for a second
indicator.
No biomass/stock status estimation, Current relative HR is compared to the reference period
LW SCRS/2020/129
larval surveys used directly relative HR, and TAC is adjusted based on their ratio.BFT MSE – The Management Procedure(s) - MP
CMP Status estimator Summary of HCR References
ND No estimate used, just trends on indices. TAC is updated using recent trend in indicator with restrictions SCRS/2021/122
on increase limited to 20%.
Current relative HR is compared to the reference period
PW No biomass estimate is used SCRS/2020/129
relative HR, and TAC is adjusted based on their (delta) ratio.
SP
SSB and vulnerable B are estimated by
averaging the available indices for the TACy=TAC (y-1) but depending on F/Fmsy and B/Bmsy.Uses SCRS/2020/150,
TC
stock/area combination after scaling by CAPs, bottoms and variable TAC changes. SCRS/2020/165
2016 estimates catchability.
Uses ratio Iratio of recent and lagged
TAC calcualted based on the JPN_LL moving average, unless SCRS/2020/151;
TN moving averages of indices to determine
drastic drop of recruitment is detected by US_RR index. SCRS/2021/041
relative stock statusBFT MSE – Statistical indicators for performance 1 AvC10 Mean catches over first 10 projected years 2 AvC30 Mean catches over first 30 projected years 3 C10 Mean catches over the first 10 projected years 4 C20 Mean catches over projected years 11-20 5 C30 Mean catches over projected years 21-30 6 D10 Depletion (spawning biomass relative to dynamic B0) after the first 10 projected years 7 D20 Depletion (spawning biomass relative to dynamic B0) after projection year 20 8 D30 Depletion (spawning biomass relative to dynamic B0) after projection yeare 30 9 LD Depletion (spawning biomass relative to dynamic B0) all projected years 10 DNC Relative SSB (SSB relative to zero fishing) in final projection year 11 LDNC Relative SSB (SSB relative to zero fishing) over all projection years 12 POS Probability of Over-Fished status (B
‘EA’ cMPs – updated
           progress

Andonegi E., Arrizabalaga H., Rouyer T., Gordoa A. and Rodriguez-Marín, E.

                        22
                                                                © AZTI 2020. Todos los derechos reservados
cMPs for East and West BFT
EAST WEST
Indices (weights) • FR_AER_SUV2 (σ=0.76 -> w=1.740) • GOM_LAR_SUV (σ= 0.70 -> w= 2.033)
• MED_LAR_SUV (σ= 1.03 -> w=0.950) • JPN_LL_West2 (σ= 0.57 -> w= 3.045)
• MOR_POR_TRAP (σ= 0.54 -> w=3.590) • US_RR_66_144 (σ= 1.16 -> w= 0.744)
• JPN_LL_NEAtl2 (σ= 0.62 -> w=2.610) • MEXUS_GOM_PLL (σ= 0.52 -> w= 3.680)
Estimator (model) • (a) Weighted mean – EA2n+1(E) • (a) Weighted mean – EA2n+1(W)
• T (tuning) • T (tuning)
Itar
• Perfect • Perfect
Observation
• [-15%, +15%] • [-15%, +15%]
Delta on TAC
© AZTI 2020. Todos los derechos reservadosStatus estimator cMPs for East and West BFT
EA2n+1 cMP
© AZTI 2020. Todos los derechos reservadosHCR cMPs for East and West BFT © AZTI 2020. Todos los derechos reservados
Management objectives

             Br30 levels                CMP tuning options (values                       cMPs
                                       are given in the order of West-
                                                     East)
       Western           Eastern              Paired plus (n=4)
                                                                                            EA
     1.00                1.00          1.00 – 1.00                        EA1
                                       1.25 – 1.25                        EA2, EA2_6, EA2_10
     1.25                1.25          1.25- 1.50
                                                                          EA3, EA3_8, EA3_11
                                       1.50 – 1.50
     1.50                1.50                                             EA4

                                                        EA1         EA_1 is CMP that uses weighted mean, tuned to Br30_W=1 & BR30_E=1
                                                        EA2         EA_2 is CMP that uses weighted mean, tuned to Br30_W=1.25 & BR30_E=1.25
                                                        EA2_6       EA_6 is CMP that uses weighted mean, with CAP in 40000, tuned to Br30_W=1.25 & BR30_E=1.25
                                                        EA2_10      EA_10 is CMP that uses weighted mean, with CAP in 40000, with lower TAC variation above 20000, tuned to Br30_W=1.25 & BR30_E=1.25
                                                        EA3         EA_3 is CMP that uses weighted mean, tuned to Br30_W=1.25 & BR30_E=1.50
                                                        EA3_8       EA_8 is CMP that uses weighted mean, with CAP in 40000, tuned to Br30_W=1.25 & BR30_E=1.50
© AZTI 2020. Todos los derechos reservados              EA3_11      EA_11 is CMP that uses weighted mean, with CAP in 40000, with lower TAC variation above 20000,tuned to Br30_W=1.25 & BR30_E=1.50
                                                        EA4         EA_4 is CMP that uses weighted mean, tuned to Br30_W=1.50 & BR30_E=1.50
Results Performance statistics
EAST WEST
Br30 AvC30 AAVC Br30 AvC30 AAVC
EA1 1.01 45.3 7.54 EA1 1.02 3.33 6.11
EA2 1.26 41.37 6.54 EA2 1.25 2.26 5.37
EA2_6 1.25 40.02 0 EA2_6 1.26 2.16 5.68
EA2_10 1.26 38.83 1 EA2_10 1.25 2.2 5.67
EA3 1.49 37.02 5.61 EA3 1.25 2.37 5.78
EA3_8 1.49 39.62 0 EA3_8 1.25 2.32 5.54
EA3_11 1.55 38.66 1 EA3_11 1.25 2.32 5.63
EA4 1.5 37.33 5.75 EA4 1.5 1.86 4.95
© AZTI 2020. Todos los derechos reservadosResults Performance statistics BR30
EAST WEST
© AZTI 2020. Todos los derechos reservadosResults Performance statistics AvC30
EAST WEST
CAPS
CAPS
© AZTI 2020. Todos los derechos reservadosResults Projections…
EAST WEST
© AZTI 2020. Todos los derechos reservadosResults Projections by R-type… EAST
R1 R2 R3
Recruitment axis still most important influence on CMP biomass and yield performance.
© AZTI 2020. Todos los derechos reservadosResults Projections by R-type… WEST
R1 R2 R3
Recruitment axis still most important influence on CMP biomass and yield performance.
© AZTI 2020. Todos los derechos reservadosResults – Radar plots © AZTI 2020. Todos los derechos reservados
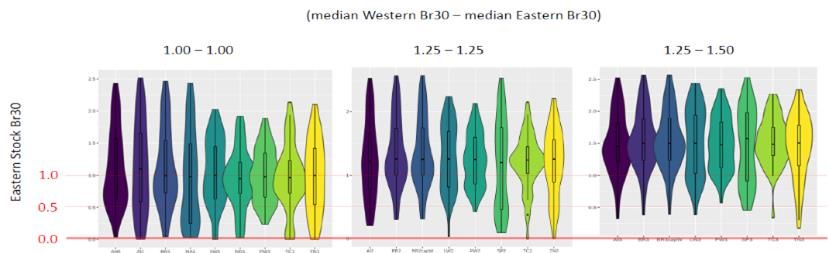
Other cMPs                                   Br30=1 for both stocks

                                                       Some problems for the
                                                       Eastern stock.

© AZTI 2020. Todos los derechos reservados
Other cMPs
Also problems with the 1.25 tuning objective
© AZTI 2020. Todos los derechos reservadosOther cMPs - ranking © AZTI 2020. Todos los derechos reservados
Glossary

                                             https://harveststrategies.org/what-are-harvest-
                                                           strategies/glossary/

© AZTI 2020. Todos los derechos reservados
Eskerrik asko
Gracias
Merçi
ThanksYou can also read