Stories Behind the Data: Initiatives of National Statistical Systems to Provide Actionable Insights Through Timely Data - PART IV - Initiatives of ...
←
→
Page content transcription
If your browser does not render page correctly, please read the page content below

PART IV
Stories Behind the Data:
Initiatives of National
Statistical Systems to
Provide Actionable
Insights Through
Timely Data


Overview
The provision of timely and reliable data is crucial
in making informed policy decisions. Development
planners turn to data as they design programs
and policies to help improve the lives of the poor
and promote inclusive and sustainable growth. By
showing which policies and programs work, as well
as highlighting those that do not, knowledge gained
from data also helps improve service delivery. Thus,
the importance of data in both formulating plans
and tracking progress towards the 2030 Agenda for
Sustainable Development cannot be overstated.

The 2019 High Level Political Forum on Sustainable
Development highlighted the challenges in generating the data
and statistics needed for tracking progress towards the Sustainable
Development Goals (SDGs) and associated targets (ECOSOC 2019). For
example, the United Nations Economic and Social Commission for Asia and
the Pacific (UNESCAP) has reported that, for 2020, only about 49% of the indicators
have sufficient data for tracking progress (UNESCAP 2021). This raises an important
question: How can the SDGs be achieved when high-quality data are lacking in guiding
policy decisions?

In addition to accuracy, reliability, and granularity, the Fundamental Principles of
Official Statistics cites timeliness as an important attribute of data (UNSD 2014).
Uneven progress in SDG and other development targets underscores the need for
timely data to make real-time decisions on critical policies and programs to achieve
global and regional development goals by 2030. Thus, there is an urgent need to
advance efforts to provide high-quality and timely data for policymaking.

The COVID-19 pandemic has brought into sharp focus the importance of high-quality
and timely data in daily life. Infection rates, the number of deaths, and vaccination
rates now influence the decisions of governments to constrain or allow freedom of
movement and economic activity. In a dynamic environment where scenarios change
rapidly, appropriate data are also crucial to promptly assess the impacts of restrictions
on peoples’ lives and livelihoods, and to develop suitable responses to the health crisis.

Ironically, however, lockdowns and other pandemic restrictions have seriously impeded
the traditional methods of data collection used by national statistical systems (NSSs),
hindering statistical capacity worldwide and curbing the ability to produce high-quality
data and statistics in a timely manner. This has spurred NSSs to embrace and accelerate
alternative data collection strategies such as the use of digital technology, which
provides new options for faster collection, processing, and dissemination of data.

294   Key Indicators for Asia and the Pacific 2021

      In line with this trend, the Economic Research and Regional Cooperation Department’s
      Statistics and Data Innovation Unit (EROD-SDI) of the Asian Development Bank (ADB)
      conducted a survey on initiatives that national statistics offices (NSOs) have undertaken
      over the years to provide more timely data. This request for information generated
      detailed responses from 28 of the bank’s regional member economies1. The survey
      shows that, even before the COVID-19 pandemic, NSOs had already begun using new
      tools, such as big data and innovative data capture, to access more timely information.
      The EROD-SDI was then able to assess whether existing NSO initiatives were
      accelerated because of the pandemic, and to identify further efforts to promote agile
      and resilient statistics systems amid a period of uncertainty.

      Why Do We Need Timely Data?
      Timely data are important both in designing policies aligned with specific objectives
      and goals, and in monitoring and evaluating those policies for appropriate calibration
      when needed. This was clearly illustrated when the COVID-19 pandemic struck, as
      governments needed timely data to react quickly to evolving scenarios and to strike a
      balance between reducing the spread of the virus and minimizing the impacts on the
      economy and human well-being.

      In developing economies, national data and statistics systems often work with limited
      capacity and resources, affecting their ability to provide timely data in rapidly evolving
      situations. To address these data gaps, NSSs used forecasts and simulations to assess
      the socioeconomic impacts of the COVID-19 pandemic, and these data proved essential
      in developing preliminary intervention programs and plans for recovery. However,
      later comparisons between the initial forecasts and latest statistics released by NSSs
      and other relevant government ministries revealed that, in some instances, there
      were significant differences between the two. It is therefore important to continuously
      fine-tune methods of data compilation, estimation, and forecasting in order to ensure
      that the timely release of accurate data and statistics is not compromised, ensuring
      actionable insights for policymaking.

      1   The EROD-SDI survey garnered responses from the following economies: Afghanistan; Armenia; Azerbaijan;
          Bhutan; Brunei Darussalam; the Cook Islands; the Federated States of Micronesia; Fiji; Georgia; Hong Kong, China;
          Indonesia; Kazakhstan; Malaysia; Mongolia; Nepal; Pakistan; the Philippines; the People’s Republic of China; the
          Marshall Islands; the Republic of Korea; Singapore; Solomon Islands; Sri Lanka; Taipei,China; Thailand; Uzbekistan;
          Vanuatu; and Viet Nam.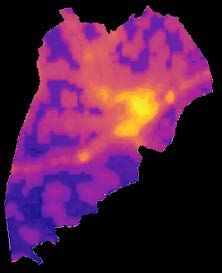
Stories Behind the Data           295

Background on Data Collection Capacity in Asia
and the Pacific

Box 4.1 summarizes the datasets commonly compiled by NSSs, while Figure 4.1 shows
how frequently these data are collected in the economies surveyed by the EROD-SDI.
In general, collecting comprehensive data requires significant resources. One estimate
suggests that the cost of conducting a household income and expenditure survey,
for instance, is approximately $1.7 million (UNSDSN 2015). For many developing
economies of Asia and the Pacific, these high costs create a barrier to conducting
comprehensive data collection as frequently as needed.

                                                         Figure 4.1: Frequency of Surveys and Censuses in Developing Economies
                                                 A significant proportion of developing economies in Asia and the Pacific conducted surveys
                                                                          and censuses too infrequently or not at all.

                                                                                                                                             Frequency of Population
                                      Frequency of Household Surveys                                                                         and Agriculture Censuses

                      12                                                                                               25

                      10
                                                                                                                       20

                       8
Number of economies

                                                                                                 Number of economies

                                                                                                                       15

                       6

                                                                                                                       10
                       4

                                                                                                                        5
                       2

                       0                                                                                                0
                                Labor Force Survey          Income and Expenditure Survey                                       Population Census                 Agriculture Census

                           Monthly                   Quarterly              Semestral                                       Every 10 years         Every 5/10 years     Every 5 years
                           Annual                    Quarterly/Annual       Every 2 to 5 years                                                 None         Irregular
                           Every 6 to 10 years       None                   Irregular

                  Note:          The analysis uses results from 28 regional member economies of the Asian Development Bank.
                  Source:        Asian Development Bank estimates using data from the Survey on National Statistics Offices’ Initiatives to Enhance Timeliness
                                 of Data and Statistics.
296 Key Indicators for Asia and the Pacific 2021
Box 4.1: Conventional Data Collection Initiatives by National Statistical Systems
Censuses, surveys, and administrative data are three sources of data conventionally used by national statistical systems (NSSs) to
provide socioeconomic data. Sample surveys, such as those conducted on households and enterprises, constitute a major data source for
Sustainable Development Goal (SDG) targets and other development indicators (DHS Program 2017). Examples of household surveys
include household income and expenditure surveys, demographic and health surveys, and labor force surveys.
Each data source has its advantages and limitations. Since a census gathers information from a complete set of all units of a target
population, it is accurately representative and can be used for more granular disaggregation. However, while a census serves as a
fundamental source of baseline information on the structure and key characteristics of the population over time, collecting data from a
larger population is resource-intensive and involves lengthy analysis and a longer time frame for publication. Meanwhile, a sample survey
collects information from a subset of a target population and often relies on census data in setting sample weight. Hence, compared to
a census, it generally takes less time and expense to conduct a sample survey and publish the data. Surveys also collect more detailed
information than do censuses.
Sample surveys are, by definition, subject to sampling errors. Response rates greatly affect the survey results and the quality of responses.
Interviewees may have difficulty recalling correct answers, or may not be totally honest, and this affects the quality of their responses.
Periodic reviews of a survey’s sampling design are also needed so that samples and weights correctly represent the population. As with
censuses, comparability over time is also a challenge, given how estimates of key variables may require similar designs and methods that are
highly unlikely to be perfectly replicated. Furthermore, adequately trained personnel are necessary to administer the survey with the least
deviation from the standard.
In addition to censuses and sample surveys, NSSs are using administrative data as a main or supplementary source of information for
several SDG indicators. Using administrative data has several advantages. First, administrative data usually contains a complete count
of units, which can derive disaggregated data from smaller areas of interests. Second, making use of existing data costs less than designing
a new data collection initiative to serve specific data needs. Third, readily available data through administrative registers have proved
their significance during crises. For example, the COVID-19 pandemic highlighted the importance of timely data in order to prepare
well-informed interventions to support the people affected by the crisis. However, the use of administrative data is sometimes limited
to a specific administrative purpose and might not be suitable for another statistical purpose due to its comparability and confidentiality.
NSSs therefore need to carefully select different data sources to complement censuses, using only applicable sample surveys and
administrative data.
Reference: Demographic and Health Survey (DHS) Program. 2017. Measuring the SDGs: The Role of Household Surveys. 11 January.
https://blog.dhsprogram.com/measuring-sdgs/.
Asia and the Pacific has made some progress on conducting regular and timely
data collection.
The Statistical Capacity Indicator (SCI) compiled by the World Bank provides
additional insights on the capacity of the region’s NSSs to provide timely data. In general,
the SCI measures the capacity to collect, analyze, and disseminate high-quality data.
Scores are based on three important dimensions: (i) statistical methodology, which
measures an NSS’s ability to adhere to international statistical standards and methods;
(ii) source data, which reflects capacity to collect data in line with internationally
recommended frequency and whether administrative data can be used for purposes
of statistical estimation; and (iii) periodicity and timeliness, which scores an NSS on
the basis of availability and periodicity of key socioeconomic indicators (World Bank
2021a). Recently, the World Bank developed an updated set of measurements, the
Statistical Performance Indicator (SPI), which considers five pillars: data use, data
services, data products, data sources, and data infrastructure. The SPI is set to be more
comprehensive and forward-looking than the SCI (World Bank 2021b). However, the
SCI, which has time series data, is still being used to show the trend of how statistical
capacity is evolving in the subregions of Asia and the Pacific over time (Figure 4.2).Stories Behind the Data 297
Figure 4.2: Statistical Capacity Indicator in Asia and the Pacific, by Subregion
Some aspects of Asia and the Pacific’s statistical capacity have improved over time.
Methodology Source Data
100 100
90 90
80 80
70 70
60 60
63.0 62.7
50 50
52.2 57.7
40 40
30 30
20 20
10 10
0 0
20 1
20 2
20 3
20 4
15
20 6
17
20 8
20 9
20
20 5
20 6
20 7
20 8
20 9
20 0
20 5
20 6
20 7
20 8
20 9
20 0
20 1
20 2
20 3
20 4
20 5
20 6
20 7
20 8
20 9
20
1
1
1
1
1
1
1
0
0
0
0
0
1
0
0
0
0
0
1
1
1
1
1
1
1
1
1
1
20
20
20
20
Periodicity and Timeliness
100
90
80
70 78.2
75.3
60
50
40
30
20
10
0
20 5
20 6
20 7
20 8
20 9
20 0
20 1
20 2
20 3
20 4
20 5
20 6
20 7
20 8
20 9
20
0
0
0
0
0
1
1
1
1
1
1
1
1
1
1
20
Asia and the Pacific Central and West Asia
East Asia South Asia
Southeast Asia Pacific
Note: The analysis uses data from ADB regional member economies for which estimates of the Statistical Capacity Indicator are available.
Source: Asian Development Bank estimates using data from World Bank. Statistical Capacity Indicator. https://datatopics.worldbank.org/
statisticalcapacity/SCIdashboard.aspx (accessed 22 December 2020).
Figure 4.2 summarizes how Asia and the Pacific’s statistical capacity has evolved since
2005. Data show that overall statistical capacity in the region has improved steadily
over time, although variations across individual economies exist.
Assessing the three SCI dimensions, Asia and the Pacific scored highest on periodicity
and timeliness, with signs of improvement over time. However, the most significant
improvement for the region as a whole was observed in statistical methodology.
Meanwhile, the region’s scores on source data went down marginally from 2005 to
2020. By subregion, East Asia posted strong improvement in methodology and the most
significant improvement in overall score, while the Pacific posted an improvement in
source data, albeit from a lower base than other subregions. Southeast Asia maintained
the highest score for periodicity and timeliness.298 Key Indicators for Asia and the Pacific 2021
Impacts of the COVID-19 pandemic on statistical
activities in three economies
Well before 2020, the statistics community of Asia and the Pacific had increasingly recognized
that a lot of the data needed for effective policymaking and evaluation were not readily
available. For a number of years, NSSs in the region have been working on initiatives to exploit
alternative data sources and digital methods of collection. The many and varied disruptions
caused by the COVID-19 pandemic have prompted NSOs to speed up some of their initiatives
in these areas, as has been observed in Malaysia, the Philippines, and Thailand.
Malaysia
Even before the pandemic, the Department of Statistics Malaysia (DOSM) was exploring
mixed-mode approaches to providing timely data. In implementing its surveys, the DOSM
has gradually been moving away from traditional data collection to computer-assisted
personal interviewing (CAPI), drop off and pick up of self-administered questionnaires,
and email communication. These strategies have reduced field work costs and enhanced
the department’s ability to analyze and disseminate data quickly.
When the pandemic began, the DOSM recognized its role in helping craft policies
responsive to an environment with many uncertainties. It produced quick surveys, such as
those gauging households’ ability to survive during lockdowns, without jobs and sources
of income. Similarly, it conducted surveys among businesses and enterprises to assess
their pandemic needs. The DOSM also came up with weekly and daily statistics to keep
policymakers informed on various indicators, e.g., the number of visitors at recreational or
theme parks, business outlets opened in certain areas, weekend occupancy rates in budget
hotels, and the number of people on particular streets.
To leverage existing administrative data, the DOSM integrated information from the
employees’ provident fund and the inland revenue board, which covers 70% to 80% of
Malaysia’s population. This provided policymakers with immediate snapshots of how
the pandemic was affecting the labor market. The DOSM has also started to explore
nontraditional data sources such as gathering data from media outlets and web-scraping
for its price surveys. More granular export and import data at the local level, specifically by
province, are now available due to big data initiatives.
Other initiatives by the DOSM include: (i) data usually released quarterly (e.g., agriculture
administrative data) are now available on a monthly basis; (ii) quarterly gross domestic
product (GDP) broken down into monthly estimates to better assess the impacts of
different pandemic response policies; (ii) additional indicators of underutilization in the
labor market, i.e., time-related underemployment and skill-related underemployment;
(iv) a quarterly labor market review; and (v) labor force statistics by state on a quarterly
basis and district-level statistics on annual basis.Stories Behind the Data 299 The DOSM faced enormous challenges in conducting the 2020 Population and Housing Census (MyCensus 2020), commenced on 7 July 2020. However, adopting technology in the pre-pandemic planning of the census—principally by developing the Malaysia Integrated Population Census System—created opportunities to use technology-based data collection. MyCensus 2020 is now in the final stage of online data collection and the DOSM is leveraging administrative data to complement and cross-check census data. The DOSM continues to play a prominent role in steering policy direction through its membership in the Higher Level Task Force of the National Employment Council, which was set up in October 2020 to address labor market issues across Malaysia. The DOSM provides the most recent data to inform the work of the council in shaping policy and monitoring government initiatives. Along this line, the DOSM is also involved in providing vital information to the members of the Economic Action Council, especially with respect to unemployment and underemployment. Malaysia is also in the process of forming a statistics council, headed by the Prime Minister, to assist evidence-based policymaking. The Philippines The Philippine Statistics Authority (PSA) has long been undertaking initiatives to capitalize on technology-based solutions for data collection and dissemination. Through its adoption of CAPI and computer-assisted telephone interviewing (CATI) processes, the time lag between conducting the labor force survey and releasing the statistics was shortened from 40 days to 35 days; the time lag on the survey of information communication and technology declined from 2 years to 1 year; and the difference between data collection and release of statistics from the annual survey of business and industry fell from 1 year (or longer) to 8 months. Since the onset of the pandemic, innovative initiatives have helped the PSA deliver its data publications without delay. For example, initiatives to train enumerators in using customized CAPI methods have ensured that data are released on time. Moreover, the authority experimented with web-scraping in the capital region for its price survey. As the pandemic prevented enumerators from reaching store outlets, due to lockdowns and fear of face-to-face interviews, this kind of initiative to access online prices is expected to aid in validating more than half of the commodity prices the PSA surveys monthly. There have, however, been some limitations in areas where there is still low internet activity or where computer literacy of households and respondents is less advanced. Moreover, the PSA’s agricultural survey was postponed due to difficulty in hiring statistical researchers and unavailability of transportation to some areas due to geographical lockdowns.
300   Key Indicators for Asia and the Pacific 2021

      To address repercussions of community quarantines on the labor market, the PSA started
      to produce more frequent labor force surveys—from quarterly to monthly.

      To improve targeting and prioritization of social assistance, the authority, together with
      local government units (LGUs), is also preparing for the roll-out of a community-based
      monitoring system by 2022. The PSA is leveraging its expertise in conducting censuses
      to help the LGUs shepherd this initiative. However, the authority recognizes that some
      LGUs might have difficulties in operating the system and is encouraging development
      partners to collaborate with these government units.

      Thailand

      The efforts of the National Statistical Office of Thailand (NSO) to improve timeliness
      of data began with a shift to CAPI from traditional pen-and-paper methods before
      pandemic. Around this time, the NSO also started shifting to CATI and computer-assisted
      web interviewing (CAWI). Additionally, the office cross-referenced its surveys or censuses
      and, where possible, merged questions to streamline data collection processes.

      Initially scheduled in April 2020, Thailand’s Census of Population and Housing was
      seen as an excellent opportunity to employ various digital initiatives and benefit from
      associated time and cost efficiencies. One of the proposals was to use tablets for faster
      data consistency checks, reduction of response processing times, and immediate
      uploading of survey information to the cloud. However, the census was subsequently
      postponed due to pandemic restrictions and business closures. In response, the NSO
      allocated B10 million to study the implementation of a register-based census to become
      more resilient to disruptions in field operations. Research on the feasibility of using big
      data for forecasting population numbers is also underway.

      The NSO has helped pioneer the use of satellite population maps to provide detailed
      population data, which is especially useful in times when face-to-face data gathering is
      not feasible. The technique, which has been researched in partnership with the Asian
      Development Bank, can deliver more reliable and geographically granular population
      density maps than conventional methods (Tatem et al. 2007).

      In particular, the study applied the method proposed by Stevens et al. (2015) to
      compile granular population data for 2020. It attempted to forecast gridded population
      distribution in the Thai provinces of Udon Thani, Uthai Thani, and Samut Songkhram
      (Figure 4.3).

      The methodology entailed combining census data with publicly available spatial data such
      as land cover classes, elevation, slope, and nighttime lights, then estimating a random
      forest model to obtain population density estimates at the 100 meter by 100 meter
      grid-level. Using the information on average annual population growth in Thailand from
Stories Behind the Data 301
Importance of timely data. Socioeconomic planners and policymakers
need timely and reliable data upon which to base their decisions.
Figure 4.3: Forecasts of Population Density in Three Thai Provinces, 2020
Population density estimates derived from satellite imagery of Udon Thani, Uthai Thani, and Samut Songkhram provinces.
Udon Thani Uthai Thani Samut Songkhram
Number of persons
per 100 m x 100 m
10
2
m = meter.
Source: T. Mitterling, K. Fenz, A. Martinez, J. Bulan, M. Addawe, R. Durante, and M. Martillan. Forthcoming. Compiling Granular Population
Data Using Geospatial Information.
2013 to 2017, another model was trained to predict population growth beyond 2017.
After applying these predicted growth rates to grid-level population data from 2017,
granular forecasts of population density for 2020 were obtained. Nevertheless, further
research is needed to assess the accuracy of such forecasts once official population
numbers are available.302 Key Indicators for Asia and the Pacific 2021
In response to the pandemic, the NSO also had to recalibrate arrangements for its other
data collection activities. For instance, instead of collecting price data directly from
stores, current prices were obtained through telephone interviews or from relevant
websites. Similarly, enterprise surveys used telephone interviewing, questionnaires by
post or e-mail, and data from business registers. Imputation techniques were applied to
supplement missing survey samples.
Together with exploring strategies on how to provide timely data and statistics amid
the COVID-19 pandemic, examining the impact of those strategies on data quality is
equally important. For example, given that census results are used as population frames
for other surveys, it is important to ensure that new ways of collecting census data
still deliver high-quality results. Additionally, given that administrative data systems
are playing a more important role in producing data and statistics for development,
the NSO recognizes the need to develop the skills of other government ministries that
manage such administrative databases, to ensure they follow the same scientific rigor
required when collecting, processing, and analyzing other types of data commonly
handled by the NSO. For instance, administrative data sets and registration records
produced by various ministries require skills in eliminating duplication and error. The
NSO acknowledges the need to develop the skills of ministries’ information technology
officers in dealing with administrative data.
How the Pandemic Influenced Data Capture
More Broadly
Only with accurate, trustworthy, and timely data can governments and institutions fight
the COVID-19 pandemic and mitigate the short- and long-term socioeconomic effects
of containment measures.
Figure 4.4 illustrates the relationship between statistical performance (using the SPI)
and the proportion of scheduled activities that were fully implemented or encountered
just minimal delays in 2020 (using data from the EROD-SDI survey).2 The results
suggest that, although there is a positive association between the two measures,
the value of the SPI is not a strong predictor of whether or not scheduled data
collection activities were completed. In fact, a majority of the surveyed economies
—including Indonesia, Fiji, Kazakhstan, Malaysia, the Philippines, Singapore, and
others—were able to push through with more than half of their scheduled data
collection activities.
2 Surveyed economies that did not have SPI values for the reference period were: Brunei Darussalam; the Cook
Islands; Hong Kong, China; Palau; and Taipei,China.Stories Behind the Data 303
Figure 4.4: Association between the Statistical Performance Indicator and Scheduled Data Collection Activities
Many national statistical offices pushed through with data collection activities scheduled for 2020.
1.0 1.0
activities completed or had minimal delay
Proportion of scheduled data collection
Proportion of scheduled data collection
0.8 0.8
activities completed
0.6 0.6
0.4 0.4
0.2 0.2
0.0 0.0
0 20 40 60 80 100 0 20 40 60 80 100
SPI value SPI value
SPI = Statistical Performance Indicator.
Sources: Asian Development Bank estimates using data from the Survey on National Statistics Offices’ Initiatives to Enhance Timeliness
of Data and Statistics; and World Bank. Statistical Performance Indicators. https://databank.worldbank.org/source/statistical-
performance-indicators-(spi) (accessed 27 July 2021).
Initiatives such as the shift to technology-assisted data collection enhanced the capacity
to generate timely data, in spite of lockdowns, work-from-home arrangements, and
concerns of field staff about face-to-face interviews.
NSOs undertook new initiatives to calibrate data collection, compilation, and
dissemination of activities to adapt to the pandemic situation. This was to ensure
continuity of critical data series such as economic output, employment, prices,
household income and/or consumption, and poverty. These strategies provided
important lessons in building more resilient statistical systems.
Population and housing censuses were severely impacted by the pandemic.
As a census entails a complete enumeration of the population in a specific economy or
area, it is considered one of the most complex and massive data collection activities,
requiring rigorous planning. In many economies, a census of population and housing is
conducted only once every 10 years due to the time and resources needed for planning
and implementation. Despite this long lead-in, many NSOs in developing economies of
Asia and the Pacific still encounter challenges when conducting a census. For instance,
high staff turnover often prompts NSOs to largely focus on training their staff on
collection and processing of data, and less time is provided on strengthening their
capacity to do in-depth analysis of census data. Such limited capacity contributes to
delays in releasing census results (UNFPA 2017).304 Key Indicators for Asia and the Pacific 2021
Nevertheless, improvements have been made in how economies conduct census
operations. As observed in the 2010 round of the World Population Housing Census
Programme—one of the longest-standing global statistical initiatives of the United
Nations—technology solutions were already being applied in census preparations and
data capture. Several economies were using geographic information system (GIS)
mapping technologies to digitize maps of census enumeration areas. Some NSOs had
started using scanners for data entry, while others adopted electronic questionnaires
through tablets.
As economies prepared for the 2020 round of the World Population and Housing
Census Programme, adoption of technological solutions increased severalfold, and this
paved the way for census data being released earlier than usual. For instance, based
on the EROD-SDI survey, the gap between field operations and dissemination of key
results shortened by up to a year for a number of economies, mostly because of the
advanced methods of data capture.
Globally, 120 countries and economies were scheduled to conduct their respective
population censuses in 2020, but these activities were either interrupted, delayed,
postponed, or cancelled (UNCTAD 2021). NSOs worldwide were forced to adjust and
look for workarounds to push through with their census activities. Some rescheduled
their census activities by a few weeks or months, while some changed their mode of
data collection. In Asia and the Pacific, the EROD-SDI survey showed that among 10
economies that had scheduled their censuses in 2020, six were forced to reschedule
field operations for either later in 2020 or into 2021.
Economies that were able to push through with the 2020 census had to adopt mixed data
collection approaches. Some transitioned to telephone interviews and web-based data
collection, while others utilized postal services to drop off and pick up questionnaires
when needed. Some Asian economies moved towards an approach where the initial
data source will come largely from existing administrative data and be further enhanced
by results from field enumeration, which has included a shift from full pen-and-paper
interviewing to CAPI and CAWI. This initiative is seen to be the first step towards a
register-based census. By previously investing in a resident registry with biometric
verification technology, some economies were able to leverage their administrative data
to produce a cheaper and timelier census without compromising data quality.
Despite the strides NSOs have taken to improve and hasten the conduct and release
of census results, many statistics offices still recognize that there are obstacles in
data collection. These include inconsistencies in administrative data, lack of internet
availability in some areas, insufficiency of server performance and memory of tablet
devices, and lack of preparedness of enumerators and respondents in transitioning to
technology-based interview methods. To address these issues, some economies have
continued to pursue capacity-building initiatives, especially in the use of new methods
to facilitate timely census data compilation.Stories Behind the Data 305
Use of nontraditional datasets to provide richer insights into economic activities
has accelerated.
Compiling a set of economic indicators is a crucial first step to understanding the
economy. This requires the collection of multiple types of data. For instance, agricultural
surveys and censuses provide information on areas cultivated with different types of
crops, animal production, expenditure, and number of agricultural workers; while
enterprise surveys and censuses produce specific information on nonagricultural
establishments, sales and revenue, expenditure, and size of nonagricultural employment.
Furthermore, administrative data sources, such as the financial statements of businesses,
also provide vital information when compiling economic indicators.
Economic indicators help policymakers and planners weigh the benefits and potential
downsides of alternative investments, make business decisions, design economic policies,
and monitor national progress. To ensure data harmonization, the System of National
Accounts (SNA), an internationally agreed set of recommendations on how to measure
economic activity, provides a conceptual framework that economies can follow in
compiling statistical sources. The latest version is the 2008 SNA (UNSD 2008).3
The results of the EROD-SDI survey reflect the challenges faced by NSOs in collating
timely economic statistics during the pandemic. A number of NSOs (e.g., the Republic
of Korea, Singapore, and Thailand) adapted imputation techniques, while others (e.g.,
Sri Lanka and Hong Kong, China) turned to alternative data sources such as firms’
annual reports to complement missing data.
In particular, NSOs have faced several challenges in compiling official GDP estimates,
which are usually released with a certain time lag, since statistics agencies need time
to compile national accounts estimates using available data from regular surveys,
administrative data, and other sources of information. The estimates have therefore
traditionally been released quarterly, semi annually, and/or annually.
Faced with challenges in data collection because of pandemic restrictions, as well as an
escalating requirement to produce and release reliable and timely GDP numbers more
frequently, NSOs have explored alternative collection methods and new data sources.
3 Given the important role of economic indicators in supporting policies promoting economic growth, international
development institutions usually support initiatives that strengthen the capacity of national statistics systems
in compiling such data. For instance, the National Accounts Section of the United Nations Statistics Division
contributes to the international coordinated development and updating of the SNA. The section also undertakes
methodological research to address some of the issues outlined in the SNA’s research agenda (UNSD 2008). Other
development and multilateral institutions such as the International Monetary Fund, PARIS21, the World Bank,
etc., also contribute to similar initiatives. In Asia and the Pacific, ADB’s EROD-SDI provides technical assistance
to a number of developing economies in compiling supply and use tables and input-output tables used as the basis
for compiling a wide range of economic accounts. This year’s special supplement of Key Indicators for the Asia and
the Pacific also presents ADB’s recent work on measuring the digital economy, which broadly aligns with the SNA
research agenda since, currently, digital transformation is largely invisible in the core economic accounts.306 Key Indicators for Asia and the Pacific 2021
One alternative method employed to produce early GDP estimates is the use of big data
for macroeconomic “nowcasting”.
Big data—including information on financial markets, electronic payments, mobile
phone usage, satellite images, online prices, online searches, and social media
postings—may be used to complement existing data from surveys and administrative
data sources (Buono et al. 2018). In nowcasting GDP growth, initial estimates are
calculated at the start of the reference period and then continually updated as
new information becomes available, using statistical models such as time‑series
autoregressive models or mixed data sampling regressions.
The Organisation for Economic Co-operation and Development has been publishing
a weekly tracker of GDP growth to provide real time high-frequency indicators of
economic activity. It applies a machine learning model to a panel of Google Trends data
for 46 economies, including India, Indonesia, and the People’s Republic of China, then
aggregates information about search behavior related to consumption, labor markets,
housing, trade, industrial activity, and economic uncertainty (OECD 2021).
In addition to the use of big data, there have also been efforts to enhance the use of
conventional data sources such as establishment surveys and/or censuses. For example,
the Reserve Bank of India used real-time tracking of high-frequency activity indicators
to provide timely information on the state of the economy and give directional
movements in quarterly GDP growth ahead of official releases, which generally happen
7–8 weeks after the end of the reference quarter (RBI 2020). This nowcasting of GDP
growth is based on an economic activity index estimated from 27 monthly indicators
using a dynamic factor model.
Studies have also explored the use of satellite images and spatial data to complement
conventional GDP estimation, specifically the presence of night-lights as a proxy
indicator of economic growth. Within the satellite imagery, increases in nighttime
luminosity over time depict the transition of countries or regions into more
economically developed areas (Hu and Yao 2019). For instance, in a study by the Reserve
Bank of India, a statistically significant relationship between night lights and value-
added in agriculture and private consumption expenditure was found, together with a
strong correlation between night-lights and the gross state domestic product (Prakash et
al. 2019).
Technology-based collection of labor and employment data has supplemented
traditional methods.
Among NSOs from Asia and the Pacific that responded to the EROD-SDI survey, some
indicated postponement or temporary suspensions in conducting their labor force
surveys (LFS). In most developing economies of the region, face-to-face interviews
remain the primary mode of labor survey data collection, either through pen-and-Stories Behind the Data 307
Figure 4.5: Association between the Statistical Performance Indicator and Use of Computer-Assisted Data Collection
6
5
Number of initiatives
4
3
2
1
0
0 20 40 60 80 100
SPI value
SPI = Statistical Performance Indicator.
Sources: Asian Development Bank estimates using data from the Survey on National Statistics Offices’ Initiatives to Enhance Timeliness
of Data and Statistics; and World Bank. Statistical Performance Indicators. https://databank.worldbank.org/source/statistical-
performance-indicators-(spi) (accessed 27 July 2021)..
paper interviewing or CAPI. These modes of data collection have been greatly affected
by restrictions imposed to curb the spread of COVID-19. In response, economies
that already had existing systems for telephone or web-based interviewing shifted to
alternative data collection methods such as CATI and CAWI, sometimes in combination
with face-to-face interviews.
Some economies applied different data collection methods where different pandemic
restrictions were in place. For example, in COVID-19 red zones, Indonesia used drop
off and pick up of self-enumerated questionnaires or CATI, while continuing face-to-face
interviews in COVID-19 green zones. In Sri Lanka, field data collection scheduled
for March and April was postponed until May, with data collection in lockdown areas
performed using CATI (a first for Sri Lanka’s LFS). Meanwhile, some economies
implemented certain adjustments for sampling errors (e.g., Armenia used re weighting
procedures).
In higher-income economies, where use of CATI and CAWI was already part of regular
operations, the pandemic had less impact on data collection processes. For example,
Singapore and Hong Kong, China simply used a higher proportion of online
participation and phone interviews and completed their LFS on schedule.
The challenges and limitations in conducting field survey operations during the
pandemic highlight the need for NSOs to improve their systems in terms of data308 Key Indicators for Asia and the Pacific 2021
collection and to explore other estimation methodologies that utilize big data to
complement data from standard LFS or administrative reports.4
Figure 4.5 shows the relationship between the World Bank’s SPI and number of data
collection activities (LFS and non-LFS) that employed computer-assisted interview
methods in economies surveyed by EROD-SDI.
Data integration methods are enhancing compilation of household income, poverty,
and other socioeconomic development statistics.
Data on household income, consumption expenditure, and poverty comprise an integral
part of designing, monitoring, targeting, and evaluating poverty alleviation programs.
However, considering the costs and length of time it takes to collect and process
household income and expenditure surveys or living standards surveys using
conventional techniques, NSOs have continuously explored using data integration
methods to provide data in more timely and cost-effective ways. For instance, efforts
to complement household survey data with big data for poverty estimation have been
increasing, with such initiatives being especially useful and relevant during times of
pandemic and other crises.
Based on a 2017 survey conducted by ADB and UNESCAP, the use of big data (such as
geospatial and social media data) helps improve the granularity, accuracy, and timeliness
of statistics on poverty and welfare (Albert et al. 2019).
The use of data from satellite images and the application of machine-learning
technologies have also been studied as applications for estimating poverty. For example,
an ADB study in 2016 assessed the use of satellite imagery to analyze the correlation
between nighttime lights and socioeconomic indicators, including headcount poverty
rates. Empirical data on the official headcount poverty rates, along with other
socioeconomic indicators from the Philippines, and data from satellite images were used
in the analysis. Results showed that, over time, average luminosity had increased and
the areas covered by lights had expanded, which may indicate economic growth and
improvements in living standards (Martinez 2016).
4 In addition to technology solutions in collecting data on work and employment, studies have explored nowcasting
methods that use big data, such as social media postings as reference indicators of unemployment. These alternative
methodologies could provide timelier data on labor market indicators, owing to the real-time availability and
frequency of the information. For example, in estimating the number of hours worked, the International Labour
Organization (ILO 2020) applied principal component analysis using the latest available data from labor force surveys;
administrative labor market data (e.g., registered unemployment); up-to-date mobile phone data from Google
Community Mobility Reports; the most recent Google Trends data; and COVID‑19 Government Response Stringency
Index, including data on COVID-19 incidence. Use of social media data, such as Twitter posts and Google searches,
as well as smartphone global positioning system (GPS) data, were also explored to track and predict unemployment
rates (ILO 2020). The use of massive location data from smartphones (GPS log data) was found to be useful in
nowcasting unemployment rates and predicting the status of labor markets in Japan (Moriwaki 2019).Stories Behind the Data 309 The initiative was further expanded by including information from daytime satellite imagery. Machine-learning algorithms were combined with data from satellite imagery to try to predict official poverty estimates. The approach was tested using official poverty statistics and satellite data for the Philippines and Thailand (ADB 2020; ADB 2021). While the focus of such study is to produce poverty statistics that are more granular than what can be derived from using household surveys alone, in principle, similar techniques can be explored to enhance poverty data, since satellite images are available more frequently than household surveys can feasibly be conducted. In other economies, there are attempts to integrate different types of data (including telecommunications data) to provide more dynamic poverty maps (Jean et al. 2016; Engstrom et al. 2017; Newhouse 2016). In addition to big data-related research on enhancing the quality of poverty statistics, including timeliness, the EROD-SDI survey also highlighted initiatives undertaken by some economies to enhance survey-based estimation of poverty. Many economies in the EROD-SDI survey have been utilizing technology in enhancing their data collection methodologies. Economies that were initially using paper-based survey forms and face-to-face interviews have moved to using telephone and web interviews (CATI and CAWI), while others have taken the additional step of ensuring that surveys are self- administered and can be accessed online. For example, Taipei,China has started linking its household survey to other available databases to facilitate timely release of data. When the COVID-19 pandemic struck, some economies transitioned to digital technologies for data collection, given mobility restrictions and reluctance to conduct face-to-face interviews. For example, in Armenia; Bhutan; Georgia; Hong Kong, China; and Mongolia, lockdowns halted several field operations, hence, NSOs moved towards conducting phone interviews. Challenges were not just in data collection; NSO employees also had to adapt to changes brought by the pandemic. In Indonesia, for example, NSO enumerators had to go through various instructor and enumerator trainings. Moreover, work-from-home arrangements were a challenge for NSO employees in Indonesia and Sri Lanka as they had to do data cleaning and verifying of survey results from their homes. Development institutions have played a key role in helping statistics offices bridge gaps in consumer price data. The COVID-19 pandemic caused changes in individual and household consumption and spending patterns, and these changes could affect specific items in the fixed consumer price index (CPI) basket. For example, due to lockdowns and travel restrictions, spending on transportation and accommodation was significantly reduced. Meanwhile, as people shifted to work-from-home arrangements, spending on food for home consumption increased and spending at restaurants fell. Hence, the question arises of whether CPI weights should be adjusted to capture these changes in household or personal expenditure patterns.
310   Key Indicators for Asia and the Pacific 2021

      To address the potential measurement bias of consumer price inflation brought by
      possible changes in CPI weights, some studies—including one by the International
      Monetary Fund (IMF)—recommended that, in estimating inflation during the
      COVID-19 pandemic, adjustments to CPI weights can be applied only if there are
      data to support them, since there is still incomplete information related to pandemic
      expenditure patterns (Reinsdorf et al. 2020).

      In economies such as Australia and New Zealand, CPI weights were adjusted only for
      specific expenditure items, following advice from international bodies that CPI weights
      should not be adjusted for short-term fluctuations and that adjustments should only be
      made if there are enough data to support the adjustment. In the case of New Zealand,
      CPI weights were adjusted for international airfares and overseas accommodation,
      which generally had high weights in the country’s CPI. However, due to border
      closures, there was significant reduction in spending on these items (Stats NZ 2020).
      Similarly, in Australia, adjustments were made only for specific categories, including
      international holiday travel and accommodation, child care, restaurant meals, and
      grocery items, to capture the price changes during the pandemic (ABS 2020).

      Restrictions in face-to-face data collection also meant challenges in terms of collecting
      price data to estimate CPI in economies of Asia and the Pacific.

      One alternative method in gathering price data for CPI estimation, already
      implemented in higher-income economies, is the use of live scanners, specifically
      for fast-moving consumer goods such as grocery products. Scanners can be used to
      estimate price indices in real time, providing up-to-date information on inflation risks,
      especially during economic crises. Furthermore, because data can be collected in
      real time, this facilitates timely tracking of variations in spending patterns to help in
      monitoring inflation risks (Jaravel and O’Connell 2020).

      In 2020, Japan started to use web-scraping and expanded the use of scanner data to
      estimate its CPI. However, one drawback has been that the range of goods or services
      for which scanner data are available is limited and the adjustment of product quality is
      necessary (Watanabe and Watanabe 2014).

      In addition, another IMF study recommended imputing for missing price data as a
      result of temporary business closures caused by the pandemic, by using the short-term
      relative change in available collected prices of similar varieties within the elementary
      aggregate. If an entire index is missing, either the next level up in aggregation or the
      “All Items” index is used to impute for the missing index. The All Items index is then
      compiled using the imputed and collected subcomponent indices (IMF 2020).

      The EROD-SDI survey shows that many economies in Asia and the Pacific (e.g.,
      Armenia; Bhutan; Georgia; Hong Kong, China; Indonesia; the Philippines; and Singapore)
      applied the imputation technique for locked-down outlets or carried forward when
Stories Behind the Data 311
prices were not available. These adjustments made use of alternative data sources and
exploited available data (Ducharme et al. 2020). In Bhutan, for example, the inability to
physically go to stores and collect prices was augmented by using online prices. The IMF
recommendations were also applied to ensure the continuity of price data (e.g., in
Uzbekistan), where some price data were not collected. Economies often verified the
imputed price with suppliers of goods and services and with other experts.5
Addressing the Sustainable Development
Agenda Beyond the COVID-19 Pandemic
In 2019, the United Nations launched Data For Now (Data4Now), a global initiative to
increase the use of robust methods and tools that can improve the timeliness, coverage,
and quality of data for development. The initiative works through collaboration and
partnership, technical and capacity support, and information sharing. Developing Asian
economies participating in this project include Bangladesh, Mongolia, and Nepal.
In Bangladesh, two important development indicators have been prioritized: the first
is the ability to estimate annual poverty indicators at the local level; the second is to
generate data to support climate action initiatives. In pursuing the advancement of
these indicators, innovative solutions to maximize use of traditional and nontraditional
data have been utilized (UNSD 2020). Mongolia, on the other hand, identified the
need for more timely data in terms of land use and crop yields. Meanwhile, Nepal
concentrated on its need to produce more robust data on domestic tourism and urban–
rural migration (GPSDD 2019). Data4Now is planning to expand its collaboration with
at least 10 additional economies by 2023.
ADB is also contributing to strengthening the capacity of NSOs to provide up-to-date
and timely data that can be used to monitor the development targets. These initiatives
relate to the use of CAPI and other technologies for data collection, enhanced data
compilation under the International Comparison Program (ICP), and adopting
international standards of sharing data to ensure better flow of information (Box 4.2).
5 Other steps were undertaken during the pandemic to address the disruptions in price data collection activities,
although a number of such initiatives may be considered extensions of earlier initiatives. Prior to the pandemic,
a number of economies (e.g., Armenia; Hong Kong, China; and the Philippines) advanced the shift from pen-and-
paper interviewing to CAPI. The shift from face-to-face interviewing to telephone or internet-based surveys was
also implemented (e.g., in Malaysia and Viet Nam). In particular, the pandemic accelerated economies’ adoption of
survey methods that do not require personal interviews (e.g., in Indonesia and Malaysia). To ensure that respondents
participated in the various censuses and surveys conducted, some NSOs resorted to sending reminders via SMS
or letters. Some economies also used live scanner data in addition to survey data. For example, Azerbaijan and
Taipei,China used scanner data from the database of trade network and web-scraping data, respectively. Despite
hurdles faced by NSOs during the pandemic, some economies continued to pursue capacity-building initiatives,
especially in the use of new data collection methods. This will prove advantageous to NSOs in developing Asia.312 Key Indicators for Asia and the Pacific 2021
Box 4.2: How ADB’s Statistical Initiatives Support Compilation of Timely Data
Computer-Assisted Personal Interviewing and Other Technology Solutions
Information technology has transformed field data collection methods by using computer-assisted techniques in personal, telephone, and
web interviewing (known as CAPI, CATI, and CAWI, respectively). These techniques are invaluable during health crises as they allow for
contactless data collection. Furthermore, with built-in data checks, navigation tools, easy data transfer options, and the ability to capture
information (such as global positioning system coordinates and photos), CAPI, CATI, and CAWI not only reduce the overall time to
produce a clean dataset, but are also expected to improve data quality.
A study by the Asian Development Bank (ADB) in Sri Lanka and Viet Nam to quantify the benefits of these techniques, particularly CAPI,
showed that there was a reduction in the number of errors by 6.2 per interview in Sri Lanka, and 0.8 per interview in Viet Nam (ADB
2019). Both economies have also adopted CAPI in their recent surveys and censuses. ADB is looking at replicating and extending the
work on CAPI, CATI, and CAWI in the Pacific’s household income and expenditure surveys conducted across Nauru, Samoa, and Tuvalu.
Meanwhile, ADB has conducted three iterations of massive open online courses on CAPI. The latest iteration in 2021 saw a total of 1,692
registrants from 112 different economies. From these, a completion of 30%, or over 500 individuals, was achieved. A fourth iteration is
planned for 2022, and will feature more information on CATI and CAWI.
International Comparison Program
ADB is the regional agency coordinating implementation of the International Comparison Program (ICP) in 22 economies of Asia and
the Pacific. The region covers over half of the world’s population and about one-third of global gross domestic product in purchasing
power parity terms.a The ICP requires collection of prices of more than 1,300 well-defined goods and services, representing household
consumption, government consumption, construction, and machinery and equipment, across all participating economies. Purchasing power
parities (PPPs) from the ICP are meaningful and useful only if they are estimated using reliable and accurate price data to ensure “like with
like” comparisons. This requires rigorous statistical validation and verifications of prices within and across all economies.
Recognizing the data quality and timeliness requirements of ICP operations in economies with varying statistical capacities, ADB has been
providing technological support to national implementing agencies through a data management tool: the ICP Asia Pacific Software Suite
(ICP-APSS). The ICP-APSS facilitates multiple data management functions such as timely data quality checks, verifications at various
levels, minimization of nonsampling errors, and efficient data preparation allowing more time for validation and analysis.
For the ongoing 2021 ICP cycle, the ICP-APSS has been developed into a web-based application, incorporating several new features and
modules for all ICP surveys. As the national implementing agencies continue to implement price surveys for the 2021 cycle, amid the
constraints of the COVID-19 pandemic, the ICP-APSS provides operational resilience and acts as a valuable tool for data management and
submission of high-quality and timely price data to ADB.
Statistical Data and Metadata Exchange
ADB is assisting in the implementation of the Statistical Data and Metadata Exchange (SDMX), an international initiative aimed at
standardizing the mechanisms and processes for the exchange of statistical data and metadata.
The SDMX will promote efficient sharing of data, both within and across national statistics systems, and with external partners and/or
organizations. Establishing and adhering to a set of internationally recognized standards for access to data and metadata will ensure that
such exchanges are timely, easily understandable, reliable, and user-friendly.
ADB is coordinating with SDMX sponsor organizations and development partners in the region to support the bank’s developing member
economies in implementing the SDMX.
Reference: Asian Development Bank. 2019. The CAPI Effect: Boosting Survey Data Through Mobile Technology: A Special Supplement of the
Key Indicators for Asia and the Pacific 2019. Manila: ADB. DOI: https://dx.doi.org/10.22617/FLS190429-3.
a The ICP is the largest global collaborative statistical undertaking, with 176 economies participating in its 2017 cycle. The ICP follows
an integrated work program at the national, regional, and global levels to facilitate the compilation of PPPs and PPP-based expenditure
estimates for gross domestic product and its expenditure.You can also read