Summary of the Draft Needs Assessment of the 2022 Housing Element - April, 2021
←
→
Page content transcription
If your browser does not render page correctly, please read the page content below
Summary of the
Draft Needs Assessment
of the 2022 Housing Element
April, 2021
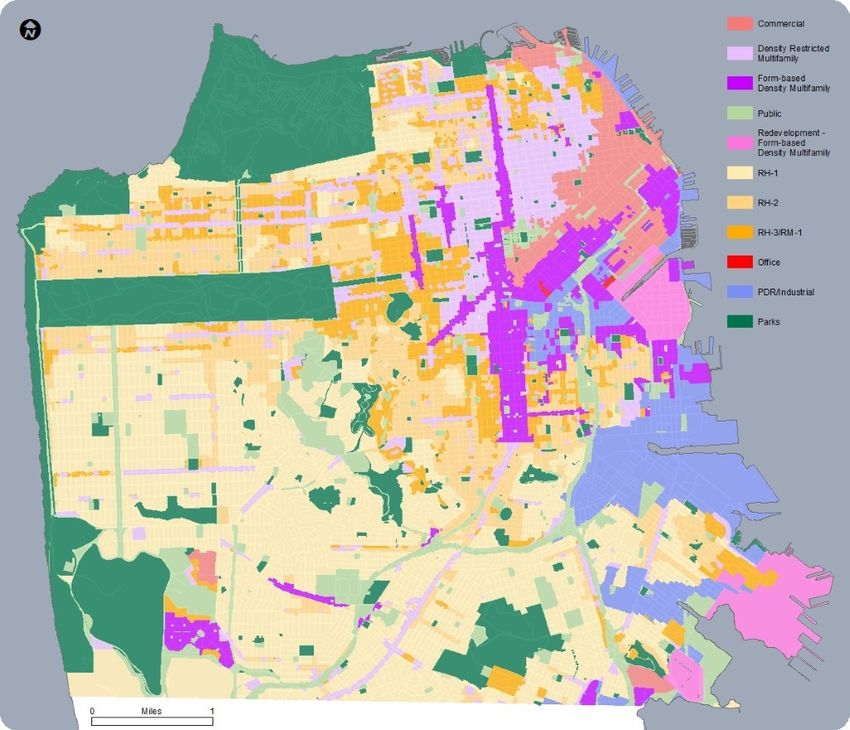
Table of Contents

Introduction ................................................................................................................................................................... 3

Population Change and Race and Ethnicity ..................................................................................................................... 3

Income and Inequality .................................................................................................................................................... 5

Age, Disability, and Household Type ............................................................................................................................... 7

Tenure and Homelessness .............................................................................................................................................. 9

Jobs and Wages ............................................................................................................................................................ 11

Housing by Age, Type, and Occupancy .......................................................................................................................... 13

Rent Control, SROs, and Affordable Housing ................................................................................................................. 16

Housing Production and Costs ...................................................................................................................................... 20

Housing Cost Burdens and Crowding ............................................................................................................................ 24

Displacement and Access to Opportunity ..................................................................................................................... 26

RHNA for San Francisco ................................................................................................................................................ 30

                                                                                                                                                                               2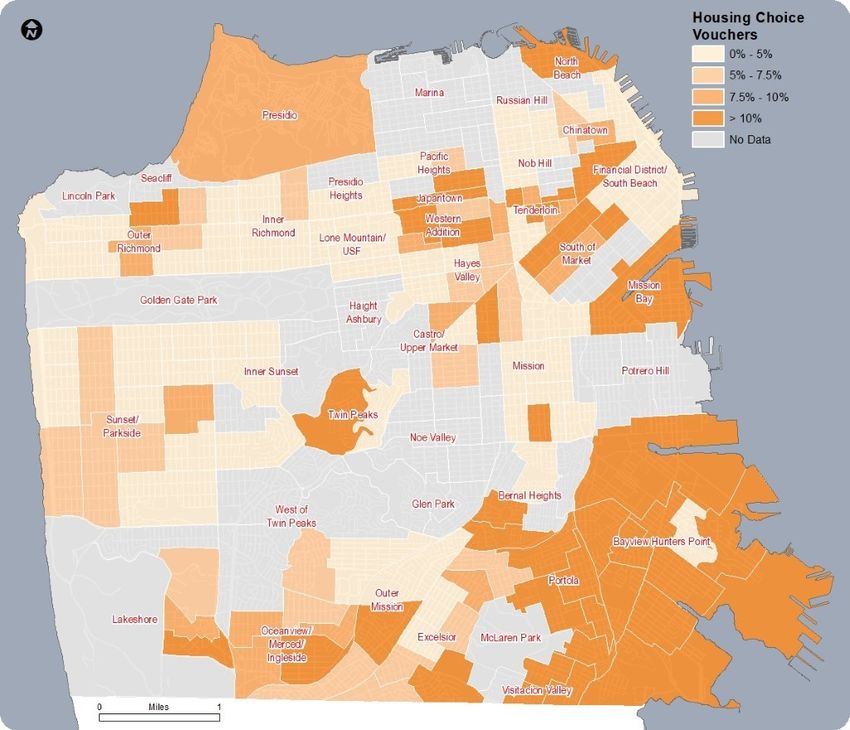
Introduction
This summary highlights key information from the Draft Needs Assessment prepared for the 2022 Housing
Element covering residents and workers, housing and housing costs, vulnerability and equity, and the Regional
Housing Needs Allocation (RHNA). The summary covers both recent and long term trends in demographics,
employment, and housing from a variety of data sources. This summary and the Needs Assessment itself are
meant to provide data and analysis to inform policies and objectives for housing in San Francisco.

Population Change and Race and Ethnicity
After Decades of Slower Growth, Rapid Population Growth Since 2010 Halted by Covid-19

In the period since 1990, San Francisco has grown more slowly than other counties in the Bay Area. But
between 2010 and 2018, the city grew much faster - 10% growth over the period, nearly 80,000 more
residents. In 2020 San Francisco’s population growth seems to have stopped or reversed, at least temporarily,
due to the Covid-19 pandemic, economic slowdown, and turn to remote work for some. San Francisco’s closest
neighboring counties, San Mateo and Marin, were the slowest growing counties in the region from 1990 to
2018. The slower growth in these counties reflects less housing added over the nearly 30-year period.

Figure 1: Total Population by Decade for Bay Area Counties, 1990-2018

Source: Census Bureau

                                                                                                            3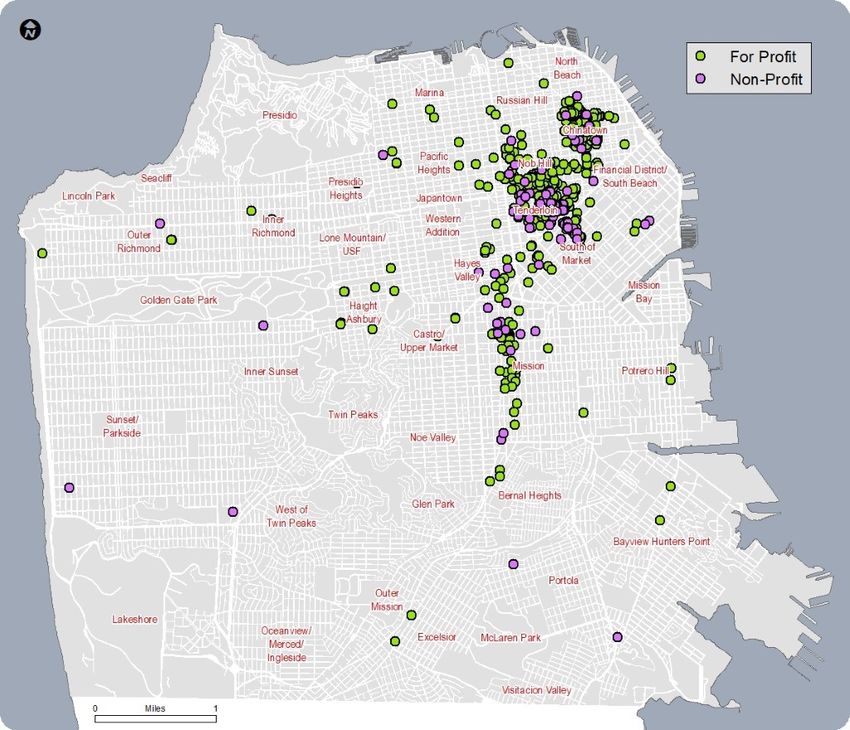
Drop in Black and American Indian Population, Lower Incomes Among People of Color

San Francisco’s Black population dropped by 45% from 1990 to 2018, more than 34,500 people. This large drop
reduced the Black share of the population from over 10% to around 5%, a much bigger drop than in the region
as a whole. In fact, half of the total drop in the region’s Black population was in San Francisco. The American
Indian population has also dropped by 52%, or over 1,300 people since 1990. Over the same time period the
city’s white population remained largely stable, growing at about 4% or 14,000 people to over 350,000. The
white share of the population, however, declined from 46% to 41%. Since 1990 the Asian population has grown
over 44%, or 90,000 people, to nearly 300,000 or 34% of the population. The Latino population has also grown
over the period by 35% or 34,000 to 130,000 people. People identifying as two or more or “other” race have
also increased over the 30 year period. The Census allowed people to report two or more races beginning in
the year 2000, which may account for some changes in certain racial groups, however, disproportionate
changes in San Francisco point to additional factors affecting demographics.

Figure 2: Percentage Change in Population by Race & Ethnicity 1990 to 2018

Source: SF Planning Analysis of 2014-2018 IPUMS

Figure 3: Current Racial & Ethnic Composition of SF

                                                  Source: Census Bureau

                                                                                                             4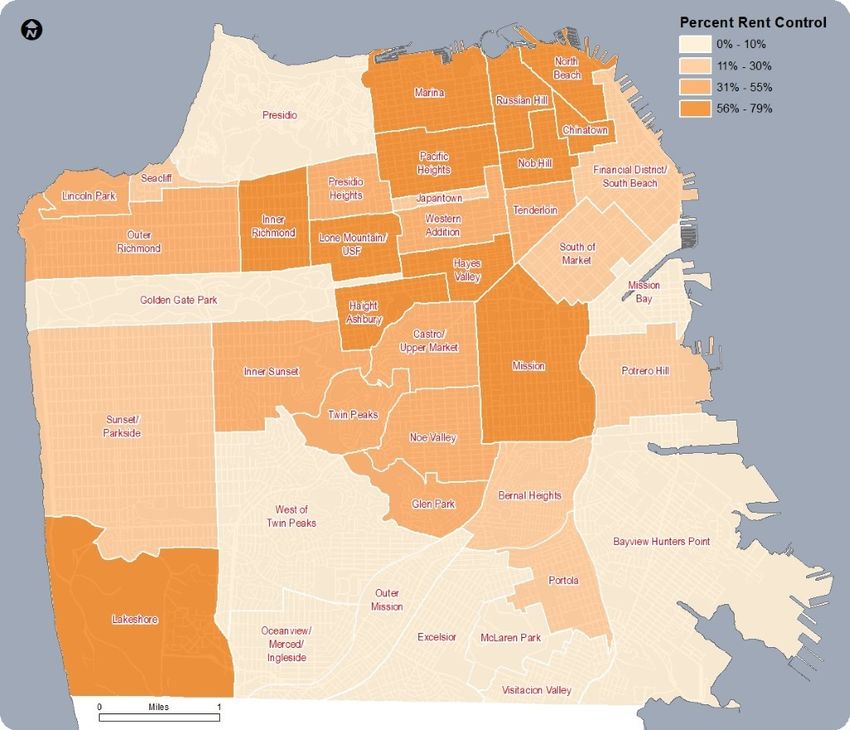
Income and Inequality

Rise in Income Inequality

Income inequality has been increasing in the city and is particularly pronounced between white people and
people of color. The median income for Black households is just $30,442, about 23% of the non-Hispanic white
household income of $132,154. American Indian median household income was 46% of whites’ at $61,250 and
for Latinos median household income was $72,578, 55% of whites’. Asian median household income was
$88,016. While about 12% of white households are extremely low income (ELI, or earning less than 30% of the
Area Median Income), nearly 48% of Black households are ELI, 34% of American Indian households, and 23%
each of Asian and Latino households. No doubt because of lower incomes, people of color are more likely to
experience housing cost burdens particularly for Black, American Indian, and Latino renters. People of color are
also more likely to experience overcrowding.

Figure 4: San Francisco Households by Income

Source: SF Planning Analysis of 2014-2018 IPUMS

Table 1: Median Household Income by Race
                                                  Median Household Income
Citywide                                                            $104,552
American Indian And Alaska Native                                    $61,250
Asian                                                                $88,016
Black Or African American                                            $30,442
Hispanic Or Latino (Of Any Race)                                     $72,578
Native Hawaiian And Other Pacific Islander                           $76,333
Some Other Race                                                      $59,497
Two Or More Races                                                   $114,399
White, Not Hispanic Or Latino                                       $132,154
Source: 2018 5 year American Community Survey

                                                                                                              5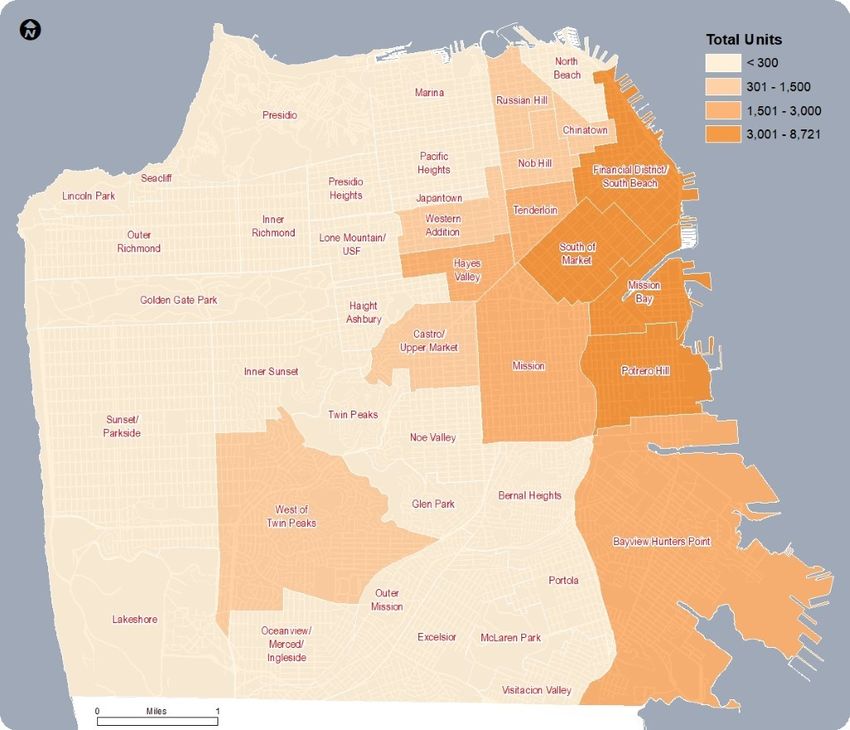
Increase in Higher Income Households, Decline in Those with Low and Moderate Incomes

From 1990 to 2018, San Francisco added more than 85,000 households with above moderate incomes over
120% of Area Median Income (AMI)1 when adjusting for inflation. Of those new households, the majority earn
more than 200% of AMI. Some of these households may previously have been moderate or lower income. San
Francisco’s increase in higher income households has driven up the city’s median income dramatically.
Adjusting for inflation, median income increased 41% from 2000 to 2018, rising from $79,731 to $112,376.

Over the same period of 1990 to 2018, the number of low and moderate income households declined by over
30,000. Low income households earning between 50% and 80% of AMI have seen the greatest declines along
with Very Low Income (VLI) households earning 30% to 50% of AMI. Moderate income households earning
between 80% and 120% of AMI have also declined. The declines in these income groups in San Francisco were
far greater than in the region as a whole. Interestingly, Extremely Low Income (ELI) households earning less
than 30% of AMI increased by 15% over the time period. ELI households may find few housing options
anywhere and may attempt to stay in the city despite high costs. Protected housing such as single room
occupancy (SRO) buildings that offer more affordable options as well as other affordable housing programs in
San Francisco may be part of why the number of ELI households has been stable or grown. In addition,
university students may have increased the numbers of ELI people.

Figure 5: Percentage Change in population by income 1990 to 2018

Source: SF Planning Analysis of 2014-2018 IPUMS

1The median income represents the middle of the income spectrum in the city, with half of households earning above and half earning
below that amount. A household’s income is classified relative to the median based on both their income and the number of people in
the household.

                                                                                                                                  6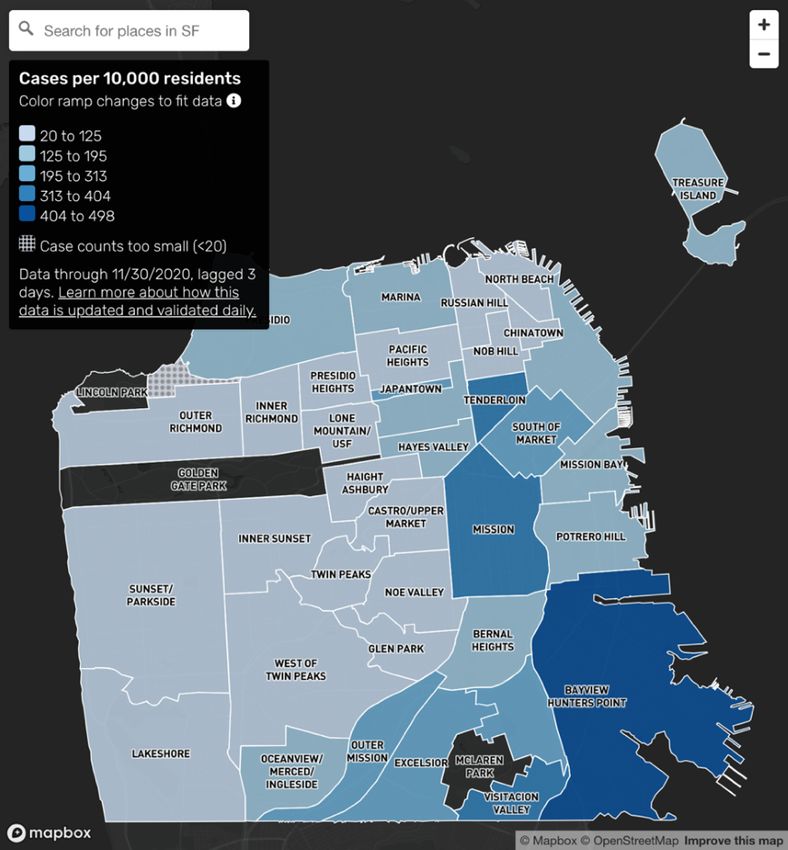
Age, Disability, and Household Type
An Aging Population and Significant Number of People with Disabilities

The median age in San Francisco was 38.7 years in 2018, about one year older than 2010 and two years older
than 2000. In 2018 seniors over 65 years old made up 15.6% of the city’s population or 138,000 people, up two
percentage points since 2000, indicating the aging of the city. Seniors are more likely to be homeowners,
providing greater housing security, but seniors are also more likely to be lower income and have higher rates of
housing cost burden for both renters and owners. Asian and Black residents are more likely to be seniors and
seniors head a higher share of Asian and Black households.

More than 10% of San Franciscans, 88,000 people, are living with a physical or mental disability. 51% of people
with disabilities are seniors and seniors are the majority of people with disabilities who head a household.
Seniors make up a majority of people with ambulatory, self-care, independent living, and hearing disabilities.
People with cognitive and vision disabilities are more broadly distributed in the population but are still
disproportionately seniors. Nearly half of non-seniors with disabilities who head a household are ELI and nearly
75% are lower income, far higher shares than the city in general. Black and American Indian people have higher
rates of disability. More than half of people with disabilities who head their own household live alone (54%)
followed by living in families with children (14%).

Figure 6: Population by Age Group, 2000-2040

Source: Census Bureau, ABAG/MTC

More Couples and Dropping Share of Families with Children

Most of San Francisco’s households are smaller, including 36% individuals and 24% couples. A major change in
the city is growth in couples, both married and unmarried, who increased in number by 28,500 or over 50%,
since 1990, far more than total household growth of 18%. Growth in people living alone and households with
children has fallen behind overall growth and they make up a smaller share of the city today than in the past.
The number of families with children has remained largely the same even as the city’s population has grown,

                                                                                                                 7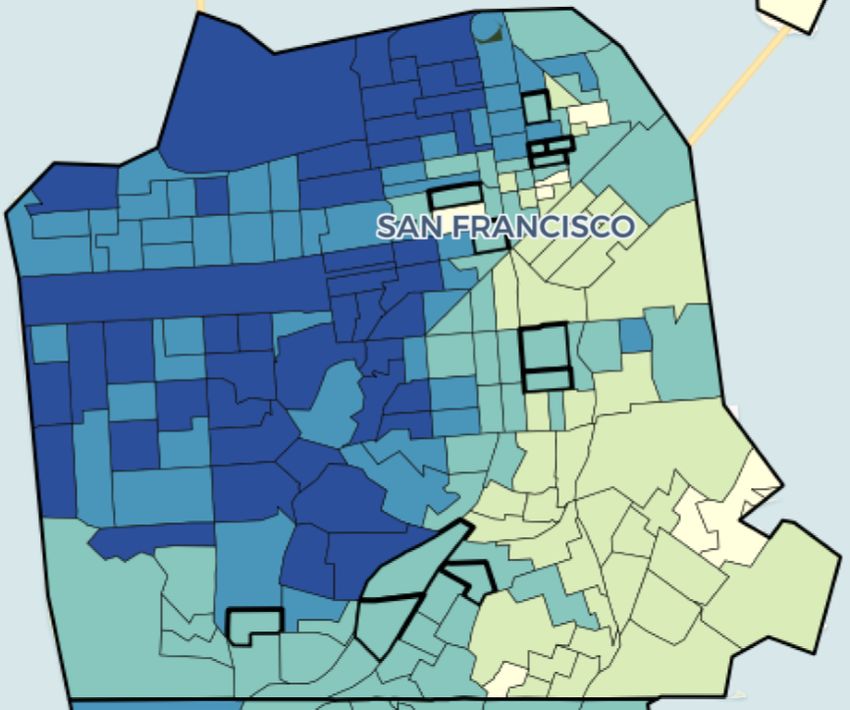
indicating fewer families with children are able to keep up with rising costs. People of color were more likely
than white people to live in family households, particularly Asians and Latinos.

Couples are more likely to be higher income with nearly 40% of couples earning more than 200% of AMI
compared to about a quarter of all households. Only about a quarter of couples are low income. Roommates
are also more likely to be higher income. The income distribution of families with children is similar to the city
as a whole with substantial polarization: there are more than 23,000 low income families with children and
nearly 26,000 higher income families with children earning more than 150% of AMI. Of all households, one
person households are the most disproportionately low income. More than 40% of people living alone are VLI
or ELI. There are 40,000 one person ELI households, 61% of all ELI households. Families with children are the
next most numerous ELI group at over 8,500 households.

Figure 7: Households by Type

Source: SF Planning Analysis of 2014-2018 IPUMS

Figure 8: Household Type by Income
100%
             13%                                  16%
                                       29%                     25%
 80%         10%          39%                           38%
                                                  11%
              9%                                               12%
                                       11%        11%
 60%         14%                                               9%
                          14%          8%         19%   14%
             13%                                               15%
 40%                       9%          16%              14%
             11%                                  17%          12%
                          13%          14%              12%
 20%                       9%                     13%    8%    9%
             31%                       9%
                           6%                            6%    18%
                           9%          13%        13%    9%
   0%
          1 Person      Couple   Household Related Roommates Citywide
                                w/ Children Adults
     Below 30% AMI        30%-50% AMI      50%-80% AMI  80%-120% AMI
     120%-150% AMI        150%-200% AMI Above 200% AMI
Source: SF Planning Analysis of 2014-2018 IPUMS

                                                                                                                     8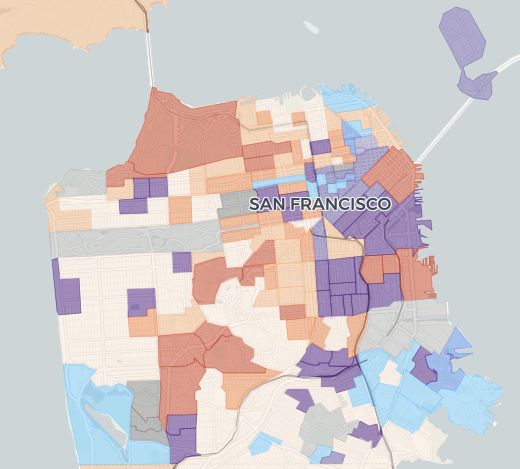
Tenure and Homelessness
A Majority Renter City with Marked Income Inequality Between Renters and Owners

San Francisco remains a majority renter city with 62% of households renting (over 226,000 in 2018) and 38%
owning their homes (more than 136,000 in 2018). Homeowner households tend to be larger with an average of
2.7 people compared to 2.1 people for renters. Renters are markedly lower income than owners with median
renter income at $94,739 and median homeowner income at $145,860. About 16% of owners are very low
income, including 9% ELI owners, while 34% of renters are very low income including 24% ELI renters.

Owners are slightly more likely to be moderate or middle income than renters, though there are far more
renter households overall including more of these income groups. A higher share of owner households are
higher income with 32% of owners earning more than 200% of AMI. In contrast, 20% of renters earn more than
200% of AMI. In fact only at this higher income bracket are the numbers of owners and renters similar, with
over 42,700 owners and 46,200 renters earning more than 200% of AMI. Likely due to lower incomes, renters
tend to have higher rates of cost burden and crowding. All racial and ethnic groups in the city are majority
renter though Black, American Indian, and Latino householders are less likely to be owners than white people.
Asian householders have the highest rate of homeownership.

Figure 9: Median Household Income by Tenure

                                                                     Source: 2018 1 Year ACS
Table 2: Tenure by Race
                                                  Owners   Renters
 Amer Indian                                      22%      78%
 Asian                                            48%      52%
 Black                                            23%      77%
 Hispanic/ Latino                                 24%      76%
 White                                            36%      64%
 Other                                            35%      65%
 Two or More Race                                 25%      75%
 Citywide                                         37%      63%
Source: SF Planning Analysis of 2014-2018 IPUMS

                                                                                                           9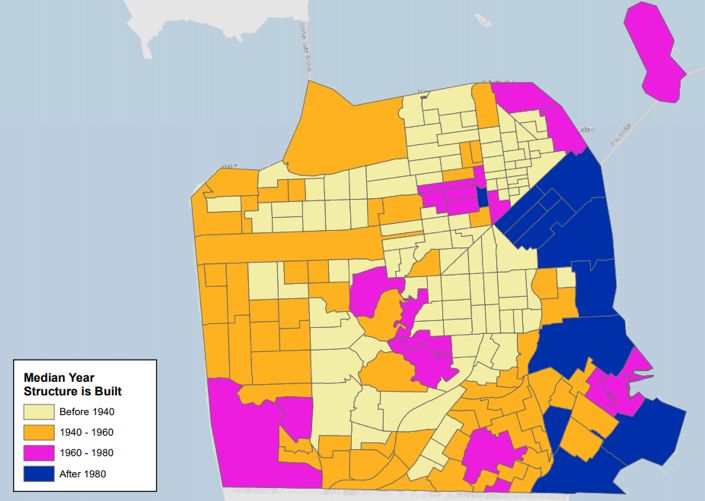
Increase in People Experiencing Homelessness
From 2005 to 2019 the biannual point in time (PIT) count of people experiencing homelessness increased from
just over 5,000 to about 8,000 people. The increase was driven mostly by a doubling of people who were
unsheltered from 2,655 in 2005 to 5,180 in 2019. The number of unsheltered people has grown steadily nearly
every two years since 2005 with a large jump between 2011 and 2013 and another between 2017 to 2019. The
rise in people who are unsheltered tracks with the rapid economic and job growth in the city and region and
increase in rents and home prices. People of color disproportionately experience homelessness in San
Francisco, in particular Black and American Indian people who make up a share of the homeless population 5
to 7 times their share of the city’s population. Latinos also experience an elevated rate of homelessness.

The number of transitional age youth (TAY) 18-24 years old experiencing homelessness has declined from over
1,902 in 2013 to 1,145 in 2019, likely due to investment in services for this group. The number of families
experiencing homelessness remained relatively stable from 2015 to 2019 at around 200, however, 94% of
families with children experiencing homelessness are sheltered due to specific investments by the City and
philanthropies. The San Francisco Unified School District estimates about 1,800 students experienced housing
instability or homelessness in 2018, similar to 2016’s numbers.

Figure 10: People Experiencing Homelessness by Shelter Status (Federal Standard)

Source: 2019 San Francisco Point-In-Time Count Reports, Department of Homeless and Supportive Housing

Figure 11: Homeless Population by Race

Source: 2019 San Francisco Point-In-Time Count Reports, Department of Homeless and Supportive Housing;
*Note: 18% of respondents identified as Hispanic/Latinx for 2019 Homeless Survey Population, 15% identified as Hispanic/Latinx for the 2019 San
Francisco General Population Estimates

                                                                                                                                                  10
Jobs and Wages
Big Increase in Jobs and Working Residents Since 2010 Slowed or Reversed by Covid-19
From 2010 to 2019, the number of workers in San Francisco grew by 225,000. While some of the rise was due
to recovery from the Great Recession, the city reached a new peak in jobs with 150,000 more jobs than the
total reached in the year 2000, near the peak of the “Dot Com” boom. As of 2018 there were more than
536,000 working residents in San Francisco, up 90,000 since 2010.
The increase in jobs in the city from 2010 to 2019 was part of a regional surge of nearly 900,000 jobs added,
463,000 more jobs than in 2000. Santa Clara County added the most jobs since 2010 (277,000) followed by San
Francisco, Alameda County (162,000), and San Mateo County (98,000). These four counties had 84% of all jobs
added in the region while San Francisco alone accounted for 24% of jobs added and Santa Clara 31%. While San
Francisco is home to thousands of residents who work in other cities, about 250,000 net in-commuters came to
the city each day, the most of any Bay Area county.
The closure of businesses or reduction of operations in response to the Covid-19 Pandemic has at least
temporarily shrunk employment in San Francisco, particularly in leisure and hospitality such as hotels,
restaurants, bars, and event spaces. Unemployment in the city increased from 2% in January of 2020 to 11% in
July.
Table 3: San Francisco Employment Trends and Projections 2000-2040
Year Total Jobs Growth % Change San Francisco as %
(Loss) of Bay Area
2000 611,676 - - 17.3%
2010 545,721 (65,955) -10.8% 17.5%
2019 760,775 215,054 39.4% 19.0%
2030 (est.) 840,270 54,740 7.0% 19.1%
2040 (est.) 872,510 32,240 3.8% 18.6%
Source: 2000, 2010, 2019 BLS QCEW; 2030, 2040 Plan Bay Area 2040/ABAG Projections 2040
Big but Uneven Growth in Wages
Average wages increased significantly during the boom since 2010, growing to $129,888 in 2019, up more than
$53,000 in real dollar terms, or 31% in inflation adjusted dollars. The increase in average wages helped drive
the increase in higher income households in the city, however, increases in wages were not distributed evenly.
More than 60% of workers living in San Francisco earned less than $100,000 including at least 18% of workers
who earn less than $25,000 and 18% who earn between $25,000 and $50,000.
White residents are more likely to have higher wage jobs and to be employed in industries with more ability to
work from home such as professional services and management, finance, and information jobs. People of color
are more likely to work in lower paid fields and essential work areas like health services and retail. Latinos are
11more likely to work in accommodation and food service which have been particularly impacted by job loss due
to Covid-19 or may put workers at higher risk for contracting the virus.
San Francisco has a highly educated population and workforce, however, white residents and workers have
higher rates of educational attainment and educational attainment is associated with higher wages and access
to more employment opportunities.
Figure 12: Inflation Adjusted Average Wage 1990-2019
Source: BLS QECW data
Figure 13: Employed Residents by Wages
Source: SF Planning Analysis of 2014-2018 IPUMS
12Housing by Age, Type, and Occupancy
The City’s Housing Is Older on Average than Region And Varies in Type by Neighborhood
There are about 400,000 housing units in San Francisco. Nearly half (48%) of these homes were built before
1940 while another 34% were built between 1940 and 1980. In contrast, less than 15% of the region's housing
was built before 1940. In the 1980s and 1990s little housing was added- just 8% of the city’s housing. Since
2000, new construction added about 11% of the city’s housing, an increase in production from the 1990s but
far less than earlier periods.
Neighborhoods with buildings built mostly before 1940 cluster close to downtown and contain many of the
city’s buildings of 20+ units. Older housing is also common in neighborhoods developed along early transit
lines. These neighborhoods often have a mix of single family homes, smaller multifamily buildings of 2 to 9
units or 10 to 19 units as well as a few buildings over 20 units. After 1940, single family home neighborhoods
with more auto-oriented patterns were built. Most construction in the last 20 years is concentrated in the east
side of the city, often on former railyards or industrial land.
Map 1: Median Year Structure Built by Tract
Source: 2018 5 Year ACS
San Francisco’s housing is diverse in terms of size of buildings and units. About a third of the city’s housing is
single family homes and another 21% is in buildings of two to four units. One bedrooms and studios are more
likely to be in larger buildings, making up the majority of units in buildings with five or more units. Homes with
more bedrooms tend to be found in areas with more small buildings in the city’s west and south.
13Table 4: Units by Number of Bedroom by Number of Units in Building
Single 2-4 5-9 10-19 20+ Total
Family Units Units Units Units
Studio 951 3,094 3,152 8,001 35,645 50,843
1 Bedroom 4,875 17,210 15,282 17,859 34,265 89,491
2 Bedroom 37,171 33,923 11,503 7,355 19,586 109,538
3+ Bedroom 75,788 23,468 3,549 1,757 4,671 109,233
Total 118,785 77,695 33,486 34,972 94,167 359,105
Source: SF Planning Department Analysis of 2014-2018 IPUMS-USA
Building Type and Size vary by Tenure
Two thirds (66%) of homeowners live in single family homes, though such homes are only 33% of all housing.
Another 18% of homeowners live in two to four unit buildings and 11% live in buildings with 20 units or more.
Only about 5% of owners live in buildings of five to 19 units. In contrast, renters are far more likely to live in
larger buildings with 38% living in buildings of 20 units or more. 24% of renters live in two to four units
buildings, 13% in buildings with 10 to 19 units, 12% live in single family homes and 13% live in 5 to 9 unit
buildings. The majority of renters live in smaller units, with 22% living in studios and 35% living in one
bedrooms. 84% of renters live in a two bedroom or smaller. Owners, in contrast, are more likely to live in larger
units with 55% living in three bedrooms or larger and 35% living in a two bedroom. Housing built since 2010 is
more likely to be rental while owners disproportionately live in homes built before 1940 though the majority of
all housing, including older housing, is rental.
Table 5: Housing Units by Units in Structure and Tenure
Structure Type All Occupied Units Owner Renter
Single Family 118,028 33% 90,565 66% 27,463 12%
2-4 Units 77,439 21% 23,848 18% 53,591 24%
5-9 Units 33,884 9% 3,824 3% 30,060 13%
10-19 Units 31,728 9% 2,726 2% 29,002 13%
20 to 49 Unit 37,134 10% 4,407 3% 32,727 14%
50+ Units 64,135 18% 10,721 8% 53,414 24%
Other 479 0% 151 0% 328 0%
Source: 2018 1 Year ACS; percentages rounded to the nearest whole number
Table 6: Housing Units by number of Bedrooms
Bedrooms All Occupied Units Owner Renter
No Bedroom 51,743 14% 2,430 2% 49,313 22%
1 Bedroom 90,624 25% 10,407 8% 80,217 35%
2 Bedrooms 107,771 30% 47,478 35% 60,293 27%
3 Bedrooms 76,207 21% 50,307 37% 25,900 11%
4 Bedrooms 27,066 7% 19,320 14% 7,746 3%
5+ Bedrooms 9,416 3% 6,300 5% 3,116 1%
Source: 2018 1 Year ACS; percentages rounded to the nearest whole number
14Household Income Varies by Building Type and Unit Size
Lower income renters are much more likely to live in smaller homes than those with higher incomes and are
more likely to live in multifamily housing. ELI and VLI renters occupy 55% of studios though they are about 34%
of renters. In part this is because both ELI and VLI households are more likely to be one person. ELI and VLI
renters in particular are more likely to live in larger buildings with more than 20 units and buildings of 10 to 19
units are also more likely to house low and moderate income households than smaller housing types. In
contrast, those with higher incomes tend to occupy larger units, tend to have more people in the household,
and are more likely to own their home.
Despite high home prices, 50% of single family homes are owned by moderate or low income owners. Single
family homes have much lower turnover than multifamily ownership units or rental units, with 46% of single
family homes occupied for 20 years or more and 70% occupied for 10 years or more. Length of ownership may
explain why such a large number of single family homes have owners with low and moderate incomes though
current prices would likely be financially out of reach. These households may have bought a home when prices
were lower, inherited a home, or their income may have been higher when they bought, for example retirees.
Figure 14: Household Income by Building Size
Source: SF Planning Department Analysis of 2014-2018 IPUMS-USA
Figure 15: Household Income by Number of Bedrooms
Source: SF Planning Department Analysis of 2014-2018 IPUMS-USA
15Rent Control, SROs, and Affordable Housing
Majority of Renters Live in Rent Controlled Homes Concentrated in Certain Neighborhoods
There are approximately 166,000 housing units subject to rent control in San Francisco based on recent
estimates, more than 42% of the city’s housing. Approximately 70% of all renters are estimated to live in rent
controlled homes. More definitive information on rent controlled units, as well as rents and vacancy, will be
available in 2022 as a result of a 2020 Board of Supervisors ordinance that requires landlords to report rental
data. Rent control is shaped by both local and state law, but generally covers multifamily rental buildings of two
or more units that were certified for occupancy before June 13,1979. Vacant units subject to rent control can
be rented at market rent but subsequent annual rent increases are generally limited to a percentage of
inflation.
Rent control is not tied to income and renters of all income levels live in rent controlled units. Rent control can
help provide stability for long-term tenants and, in general, longer term tenants tend to have lower incomes
than tenants in general. Rent controlled housing is particularly concentrated in certain neighborhoods with
more multifamily housing in the north and east of the city. Recent movers into rent controlled units are more
than 50% above moderate income, illustrating that over time occupancy of rent controlled housing may be
shifting with the city overall.
Map 2: Concentration of Rent Controlled Housing by Neighborhood
Source: SF Planning Estimates based on SF Open Data Parcel and Building Data
16Figure 16: Renter Income by Estimated Rent Control Status and Length of Occupancy
Source: SF Planning Analysis of 2014-2018 IPUMS. Recent movers are within 4 years.
SROs Continue to Provide Housing for Low Income San Franciscans
There are over 19,000 SRO residential units in San Francisco, often called residential hotels, that are protected
from demolition or conversion to tourist use. This older, basic housing consists of one room, often with limited
or shared kitchens and/ or bathrooms, and is often more affordable for low income people who have few other
options. SRO housing is overwhelmingly concentrated in a few older, central neighborhoods close to
Downtown, most prominently the Tenderloin, along with Chinatown, North Beach, Nob Hill, SoMa, and the
Mission. About 30% of SROs units are nonprofit owned.
Map 3: SROs in San Francisco by Nonprofit and For-profit status
SF Planning Map of Department of Public Health and Department of Building Inspection Data
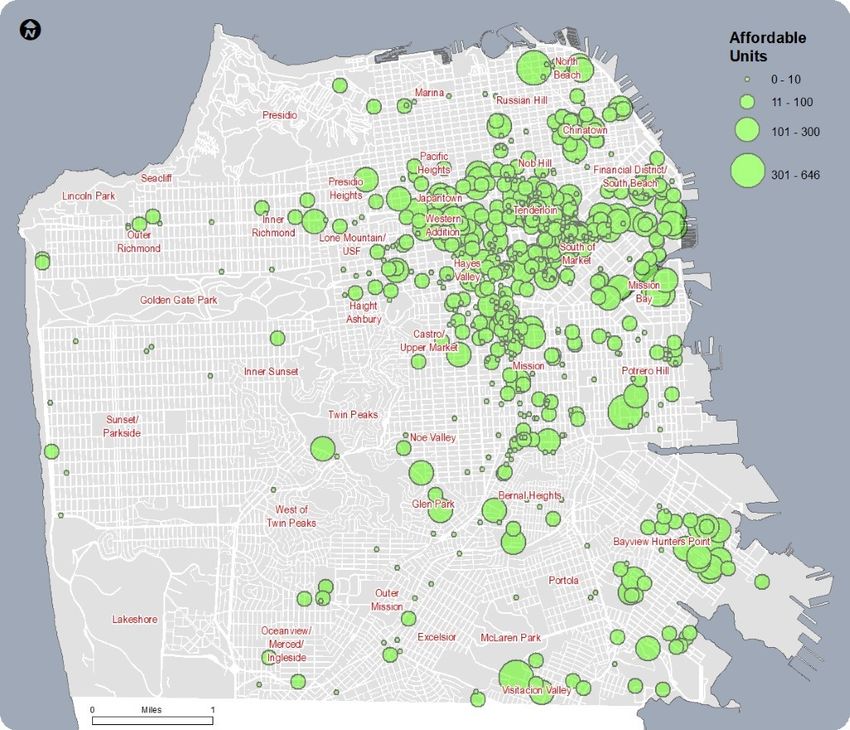
17Income-Targeted Affordable Housing and Rent Assistance Help Lower Income People
The city has an estimated 35,600 units of income targeted affordable housing for low and moderate income
people in around 700 buildings, nearly 9% of all housing. These homes have been built or acquired over
decades using various federal, state, and local funding programs that often must be combined together:
• The Mayor’s Office of Housing and Community Development (MOHCD) has a portfolio of more than
23,400 affordable homes funded at least in part with local dollars.
• There are also nearly 2,900 inclusionary units built as part of market rate buildings. More than 1,300
inclusionary units are ownership, typically for moderate income people. Market rate projects have also
paid in lieu fees providing millions for affordable housing.
• More than 21,000 of the City’s affordable homes were built or preserved with federal Low Income
Housing Tax Credits (LIHTC).
• 4,700 older units were built with US Department of Housing and Urban Development (HUD) funding
and/or project-based rent assistance.
• Public housing is the oldest federally funded affordable housing. Recently, San Francisco has rebuilt and
rehabilitated public housing using the federal Rental Assistance Demonstration (RAD) Program and
local HOPE SF program for large sites with about 1,300 units still to help.
• There are more than 1,900 units at some risk of conversion to market rate by 2030 due to expiring
affordability restrictions and 700 of these units are at risk in the next 5 years.
Map 4: Affordable Housing Units in San Francisco
Source: California Housing Partnership, Mayor’s Office of Housing and Community Development, US Dept. of Housing and Urban Development (HUD)
18Until 2012, Redevelopment provided most local affordable housing funds. Since then, San Francisco has
created new funding sources that have grown to hundreds of millions annually. Some sources are ongoing, like
the Housing Trust fund, but some of the largest sources are time limited and must be renewed, for example
affordable housing bonds approved by voters in 2015 and 2019. Most affordable housing funding comes from
property taxes (bonds, most of the trust fund, etc.) or fees from new development.
The San Francisco Housing Authority administers over 12,000 federally-funded housing choice vouchers (HCVs
also known as Section 8) that help lower income people rent apartments in the private market, typically while
paying no more than 30% of income. Thousands of these vouchers are project-based to support both tenants
and affordable housing developments. HCV use is particularly concentrated in lower income areas of the city. In
addition to federal rent assistance, the city of San Francisco uses federal, state, and local sources to invest
hundreds of millions in shelters and permanent supportive housing for people currently or formerly homeless,
including master-leasing existing housing and providing operating subsidy for units and services in 100%
affordable buildings. In 2018 voters approved Proposition C which increased taxes on companies with $50
million or more in gross receipts to provide around $300 million per year for services and housing for people
experiencing homelessness.
Map 5: Housing Choice Vouchers by Census Tract
Source: HUD
19Housing Production and Costs
Housing Production and Permitting Has Increased, Including Affordable Housing
In 2016 new housing built in San Francisco reached 5,000 units, a high not seen in decades. Production grew
from an annual average of 964 units in the 1990s to 2,800 units from 2010 to 2019. For context, 5,000 units is a
little over 1% growth and the 28,000 units built from 2010 to 2019 are 7% of all homes. 87% of all housing built
since 2005 was added in buildings of 20 units or more, 4% in one unit buildings and 4% in two to four units.
Only about 2% of new homes were added in buildings of five to nine units and 3% in buildings of 10 to 19 units.
The city has a pipeline of over 70,000 housing units in various stages of permitting and approval, however, the
majority of this housing is in large projects such as Candlestick, Treasure island, and Park Merced that will be
built over decades rather than years. Housing production regionally has fallen to some of the lowest levels in
decades, with San Francisco becoming one of the higher housing producers. A key challenge is construction
costs that have risen to be among the highest in the world.
Expanded funding has increased affordable housing production, which reached a peak of over 1,400 units in
2019, and preservation including RAD rehabilitation of over 3,000 public housing units and purchase of
hundreds of rent controlled units through the Small Sites Program. In the last few years, affordable projects
totaling more than 1,000 units have received ministerial approvals due to Senate Bill 35. Since 2010, 25 percent
of all new housing built in the city has been affordable.
Figure 17: Housing Production and Affordability 1990-2019
Source: SF Planning Analysis of Department of Building Inspection Data
Figure 18: New Housing Production 2005-2019 by Building Size
Source: SF Planning Analysis of Department of Building Inspection Data
20New Housing Has Been Concentrated In A Small Number of Neighborhoods
Housing production, both market rate and affordable, has been extraordinarily concentrated in just a few
neighborhoods that allow multifamily housing with 85% of new housing in Downtown/South beach, SoMa,
Mission Bay, Potrero Hill/ Dogpatch, Bayview Hunters Point, the Mission, Tenderloin, and Hayes Valley. 82% of
all new affordable housing has also been built in these eight neighborhoods. Many of these neighborhoods
have in common that they have former rail yards, shipyards, warehouses, or industrial sites that had fallen into
disuse and the city had changed zoning to allow multifamily housing and other uses. Development is more
common in these areas in part because multifamily housing is often restricted in many of the city’s other
residential neighborhoods. The city has expanded the ability of property owners to add accessory dwelling
units (ADUs) to existing residential properties resulting in hundreds of additional homes and a few thousand in
the pipeline.
Map 6: Housing Production by Neighborhood 2005 to 2019
Source: SF Planning Analysis of Department of Building Inspection Data
21Map 7: San Francisco Zoning Types
Source: SF Planning
Rents Fell During the Pandemic But Remain Expensive
Rental listing sites, such as Zumper, report median rents being over $2,500 for a 1-bedroom and $3,500 for a 2-
bedroom apartment. These sites capture the rents for available market rate apartments. The Census Bureau
reports median rents for all San Francisco apartments (including rent controlled, and affordable housing units)
being almost $2,000 as of 2019. With the pandemic, turn to remote work, and increase in vacancy in the city,
the rents on available apartments fell by nearly 25%. But even at these reduced rents, a household would need
to earn $107,000, about 105% of AMI for a two person household, to afford the median one bedroom rent. A
household would need to earn about $140,000 annually, about 120% of AMI for a three person household, to
afford the median two bedroom rent. Should rents return to recent highs, the rental market would become
considerably more difficult for moderate income households. Rents remain out of reach for lower income
households, the majority of whom find housing in the market.
22Figure 19: San Francisco Median Rent for 1 and 2 Bedroom Apartments
Source: Zumper Rent Data
Home Prices Stay High Through the Pandemic
Despite the pandemic, home values in San Francisco rose or remained stable in 2020 with a median over $1.4
million. Home prices have doubled in a span of 10 years and tripled over the last 20 years. The median value
for single family homes was close to $1.5 million while condominiums and coops were $1.2 million. To afford
the median home, a household would need to make about $290,000 per year and would need at least 10% of
the value as a down payment, making homeownership affordable to only high income households or those
with existing wealth.
Figure 20: San Francisco Median Home Value 1996 to 2020
Source: Zillow Home Value Index (All Homes, Single Family, Condo, Co-Op, Smoothed, Seasonally Adjusted)
23Housing Cost Burdens and Crowding
Cost Burdens Heavily Impact People with Low incomes and People of Color
Households spending 30% of income or more on housing are considered burdened and those spending over
50% are severely burdened. Cost burden leaves less money for other essentials like healthcare or food and puts
people at risk of losing housing due to a financial emergency. In San Francisco about 85,000 renters are rent
burdened, 38% of all renters. Severe rent burden affects 44,500 renters, more than half of all burdened renters.
Most severely burdened renters (28,000) are extremely burdened meaning they spend more than 70% of
income on rent. Not surprisingly, the lowest income tenants are most likely to be highly rent burdened but
moderate and middle income renters also experience some burden.
60% of severely burdened renters live alone and 10% are couples, indicating that small, affordable units could
help many severely burdened renters. There are also 5,600 severely burdened renters with children who need
affordable, multibedroom homes. People of color face higher rates of rent burden than white people, and
Black and American Indian renters in particular are more likely to be severely burdened. Senior renters and
those with disabilities also face more severe rent burden.
30% of owners are cost burdened or 39,500 owners. Over 19,000 of these burdened owners are severely cost
burdened. Middle income owners are more likely to be cost burdened than renters but more than 80% of
severely burdened owners are lower income. Homeowners of color experience higher rates of cost burden, and
Black homeowners in particular face higher rates of severe cost burden.
Figure 21: Severe Rent Burden by Income (Left) and Figure 22: Severe Owner Cost Burden by Income
4,029 , 711 , 1% 347 , 2% 189 , 1%
599 , 3%
9%
2,494 ,
7,868 , 13%
18% 7,427 ,
39%
4,335 ,
23%
31,925 ,
72%
3,757 ,
19%
Below 30% AMI 30%-50% AMI 50%-80% AMI
80%-120% AMI 120%-150% AMI 150%-200% AMI
Above 200% AMI
Source: SF Planning Department Analysis of 2014-2018 IPUMS-USA
24Figure 23: Rent Burden by Race and Ethnicity
Source: SF Planning Department Analysis of 2014-2018 IPUMS-USA
Figure 24: Owner Cost Burden by Race and Ethnicity
100% 0%
11% 9% 8% 11% 10%
90% 19% 5% 4% 20% 5%
28% 6% 5%
80% 4% 13% 0% 11%
17% 19% 15%
70% 18% 26%
60%
50%
40% 75%
72% 67% 73% 70%
30% 66%
59% 54%
20%
10%
0%
Amer Asian Black Hispanic White Other Two or All
Indian Race More Owners
Not Cost Burdened Cost Burdened
Races
Severe Cost Burdened Extreme Cost Burdened
Source: SF Planning Department Analysis of 2014-2018 IPUMS-USA
Many Lower Income Renters Face Overcrowding
Households with more than one person per room are considered overcrowded. Crowding can affect health, for
example making the spread of illness easier, and educational outcomes when children have no place to study
or play. Crowding overwhelmingly affects families with children (48% of overcrowded households) along with
related adults and even couples. About 60% of crowded households are lower income, however 40% are
moderate or middle and even higher income. Lower income renters in particular face higher rates of crowding.
People of color face higher rates of overcrowding, particularly Asian and Latino households who are more likely
to live in family households.
25Figure 25: Overcrowding by Income and Tenure
Source: SF Planning Department Analysis of 2014-2018 IPUMS-USA
Displacement and Access to Opportunity
Displacement Is Concentrated in Central Neighborhoods
Ongoing displacement of lower income households affects neighborhoods throughout the city, from historically
low income areas and communities of color to higher income areas that are becoming more exclusive.
Displacement analysis from UC Berkeley shows that historically low income areas with the greatest changes
include SoMa, Western Addition/ Fillmore, Mission, South Bernal Heights as well as to a lesser extent parts of
the Richmond, Sunset, and Oceanview. Ongoing displacement risk is also found in lower income neighborhoods
on the east side of the city including the Tenderloin, Chinatown, and Bayview. Worsening exclusion in higher
income areas is found in long-time high income enclaves such as Pacific Heights, Seacliff, Ashbury heights, Saint
Francis Wood, and Forest Hill as well as emerging areas of exclusion in Potrero Hill/ Dogpatch, Transbay/ Rincon
Hill, Laurel Heights, Russian Hill, Haight, Castro, Noe Valley, Bernal Heights, West Portal, and Sunnyside.
Neighborhoods with less displacement risk tend to have higher homeownership and are found farther from
Downtown in the west and south of the city including the Richmond, Sunset, Oceanview and Ingleside,
Excelsior, Outer Mission, Portola, and Visitacion Valley.
26Map 7: Urban Displacement Project Map
Source: Urban Displacement Project
Evictions Notices Increase in Economic Booms
One of the ways that displacement occurs is through eviction from rental homes. Eviction notices have tended
to increase with economic booms with more notices issued from 1997 to 1999, when data began, and 2015 to
2016 with both periods averaging more than 2,000 eviction notices per year. During periods of lower economic
growth, notices have dropped below 1,500 per year. From 2017 to 2019 eviction notices averaged about 1,500
and in 2020 declined to about 500 due to eviction moratoriums related to the pandemic. “No fault” evictions
including Owner Move-in and Ellis Act, are more likely to result in tenant move out as tenants have fewer
means to prevent the eviction. No fault evictions reached a peak in the late 1990s of over 1,500 but have
subsequently declined while still averaging more than 500 per year. “For cause” evictions, including non-
payment of rent or lease violations, have become the predominant form of eviction.
Figure 26: Eviction Notices (1997-2020)
Source: SF Open Data
27Patterns of Inequality by Neighborhood Were Created by Public and Private Policies
San Francisco’s neighborhoods have major disparities and people of color, particularly Black and Latinx people,
live disproportionally in areas that are lower income and have lower educational, employment, and health
outcomes than the city as a whole. Neighborhood inequities by race and income are the result of public policy
and private actions over decades including redlining, racial covenants, urban renewal, restrictive zoning that
create defacto segregation, and discrimination in renting, selling, and lending. While many of these practices or
policies have been outlawed, the effects continue today.
The state’s Opportunity Map, developed by the Othering and Belonging Institute at UC Berkeley to guide
affordable housing programs, shows higher resource areas in the center, north, and west sides of the city.
These areas tend to have higher incomes, higher home ownership, and higher educational, employment, and
health outcomes. Lower income areas are concentrated on the east and south sides of the city. Racially and
ethnically concentrated areas of poverty (RECAPs), where residents are disproportionately people of color and
low income, are found in Chinatown, Tenderloin, Western Addition, SoMa, Bayview/Hunters Point, and
Visitacion Valley.
Map 8: TCAC/ HCD Opportunity Map
Source: TCAC/HCD Opportunity Map
https://belonging.berkeley.edu/2021-tcac-
opportunity-map
28Disparate Environmental and Covid-19 Impacts by Neighborhood and Racial and Ethnic Group
Government policy restricted housing options for people of color and lower income people to housing closer to
commercial and industrial areas and near highways and the port on the east side of the city resulting in more
environmental health burdens on many of these communities today. San Francisco’s Environmental Justice
Communities, defined by levels exposure to pollution and health impacts as well as social and economic
indicators, are overwhelmingly concentrated in neighborhoods on the east and south sides of the city that are
disproportionately lower income and communities of color. Proximity to freeways is one of the biggest sources
of environmental pollution. In addition, sites including former power plants, the Naval Shipyard at Hunters
Point, sewage treatment and other industrial or waste facilities create higher environmental burdens.
Many of the people and neighborhoods that already experience greater environmental, social, and economic
inequities have also been most impacted by Covid-19. The top five neighborhoods in terms of Covid cases per
100,000 people have been Bayview Hunters Point, Tenderloin, Mission, Visitacion Valley, and the Excelsior all
disproportionately lower income and/or communities of color. Latinos have had elevated rates of Covid-19 and
people of color, particularly Latinos, are more likely to have essential jobs with Covid exposure risk. In addition,
people of color, particularly Latinos and Asians, are more likely to live in overcrowded housing which can be an
important risk factor for Covid transmission.
Map 9: Covid-19 Cases by Neighborhood
Source: SF Open Data
29RHNA for San Francisco
RHNA is a state-mandated regional process to ensure that cities zone sufficient sites and permit sufficient
housing to meet needs across incomes. RHNA is based on a forecast of future jobs, population, and
households. The RHNA for 2023 to 2030 also addresses existing needs like housing cost burdens, overcrowding,
and vacancy in units for rent or sale. The regional number has been set at 441,000 homes for the eight-year
period, more than double the previous RHNA cycle. RHNA is divided into income groups based on the region’s
current income distribution. The RHNA total will be allocated to the region’s cities using a methodology
approved by the Association of Bay Area Governments (ABAG) that was developed by a committee of elected
officials, planning staff, and housing advocates from around the region.
San Francisco’s RHNA for 2023 to 2030 is estimated to be 82,067, nearly three times the current RHNA goal of
28,869. The upcoming RHNA will be divided among income groups largely in proportion to the regional income
distribution. San Francisco will receive 40% of its units as very low and low income, more than 32,000 units,
and 43% above moderate income or over 35,000 units. Both the low income and above moderate income
allocations are larger than the entire current RHNA. Meeting the significantly larger RHNA targets will be
challenging given that annual housing production would need to be more than 10,000 units, double the city’s
highest production year in decades. San Francisco has never met affordable housing production goals in the
past when they were much lower than the estimated future goals, mostly because of the lack of affordable
housing funding from federal, state, and local sources.
Figure 27: Current and Estimated Future RHNA
Source: Association of Bay Area Governments
30You can also read