Dayton, Ohio COMPREHENSIVE HOUSING MARKET ANALYSIS - U.S. Department of Housing and Urban Development, Office of Policy Development and Research ...

Page created by Joyce Lane
 
CONTINUE READING
Dayton, Ohio COMPREHENSIVE HOUSING MARKET ANALYSIS - U.S. Department of Housing and Urban Development, Office of Policy Development and Research ...
COMPREHENSIVE HOUSING MARKET ANALYSIS

                      Dayton, Ohio

U.S. Department of Housing and Urban Development,
Office of Policy Development and Research
As of April 1, 2021

Share on:
Dayton, Ohio COMPREHENSIVE HOUSING MARKET ANALYSIS - U.S. Department of Housing and Urban Development, Office of Policy Development and Research ...
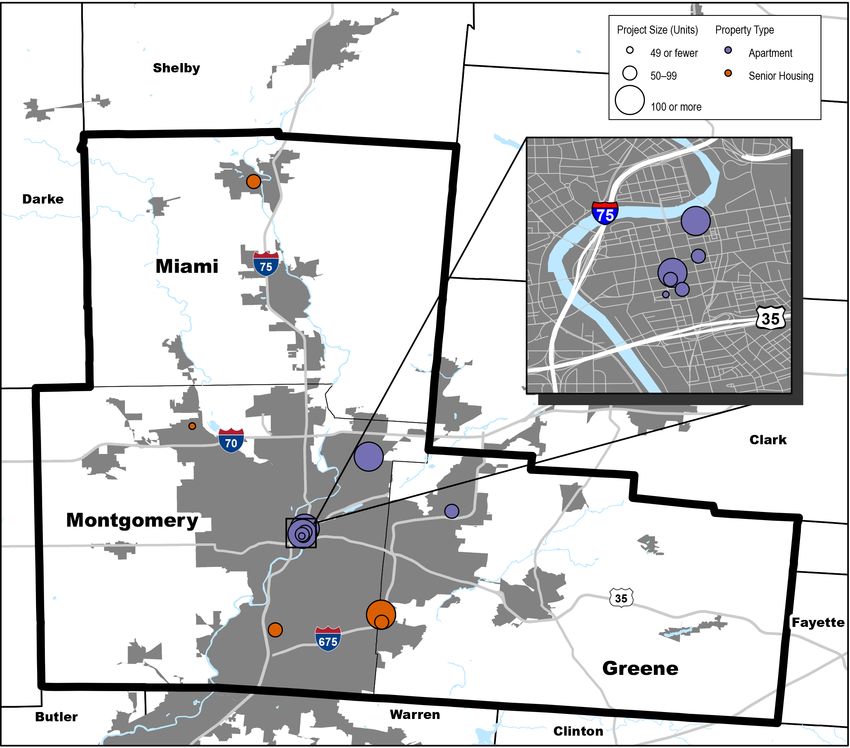
Dayton, Ohio Comprehensive Housing Market Analysis as of April 1, 2021                                                                              Executive Summary 2

Executive Summary
Housing Market Area Description
The Dayton Housing Market Area (HMA) includes Greene,
Miami, and Montgomery Counties in Ohio and is coterminous
with the Dayton, OH Metropolitan Statistical Area (MSA). The
HMA is in the Miami Valley region of southwest Ohio between
the Cincinnati, OH-KY-IN MSA and the Columbus, OH MSA.

The current population of the HMA is estimated at 810,200.

The HMA is known as the birthplace of aviation because
the inventors of the first successful airplane, Orville and
Wilbur Wright, were from the city of Dayton. During WWI,
more than 3,000 airplanes were manufactured at Dayton-
Wright Airplane Company plants throughout the HMA, and
airplane manufacturing continues to support the economy
of the HMA. The HMA is home to Wright-Patterson Air Force                    Tools and Resources
Base (AFB), which had an economic impact of $15.54 billion
on the HMA in 2018 (Dayton Development Coalition).                            Find interim updates for this metropolitan area, and select geographies nationally,
                                                                              at PD&R’s Market-at-a-Glance tool.
                                                                              Additional data for the HMA can be found in this report’s supplemental tables.
                                                                              For information on HUD-supported activity in this area, see the Community Assessment Reporting Tool.

                                                                                                        Comprehensive Housing Market Analysis Dayton, Ohio
                                                                         U.S. Department of Housing and Urban Development, Office of Policy Development and Research
Dayton, Ohio COMPREHENSIVE HOUSING MARKET ANALYSIS - U.S. Department of Housing and Urban Development, Office of Policy Development and Research ...
Dayton, Ohio Comprehensive Housing Market Analysis as of April 1, 2021                                                                                                                   Executive Summary 3

Market Qualifiers
Economy                                                                  Sales Market                                                                Rental Market
            Weak, but Improving: On a month-                                         Tight: The average home sales                                                 Balanced: Renter households
            to-month basis, 30.8 percent of                                          price in the HMA has been rising                                              currently account for 36.3 percent
            the 57,100 nonfarm payroll jobs                                          for more than 8 years, and the                                                of all households in the HMA—up
            lost during March and April 2020                                         rate of growth accelerated to the                                             from 35.1 percent in 2010.
            due to countermeasures implemented                                       highest level, 13 percent, during the
            in March 2020 to slow the spread                                         12 months ending March 2021, as
            of COVID-19 were recovered                                               the inventory of homes for sale
            by the end of March 2021 (not                                            declined significantly.
            seasonally adjusted).
Following a period of economic expansion from                            The sales housing market in the HMA is tight                                Rental housing market conditions in the HMA are
2011 through 2019, significant nonfarm payroll loss                      despite the recent economic contraction, with an                            balanced. The overall vacancy rate is estimated
in April 2020 contributed to overall job                                 estimated 1.3-percent vacancy rate—down from                                at 8.2 percent—down from 12.3 percent in 2010,
losses during the 12 months ending March 2021                            2.7 percent in 2010, when conditions were soft.                             when conditions were soft. An increase in renter
from a year earlier. Nonfarm payrolls in the HMA                         During the next 3 years, demand is estimated for                            households since 2010 has contributed to the
declined by 26,900 jobs, or 6.9 percent, to                              3,575 new homes. Demand in the HMA is expected                              absorption of excess vacant rental units. The
365,600 during the 12 months ending March 2021                           to increase throughout the 3-year forecast period                           apartment market in the HMA is tight, with a
from the same period a year earlier. All nonfarm                         because of low mortgage interest rates, continued                           3.1-percent vacancy rate during the first quarter of
payroll sectors except the transportation and                            net in-migration, and improving economic                                    2021, compared with 2.9 percent during the first
utilities sector contributed to the job loss. During                     conditions. The 310 homes under construction                                quarter of 2020 (Moody’s Analytics REIS). During
the 3-year forecast period, nearly all the lost                          in the HMA are expected to satisfy some of the                              the forecast period, demand is expected for 2,825
jobs are expected to be recovered, and nonfarm                           forecast demand.                                                            rental units in the HMA. The 1,325 rental units
payroll growth in the HMA is estimated to average                                                                                                    currently under construction are expected to satisfy
1.2 percent a year.                                                                                                                                  a portion of demand during the forecast period.

TABLE OF CONTENTS
Economic Conditions 4                                                                                                    3-Year Housing Demand Forecast
Population and Households 8                                                                                                                                        Sales Units                    Rental Units
                                                                                                                             Total Demand                             3,575                           2,825
Home Sales Market 12                                                       Dayton HMA
                                                                                                                             Under Construction                         310                           1,325
Rental Market 17                                                          Notes: Total demand represents estimated production necessary to achieve a balanced market at the end of the forecast period. Units under
Terminology Definitions and Notes 22                                      construction as of April 1, 2021. The forecast period is April 1, 2021, to April 1, 2024.
                                                                          Source: Estimates by the analyst

                                                                                                                                            Comprehensive Housing Market Analysis Dayton, Ohio
                                                                                                            U.S. Department of Housing and Urban Development, Office of Policy Development and Research
Dayton, Ohio Comprehensive Housing Market Analysis as of April 1, 2021                                                                                                                  Economic Conditions 4

Economic Conditions                                                                                             and public universities and several healthcare providers, which represent
                                                                                                                5 of the 10 largest employers in the HMA. As a result, the government, the
Largest Sector: Education and Health Services                                                                   manufacturing, and the education and health services sectors combine to
    The education and health services sector accounts for 19 percent of all                                     account for 46 percent of nonfarm payrolls (Figure 1).
    nonfarm payroll jobs in the HMA and was the sector that added the most
    jobs from 2001 through 2019, before the current economic downturn.                                          Current Economic Conditions and the
                                                                                                                Effects of COVID-19—Recent 24 Months
Primary Local Economic Factors                                                                                  Economic conditions have improved since May 2020, when businesses began
The HMA is the home of Wright-Patterson AFB and is a center for aerospace                                       to reopen gradually following the closure of nonessential businesses to slow
research and development. With 20,675 active military and civilian                                              the spread of COVID-19. By March 2021, 30.8 percent of the 57,100 jobs lost
employees, Wright-Patterson AFB is the largest employer in the HMA                                              on a monthly basis during March and April 2020 (not seasonally adjusted)
(Table 1) and the largest single-site employer in Ohio. In 2018, the AFB had
an economic impact of $15.54 billion on the HMA (Dayton Development                                                Figure 1. Share of Nonfarm Payroll Jobs in the Dayton HMA, by Sector
Coalition). Located on base is the National Museum of the United States
Air Force, the oldest and largest military aviation museum in the world,                                                                         Local 9%               Mining, Logging, & Construction 4%
                                                                                                                                    State 1%
which attracts more than 800,000 visitors a year and has an economic                                                                                                                       Manufacturing 11%
impact of approximately $40 million a year (Houston Business Journal).                                                      Federal 5%
Along with defense and aerospace, the HMA is home to several private                                                                                                                                   Wholesale
                                                                                                                 Other Services 3%                   Government                                           4%
                                                                                                                                                        16%
                      Table 1. Major Employers in the Dayton HMA
                                                                                                                    Leisure &
 Name of Employer                          Nonfarm Payroll Sector                Number of Employees               Hospitality 9%                                              Trade 14%                    Retail
                                                                                                                                                                   Total
 Wright-Patterson Air Force Base           Government                                     20,675                                                                   365.6                                     10%
 Premier Health Partners                   Education & Health Services                    12,425
 Kettering Health                          Education & Health Services                      9,319
                                                                                                                                                                                                      Transportation
 The Kroger Co.                            Wholesale & Retail Trade                        4,030
                                                                                                                                                                                                       & Utilities 4%
 Dayton Children’s Hospital                Education & Health Services                      3,341
 American Honda Motor Co., Inc.            Manufacturing                                   3,200                                                                                                    Information 2%
                                                                                                                         Education &
 Sinclair Community College                Government                                       3,163                     Health Services 19%                                                  Financial Activities 5%
 American CareSource Holdings, Inc.        Financial Activities                            3,021
 LexisNexis                                Professional & Business Services                3,000                                                                    Professional & Business Services 13%
 University of Dayton                      Education & Health Services                     3,000
 Notes: Excludes local school districts. Data include military personnel, who generally are not included in      Notes: Total nonfarm payroll is in thousands. Percentages may not add to 100 percent due to rounding.
 nonfarm payroll survey data.                                                                                    Based on 12-month averages through March 2021.
 Sources: Moody’s Analytics; Defense Manpower System, September 2020                                             Source: U.S. Bureau of Labor Statistics

                                                                                                                                             Comprehensive Housing Market Analysis Dayton, Ohio
                                                                                                              U.S. Department of Housing and Urban Development, Office of Policy Development and Research
Dayton, Ohio Comprehensive Housing Market Analysis as of April 1, 2021                                                                                                               Economic Conditions 5

had been recovered. As a result of those losses,                                   Table 2. 12-Month Average Nonfarm Payroll Jobs (1,000s) in the Dayton HMA, by Sector
economic conditions during the 12 months ending                                                                    12 Months Ending         12 Months Ending
                                                                                                                                                                      Absolute Change        Percentage Change
March 2021 were weak, but improving, compared                                                                         March 2020               March 2021
with a year earlier. During the 12 months ending                          Total Nonfarm Payroll Jobs                      392.5                    365.6                    -26.9                    -6.9

March 2021, jobs declined by 26,900 jobs, or                                Goods-Producing Sectors                         57.6                    53.4                     -4.2                    -7.3
                                                                             Mining, Logging, & Construction                13.8                     13.5                    -0.3                    -2.2
6.9 percent, to 365,600 (Table 2)—slower than
                                                                             Manufacturing                                  43.8                    39.9                     -3.9                    -8.9
the national rate of 7.4 percent. By comparison,
                                                                            Service-Providing Sectors                     334.9                    312.3                    -22.6                    -6.7
during the 12 months ending March 2020, jobs
                                                                             Wholesale & Retail Trade                      52.6                     50.4                     -2.2                    -4.2
in the HMA increased by 2,200, or 0.6 percent.                               Transportation & Utilities                     13.0                     13.5                     0.5                     3.8
Job losses in the HMA during the 12 months                                   Information                                     7.5                     6.8                     -0.7                    -9.3
ending March 2021 occurred in nearly all sectors                             Financial Activities                           18.2                     17.8                    -0.4                    -2.2
and were largest in sectors with jobs that cannot                            Professional & Business Services              52.5                      49.1                    -3.4                    -6.5
easily be done remotely. Nearly one-third of net                             Education & Health Services                    75.1                    70.8                     -4.3                    -5.7
job losses occurred in the leisure and hospitality                           Leisure & Hospitality                         39.6                      31.9                     -7.7                  -19.4
sector, which lost 7,700 jobs—a 19.4-percent                                 Other Services                                 13.9                     12.3                     -1.6                   -11.5
decline. Approximately 410 employees were                                    Government                                    62.4                     59.7                     -2.7                    -4.3

laid off at two hotels, including the Marriott at                         Notes: Based on 12-month averages through March 2020 and March 2021. Numbers may not add to totals due to rounding. Data are in thousands.
                                                                          Source: U.S. Bureau of Labor Statistics
the University of Dayton and the Crowne Plaza
Dayton (Ohio Department of Job and Family                                remotely were less affected by the countermeasures used to slow the spread of COVID-19, including
Services, Worker Adjustment and Retraining                               the government sector, which declined by 2,700 jobs, or 4.3 percent. The transportation and utilities
Notification). The education and health services                         sector was the only sector to add jobs during the past 12 months, increasing by 500 jobs, or 3.8 percent.
sector contracted by 4,300 jobs, or 5.7 percent,                         More than two-thirds of the gain was in the transportation and warehousing industry, which increased by
from a year earlier, to 70,800 jobs, partly because                      300 jobs, or 2.8 percent. Greater demand for e-commerce over the past few years was compounded by
hospitals were temporarily unable to provide many                        physical distancing measures and the temporary closure of nonessential brick-and-mortar retail during
elective procedures and colleges and universities                        the pandemic.
moved to remote learning or closed during the
2020 spring and fall semesters. Payrolls in the                          Current Conditions—Unemployment
manufacturing sector declined by 3,900, or                               As the economy of the HMA contracted during the 12 months ending March 2021, the average unemployment
8.9 percent, from a year earlier, partly because                         rate nearly doubled, to 8.1 percent from 4.2 percent a year earlier, but is below the 8.7-percent rate for the
the production of some manufactured goods was                            nation (Figure 2). The increase in the average unemployment rate in the HMA is in contrast to a general
deemed nonessential. Sectors in which a large                            decline that occurred from 2011 through 2019. Although high, the current unemployment rate remains below
percentage of the workforce was able to work                             the previous high of 11.7 percent during the 12 months ending March 2010.

                                                                                                                                          Comprehensive Housing Market Analysis Dayton, Ohio
                                                                                                           U.S. Department of Housing and Urban Development, Office of Policy Development and Research
Dayton, Ohio Comprehensive Housing Market Analysis as of April 1, 2021                                                                                                                                   Economic Conditions 6

                                                                                                                  Figure 2. 12-Month Average Unemployment Rate in the Dayton HMA and the Nation
Economic Periods                                                                                                                                                 Dayton HMA           Nation
of Significance                                                                                            12.0
                                                                                                                                                                    11.7

Contraction: 2001 Through 2010

                                                                         Unemployment Rate (%)
                                                                                                           10.0
                                                                                                                                                                                                                         8.7
During 2000, jobs in the HMA peaked at 424,400,                                                                                                                                 9.7
but from 2001 through 2010, the HMA lost jobs                                                               8.0
                                                                                                                                                                                                                               8.1
every year, with most of the job loss concentrated
                                                                                                            6.0
at the beginning and the end of the 10-year
period, when the nation underwent two economic
                                                                                                            4.0
recessions (Figure 3). From 2001 through 2010,
jobs in the HMA declined by an average of 6,400,                                                            2.0
or 1.6 percent, annually. Job losses occurred

                                                                                                                      0

                                                                                                                      4

                                                                                                                      6

                                                                                                                      9
                                                                                                                      8
                                                                                                                      5
                                                                                                                      2

                                                                                                                      3

                                                                                                                      7
                                                                                                                      1

                                                                                                                      0

                                                                                                                      1
                                                                                                                     9
                                                                                                                     0

                                                                                                                     6

                                                                                                                     8
                                                                                                                     2

                                                                                                                     3

                                                                                                                     4

                                                                                                                     5

                                                                                                                     7
                                                                                                                     1
                                                                                                             -0

                                                                                                                   -0

                                                                                                                   -0

                                                                                                                   -0

                                                                                                                   -0

                                                                                                                   -0

                                                                                                                   -0

                                                                                                                   -0

                                                                                                                   -0

                                                                                                                   -0

                                                                                                                   -2

                                                                                                                   -2
                                                                                                                   -1

                                                                                                                   -1

                                                                                                                   -1

                                                                                                                   -1

                                                                                                                   -1

                                                                                                                   -1

                                                                                                                   -1

                                                                                                                   -1

                                                                                                                   -1

                                                                                                                   -1
in 10 of 11 nonfarm payroll sectors, and the

                                                                                                           ar

                                                                                                                 ar

                                                                                                                 ar

                                                                                                                 ar

                                                                                                                 ar

                                                                                                                 ar

                                                                                                                 ar

                                                                                                                 ar

                                                                                                                 ar

                                                                                                                 ar

                                                                                                                 ar

                                                                                                                 ar

                                                                                                                 ar

                                                                                                                 ar

                                                                                                                 ar

                                                                                                                 ar

                                                                                                                 ar

                                                                                                                 ar

                                                                                                                 ar

                                                                                                                 ar

                                                                                                                 ar

                                                                                                                 ar
                                                                                                           M

                                                                                                                  M

                                                                                                               M

                                                                                                               M

                                                                                                               M

                                                                                                               M

                                                                                                               M

                                                                                                               M

                                                                                                               M

                                                                                                               M

                                                                                                               M

                                                                                                               M

                                                                                                               M

                                                                                                               M

                                                                                                               M

                                                                                                               M

                                                                                                               M

                                                                                                               M

                                                                                                               M

                                                                                                               M

                                                                                                               M

                                                                                                               M
manufacturing sector led declines with an average                        Note: Based on the 12-month moving average.
loss of 3,900 jobs, or 7.1 percent, annually. The                        Source: U.S. Bureau of Labor Statistics
largest manufacturing job reduction of 8,900 jobs,
or 19.7 percent, occurred in 2009, in part because                                                                                Figure 3. 12-Month Average Nonfarm Payrolls in the Dayton HMA
a General Motors Company (GM) assembly plant
                                                                                                                                                       National Recession             Nonfarm Payrolls
closed in the city of Moraine, laying off 1,075
                                                                                                           440
employees. In 1990, the HMA had the largest
                                                                         Nonfarm Payrolls (in Thousands)

concentration of GM employees outside Michigan.                                                            420
Government sector jobs decreased by an average
of 300, or 0.5 percent, annually from 2001                                                                 400
through 2008 before increasing by an average of
1,100, or 1.7 percent, annually from 2009 through                                                          380
2010. During the latter part of the period, the
federal government subsector increased by an                                                               360
average of 1,100 jobs, or 6.5 percent, annually
when the Base Realignment and Closure (BRAC)                                                               340

process added approximately 1,120 new military
                                                                                                                 0

                                                                                                                        1

                                                                                                                              2

                                                                                                                                    3

                                                                                                                                           4

                                                                                                                                                 5

                                                                                                                                                       6

                                                                                                                                                             7

                                                                                                                                                                   8

                                                                                                                                                                         9

                                                                                                                                                                                 0

                                                                                                                                                                                         2

                                                                                                                                                                                         3

                                                                                                                                                                                         4

                                                                                                                                                                                         5

                                                                                                                                                                                         6

                                                                                                                                                                                         7

                                                                                                                                                                                         8

                                                                                                                                                                                         9

                                                                                                                                                                                         0

                                                                                                                                                                                         1
                                                                                                                                                                                        1
                                                                                                              -0

                                                                                                                     -0

                                                                                                                           -0

                                                                                                                                 -0

                                                                                                                                        -0

                                                                                                                                              -0

                                                                                                                                                    -0

                                                                                                                                                          -0

                                                                                                                                                                -0

                                                                                                                                                                      -0

                                                                                                                                                                              -1

                                                                                                                                                                                      -1

                                                                                                                                                                                      -1

                                                                                                                                                                                      -1

                                                                                                                                                                                      -1

                                                                                                                                                                                      -1

                                                                                                                                                                                      -1

                                                                                                                                                                                      -1

                                                                                                                                                                                      -1

                                                                                                                                                                                      -1

                                                                                                                                                                                      -2

                                                                                                                                                                                      -2
                                                                                                           ar

                                                                                                                  ar

                                                                                                                        ar

                                                                                                                              ar

                                                                                                                                     ar

                                                                                                                                           ar

                                                                                                                                                 ar

                                                                                                                                                       ar

                                                                                                                                                             ar

                                                                                                                                                                   ar

                                                                                                                                                                           ar

                                                                                                                                                                                   ar

                                                                                                                                                                                   ar

                                                                                                                                                                                   ar

                                                                                                                                                                                   ar

                                                                                                                                                                                   ar

                                                                                                                                                                                   ar

                                                                                                                                                                                   ar

                                                                                                                                                                                   ar

                                                                                                                                                                                   ar

                                                                                                                                                                                   ar

                                                                                                                                                                                   ar
and civilian employees at Wright-Patterson AFB.
                                                                                                           M

                                                                                                                  M

                                                                                                                      M

                                                                                                                            M

                                                                                                                                    M

                                                                                                                                         M

                                                                                                                                               M

                                                                                                                                                     M

                                                                                                                                                           M

                                                                                                                                                                  M

                                                                                                                                                                       M

                                                                                                                                                                               M

                                                                                                                                                                                      M

                                                                                                                                                                                 M

                                                                                                                                                                                 M

                                                                                                                                                                                 M

                                                                                                                                                                                 M

                                                                                                                                                                                 M

                                                                                                                                                                                 M

                                                                                                                                                                                 M

                                                                                                                                                                                 M

                                                                                                                                                                                 M
From 2001 through 2010, the mining, logging,                             Note: 12-month moving average.
                                                                         Sources: U.S. Bureau of Labor Statistics; National Bureau of Economic Research

                                                                                                                                                                           Comprehensive Housing Market Analysis Dayton, Ohio
                                                                                                                                         U.S. Department of Housing and Urban Development, Office of Policy Development and Research
Dayton, Ohio Comprehensive Housing Market Analysis as of April 1, 2021                                                                          Economic Conditions 7

and construction sector lost an average of 500 jobs, or 3.8 percent, annually.      increasing by an average of 900 jobs, or 2.2 percent, annually. Expansions
Residential construction declined in response to the national housing market        in the manufacturing sector included a $350 million Fuyao Glass America
downturn and net out-migration of people seeking jobs in larger employment          automotive glass manufacturing plant at the former GM plant, adding 1,550
centers, including the Cincinnati and Columbus MSAs. From 2001 through              employees in 2015. From 2011 through 2019, the education and health services
2010, the education and health services sector was the only sector with a net       sector added an average of 800 jobs, or 1.1 percent, annually. In 2019, Kettering
gain in jobs, increasing by an average of 1,000 jobs, or 1.6 percent, annually,     Health completed a $25 million expansion of Grandview Medical Center
to 67,800 jobs. The sector became the largest nonfarm payroll sector in             in the western portion of the city of Dayton, which doubled the size of the
2005, contributing nearly 16 percent of jobs, a proportion that increased to        emergency department from 25 to 50 beds. From 2011 through 2019, jobs in
19 percent by 2010.                                                                 the professional and business services sector also increased, by an average
                                                                                    of 800, or 1.6 percent, a year, to 52,400 jobs. From 2011 through 2019, job
Economic Recovery: 2011 Through 2019                                                growth in the mining, logging, and construction sector resumed, increasing by
Following 10 years of economic contraction, the economy of the HMA generally        an average of 300 jobs, or 2.9 percent, annually, partly because of increased
expanded from 2011 through 2019, but job growth started decelerating in             residential construction in response to net in-migration. The government
2016. From 2011 through 2015, nonfarm payrolls rose by an average of 3,800          sector lost an average of 200 jobs, or 0.4 percent, annually from 2011 through
jobs, or 1.0 percent, annually and slowed to an average gain of 3,000 jobs,         2019 because job losses in the state and local government subsectors
or 0.8 percent, a year from 2016 through 2019, to 391,900 jobs. From 2011           offset an average annual increase of 100 jobs, or 0.5 percent, in the federal
through 2019, job growth in the HMA was slower than the 1.6-percent annual          government subsector. Job growth in the federal subsector occurred partly
growth rate for the nation. Within the HMA, 8 of the 11 sectors added jobs          because employment at Wright-Patterson AFB began increasing in 2015 in
during the 9-year period. The manufacturing sector added the most jobs,             support of increasing projects, including the development of flying cars.

Employment Forecast                                                                 is fully operational in 2022 at Wright-Patterson AFB. In addition, a new
During the 3-year forecast period, nonfarm payrolls are expected to increase        $78 million Dayton Children’s Hospital specialty care outpatient center is
by an average of 1.2 percent annually. By the end of the 3-year forecast, the       scheduled to be completed in 2023 at the main campus of the hospital.
level of nonfarm payrolls is expected to be only 1 percent below the February       Leisure and hospitality sector jobs are expected to recover a portion of the
2020 level, before the onset of the pandemic. Stronger economic conditions          jobs lost during the pandemic. Four new hotels, with a combined 490 rooms,
are expected in the early part of the forecast period as COVID-19 precautions       are scheduled to open, including two in downtown Dayton: the $25 million
are relaxed and businesses continue to reopen. Job growth is expected to            118-room Hotel Ardent Tapestry by Hilton, which is being converted from an
resume in the manufacturing and the education and health services sectors.          office building, and the 134-room AC Hotel by Marriott, which was scheduled
Defense aircraft manufacturing employment is expected to increase by more           to be completed in the summer of 2021 but is expected to open in the fall of
than 400 jobs when the F-35 Hybrid Product Support Integrator Organization          2022 because of delays caused by COVID-19.

                                                                                                            Comprehensive Housing Market Analysis Dayton, Ohio
                                                                                  U.S. Department of Housing and Urban Development, Office of Policy Development and Research
Dayton, Ohio Comprehensive Housing Market Analysis as of April 1, 2021                                                                                                       Population and Households 8

Population and                                                           2015, the population has grown an average of 1,675, or 0.2 percent, a year despite the slowdown and

Households
                                                                         subsequent decline in job growth because of a shift to net in-migration, which averaged 1,250 people
                                                                         a year, accounting for 75 percent of population growth. Simultaneously, net natural increase fell to an
Current Population: 810,200                                              average of 425 people annually. Some net in-migration was from Warren and Franklin Counties, partly
                                                                                                                   Table 3. Dayton HMA Population and Household Quick Facts
   Population growth in the Dayton HMA
                                                                                                                                                          2010                 Current               Forecast
   has accelerated since 2015 despite a                                                       Population             Population                          799,232               810,200                815,000
   slowdown in net natural increase because
                                                                                              Quick Facts             Average Annual Change                 -650                   990                  1,600
   of a shift to net in-migration.                                                                                    Percentage Change                      -0.1                   0.1                    0.2

Population Trends                                                                             Household              Households
                                                                                                                                                          2010
                                                                                                                                                         327,630
                                                                                                                                                                               Current
                                                                                                                                                                               338,600
                                                                                                                                                                                                     Forecast
                                                                                                                                                                                                     342,600
Population trends have generally mirrored
                                                                                              Quick Facts             Average Annual Change                  470                 1,000                 1,325
economic conditions in the HMA since 2000.                                                                            Percentage Change                       0.1                   0.3                   0.4
From 2000 to 2010, a period when the local                                Notes: Average annual changes and percentage changes are based on averages from 2000 to 2010, 2010 to current, and current to forecast.
economy was contracting, the population                                   The forecast period is from the current date (April 1, 2021) to April 1, 2024.
                                                                          Sources: 2000 and 2010—2000 Census and 2010 Census; current and forecast—estimates by the analyst
decreased by an average of 650, or 0.1 percent,
annually (Table 3; Census Bureau decennial                                                    Figure 4. Components of Population Change in the Dayton HMA, 2000 Through the Forecast
census counts). During the period, net out-
migration averaged 3,325 people, annually, and                                                                             Net Natural Change          Net Migration         Population Growth

offset average annual net natural increase of                                                  3,000
                                                                                               2,000
2,675 people (Figure 4). Subsequently, when the
                                                                          Population Change

                                                                                               1,000
economy began expanding, the population grew
                                                                                                  0
by an average of 250, or less than 0.1 percent,
                                                                                              -1,000
annually from 2010 to 2015. During the period,
                                                                                              -2,000
net out-migration slowed, averaging 1,225 people
                                                                                              -3,000
annually, and net natural increase slowed to
                                                                                              -4,000
an average of 1,475 people a year. During the

                                                                                                                                                                                                     st
                                                                                                                                                                        t
                                                                                                               10

                                                                                                                                              15
15-year period, net out-migration from the HMA

                                                                                                                                                                         n

                                                                                                                                                                                                  ca
                                                                                                                                                                      re
                                                                                                              20

                                                                                                                                          20

                                                                                                                                                                    ur

                                                                                                                                                                                              re
                                                                                                               –

                                                                                                                                         –
was highest to Warren and Franklin Counties,
                                                                                                            00

                                                                                                                                                                    C

                                                                                                                                                                                            Fo
                                                                                                                                      10

                                                                                                                                                                  –
                                                                                                        20

                                                                                                                                     20

                                                                                                                                                                                             t–
                                                                                                                                                               15

                                                                                                                                                                                           en
which are part of the Cincinnati and Columbus

                                                                                                                                                             20

                                                                                                                                                                                         rr
                                                                                                                                                                                      Cu
MSAs, respectively (Internal Revenue Service,
County-to-County Migration Data). Economic                                Notes: Average annual changes and percentage changes are based on averages from 2000 to 2010, 2010 to current, and current to forecast.
                                                                          The forecast period is from the current date (April 1, 2021) to April 1, 2024.
conditions in those MSAs were stronger. Since                             Sources: 2000 and 2010—2000 Census and 2010 Census; current and forecast—estimates by the analyst

                                                                                                                                                   Comprehensive Housing Market Analysis Dayton, Ohio
                                                                                                                      U.S. Department of Housing and Urban Development, Office of Policy Development and Research
Dayton, Ohio Comprehensive Housing Market Analysis as of April 1, 2021                                                                                                          Population and Households 9

because the HMA is more affordable than the                              Figure 5. Student Enrollment and Active-Duty Military and Civilian Personnel Trends in the Dayton HMA
Cincinnati and Columbus MSAs. An increase in
                                                                                                                  Student Enrollment          Active-Duty Military Personnel and Civilian Personnel
personnel at Wright-Patterson AFB slightly offset

                                                                                                                                                                                                                Active Military and Civilian Personnel
                                                                                               38,000                                                                                                  22,000
decreased student enrollment at universities and
colleges (excluding Sinclair Community College)

                                                                         Student Enrollment
in the HMA since 2011 (Figure 5)—a reversal from                                               36,000                                                                                                  20,000

increasing enrollment from 2001 through 2010.
                                                                                               34,000                                                                                                  18,000
Age Cohort Trends
Population growth from 2015 to 2019 was mostly                                                 32,000                                                                                                  16,000
the result of an increase in the retirement-age
portion of the population, generally defined
                                                                                               30,000                                                                                                  14,000
as residents age 65 and older. This age cohort

                                                                                                             09
                                                                                                        08

                                                                                                                                                                                                 20
                                                                                                                                                                                         19
                                                                                                                      10

                                                                                                                                                                   16

                                                                                                                                                                                  18
                                                                                                                                    12

                                                                                                                                             13

                                                                                                                                                    14

                                                                                                                                                           15

                                                                                                                                                                          17
                                                                                                                             11
increased by an average of 3,050, or 2.2 percent,

                                                                                                    20

                                                                                                             20

                                                                                                                    20

                                                                                                                           20

                                                                                                                                  20

                                                                                                                                           20

                                                                                                                                                  20

                                                                                                                                                         20

                                                                                                                                                                 20

                                                                                                                                                                        20

                                                                                                                                                                                20

                                                                                                                                                                                       20

                                                                                                                                                                                               20
annually (American Community Survey [ACS]
                                                                         Note: Student enrollment figures exclude Sinclair Community College.
1-year estimates) during the period. The relatively                      Sources: Integrated Postsecondary Education Data System, with estimates by the analyst; Defense Manpower System, September 2020
affordable housing market and services provided
by Wright-Patterson AFB to retired military                                                                          Figure 6. Population by Age Range in the Dayton HMA
personnel attracted or retained retired civilian
                                                                                                                                                  2015    2019
and military personnel; approximately 14,000                                         35%
military retirees reside in the HMA (Dayton
Business Journal, 2020). At the same time, the                                       30%

HMA is a popular place to live for young adults,                                     25%
including students and military personnel, ages
18 to 39. During 2019, this age cohort increased                                     20%

by an average of 1,500 people, or 0.6 percent,                                       15%
annually and accounted for 29 percent of the
                                                                                     10%
population—slightly higher than the proportion
in 2015 (Figure 6). During the same period, the                                               5%
portions of the population younger than 18 years
                                                                                              0%
old and age 40 to 64 years decreased by annual                                                      Younger than 18 Years              18–39 Years                40–64 Years             Older than 65 Years
averages of 490 and 2,700 people, or 0.3 and
1.1 percent, respectively.                                               Source: U.S. Census Bureau

                                                                                                                                                     Comprehensive Housing Market Analysis Dayton, Ohio
                                                                                                                       U.S. Department of Housing and Urban Development, Office of Policy Development and Research
Dayton, Ohio Comprehensive Housing Market Analysis as of April 1, 2021                                                                                             Population and Households 10

Population by Geography                                                  of net household formation since 2010, compared with all of the household increase during the 2000s.
                                                                         As a result, the homeownership rate fell to an estimated 63.7 percent as of the current date—down from
Nearly two-thirds of the population is
                                                                         64.9 percent in 2010 and 66.4 percent in 2000 (Figure 7).
concentrated in Montgomery County; however,
Montgomery County has had net out-migration                              Military and Student Households
since people began leaving the city of Dayton
                                                                         Wright-Patterson AFB and colleges and universities affect household formation in the HMA. Wright-
during the 1960s. In 1960, the population of the
                                                                         Patterson AFB provides unaccompanied housing for 400 military personnel and 100 single-family homes
city of Dayton peaked at 262,332 but decreased
                                                                         for officers and their dependents. The AFB also provides 2,100 privately operated single-family homes,
an average of 1.2 percent annually, to 141,527 in
                                                                         duplex homes, and townhomes for rent. Of the remaining 2,950 active-duty employees who live off base,
2010. From 2010 to 2020, the population of the
                                                                         approximately 34 percent own homes and 66 percent rent private units (estimates by the analyst). Of the
city declined an average of 0.1 percent annually,
                                                                         more than 50,600 students that attend colleges and universities in the HMA (Integrated Postsecondary
to 139,900. Slower net out-migration from the
                                                                         Education Data System, with estimates by the analyst), approximately 14,800 are housed in dormitories
city partly resulted from the revitalization of
                                                                         or university-affiliated student apartments. The remaining 35,800 students who live off campus and
downtown Dayton, boosted by economic growth
                                                                         do not live with their parents occupy an estimated 8,600 housing units; approximately 95 percent of
and the popularity of urban living. The population
in the suburban and rural counties of Greene and
Miami accounts for 21 and 13 percent of the HMA                                              Figure 7. Households by Tenure and Homeownership Rate in the Dayton HMA
population, respectively.                                                                                         Owner           Renter           Homeownership Rate (%)

Household Trends                                                                       400,000                                                                                            67
                                                                                                         66.4
Household growth has exceeded population

                                                                                                                                                                                               Homeownership Rate (%)
growth in the HMA since 2000, partly because                                           300,000                                                                                            66
of a higher proportion of students, active-
                                                                          Households

duty military, and retirees, which have smaller                                                                                             64.9
household sizes than family households. The                                            200,000                                                                                            65

number of households is currently estimated at
338,600, reflecting an average annual increase of
                                                                                       100,000                                                                               63.7         64
1,000, or 0.3 percent, from 327,630 households
in 2010. Among the households in the HMA,
a greater proportion have traditionally been                                                0                                                                                             63
owners, but that proportion has been declining                                                          2000                                2010                            Current

for the past two decades, albeit at a slowing rate.                       Note: The current date is April 1, 2021.
Renter households have accounted for 73 percent                           Sources: 2000 and 2010—2000 Census and 2010 Census; current—estimates by the analyst

                                                                                                                                        Comprehensive Housing Market Analysis Dayton, Ohio
                                                                                                          U.S. Department of Housing and Urban Development, Office of Policy Development and Research
Dayton, Ohio Comprehensive Housing Market Analysis as of April 1, 2021                                                               Population and Households 11

those households rent private units, and the remainder are homeowners             expected to account for 93 percent of the growth during the forecast period,
(estimates by the analyst). Together, military and student households account     as people continue to move to the HMA for job opportunities and affordable
for an estimated 1 and 8 percent of the 215,700 owner and 122,900 renter          housing; at the same time, net natural increase is expected to continue
households, respectively.                                                         slowing. During the next 3 years, the rate of household growth is expected
                                                                                  to rise slightly, increasing by an average of 1,325 households, or 0.4 percent,
Population and Household Growth Forecast                                          annually, reaching 342,600 households by April 1, 2024. The homeownership
During the 3-year forecast period, population growth is expected to continue      rate is expected to continue falling—although at a slower rate than from 2010
at the same rate it has been since 2015, increasing by an average of 1,600,       to the current date—to 63.5 percent.
or 0.2 percent, annually, to 815,000 by April 1, 2024. Net in-migration is

                                                                                                          Comprehensive Housing Market Analysis Dayton, Ohio
                                                                                U.S. Department of Housing and Urban Development, Office of Policy Development and Research
Dayton, Ohio Comprehensive Housing Market Analysis as of April 1, 2021                                                                                                                  Home Sales Market 12

Home Sales Market                                                                                          Table 4. Home Sales Quick Facts in the Dayton HMA
                                                                                                                                                                Dayton HMA                           Nation
Market Conditions: Tight                                                                                       Vacancy Rate                                           1.3%                               NA
                                                                                                               Months of Inventory                                     0.6                                1.2
   During March 2021, the HMA had
                                                                                                               Existing Home Sales                                  11,350                        6,010,000
   0.6 months of available for-sale
   inventory—down from 1.4 months a                                              Home Sales                      1-Year Change                                        -22%                              12%

   year earlier and significantly below a                                        Quick Facts                   New Home Sales Price                              $337,400                          $397,800

   peak of 12.6 months of available                                                                              1-Year Change                                         6%                                6%

   inventory in 2011 (CoreLogic, Inc.).                                                                        Existing Home Sales Price                         $184,400                          $355,200
                                                                                                                 1-Year Change                                         16%                              12%

Current Conditions                                                                                             Mortgage Delinquency Rate                              3.1%                              3.7%

The home sales market in the HMA is currently tight,                      NA = data not available.
                                                                          Notes: The vacancy rate is as of the current date; home sales and prices are for the 12 months ending March 2021; and months of inventory and
with an estimated vacancy rate of 1.3 percent—                            mortgage delinquency data are as of March 2021. The current date is April 1, 2021.
                                                                          Sources: Vacancy rate—estimates by the analyst; months of inventory—CoreLogic, Inc.; HMA home sales and prices—Zonda; national home sales
down from 2.7 percent in April 2010 (Table 4).                            and prices—National Association of Realtors® and Census Bureau/HUD
Sales market conditions were generally balanced
in the early 2000s and began to soften in                                50 years. During March 2021, the HMA had 0.6 months of available for-sale inventory—down from
2006 during the buildup to the housing market                            1.4 months a year earlier and below a peak of 12.6 months of available inventory in 2011 (CoreLogic, Inc.),
downturn. Conditions softened further through                            during the peak of the housing crisis. In March 2021, the average interest rate for a 30-year fixed-rate
2011, with the onset of the Great Recession                              mortgage was 3.2 percent—down from 3.5 percent in March 2020 and 5.0 in March 2010 (Freddie Mac).
and the subsequent housing market downturn.
Substantial overbuilding and net out-migration                           Home sales (including new and existing homes) declined 23 percent, to 11,650 homes, during the 12 months
also contributed to softening conditions.                                ending March 2021 (Zonda), largely because of declining for-sale inventory. By comparison, home sales
Subsequent economic growth, a shift to net                               increased 2 percent during the 12 months ending March 2020. The reduction in home sales during the
in-migration, and lower levels of homebuilding                           12 months ending March 2021 reflected declines of 19, 62, and 59 percent in regular resale, real estate
activity shifted the market to balanced conditions                       owned (REO), and new home sales, respectively, which accounted for 95, 3, and 2 percent of total sales.
from 2012 through 2019. In 2020, despite                                 During the 12 months ending March 2021, the average home sales price rose 13 percent, to $188,200,
significant job losses and increased homebuilding                        accelerating from the 4-percent increase during the previous year. Home sales prices for all sales types
activity, the sales market tightened, partially                          increased, including a 75-percent increase in REO home sales prices. The higher average home sales price
because of a decline in the number of homes                              is not only a result of a depleting for-sale inventory but also a surge in lumber prices. The price of lumber
listed for sale and because mortgage interest                            used to build an average home is nearly three times higher than it was in April 2020, causing the average
rates reached their lowest levels in more than                           price of a new single-family home to increase by $24,386 (National Association of Home Builders). More than

                                                                                                                                            Comprehensive Housing Market Analysis Dayton, Ohio
                                                                                                            U.S. Department of Housing and Urban Development, Office of Policy Development and Research
Dayton, Ohio Comprehensive Housing Market Analysis as of April 1, 2021                                                                                                                              Home Sales Market 13

                                                                                                                     Figure 8. Share of Overall Sales by Price Range During the
90 percent of new home sales in the HMA were
                                                                                                                         12 Months Ending March 2021 in the Dayton HMA
priced above $200,000 during the 12 months
ending March 2021 (Figure 8).                                                                                                                 New Sales           Existing Sales
                                                                                               20
Trends in Home Sales:
2005 Through 2019                                                                              15

                                                                          Share of Sales (%)
Home sales generally increased from 2012
through 2019 but were below the level reached                                                  10
in 2005 (Figure 9), when mortgage lending
standards were lenient. In 2005, home sales
                                                                                                5
totaled 17,800 but declined by an average
of 1,625 homes, or 12 percent, annually, to
8,100 in 2011 (Zonda). During that period,                                                       0
                                                                                                         $99k and Lower       $100k to $199k              $200k to $299k          $300k to $399k          $400k and More
tightening mortgage lending standards, the
local economic downturn, and net out-migration                           Note: New and existing sales include single-family homes, townhomes, and condominium units.
all put downward pressure on home sales. The                             Source: Zonda

decline in home sales from 2006 through 2011                                                                         Figure 9. 12-Month Sales Totals by Type in the Dayton HMA
reflected an average annual reduction of 16
                                                                                                                          New Home Sales            Regular Resales          REO Home Sales
and 26 percent in regular resale and new home
                                                                                               18,000
sales, respectively, but an 8-percent rise in
                                                                                               16,000
REO home sales. During the period, REO sales
                                                                                               14,000
increased from 1,775 in 2005 to 2,750 in 2011,
accounting for 10 and 34 percent of total home                                                 12,000
                                                                         Sales Totals

sales, respectively. From 2012 through 2019,                                                   10,000

home sales increased at an average annual rate                                                  8,000

of 8 percent, to 15,050 homes sold, in response                                                 6,000
to improving economic conditions. Nearly all the                                                4,000
gain in sales resulted from a 13-percent annual                                                 2,000
increase in regular resales, to 13,350, that offset                                                  0
an 11-percent annual reduction in REO sales,
                                                                                                     6

                                                                                                                              9
                                                                                                                     8
                                                                                                               7

                                                                                                                                                                                                                    0

                                                                                                                                                                                                                             1
                                                                                                                                      0

                                                                                                                                                                                                              9
                                                                                                                                                                                      6

                                                                                                                                                                                                      8
                                                                                                                                                      2

                                                                                                                                                              3

                                                                                                                                                                      4

                                                                                                                                                                              5

                                                                                                                                                                                              7
                                                                                                                                              1
                                                                                                   -0

                                                                                                             -0

                                                                                                                     -0

                                                                                                                            -0

                                                                                                                                                                                                                    -2

                                                                                                                                                                                                                           -2
                                                                                                                                    -1

                                                                                                                                            -1

                                                                                                                                                    -1

                                                                                                                                                            -1

                                                                                                                                                                    -1

                                                                                                                                                                            -1

                                                                                                                                                                                    -1

                                                                                                                                                                                            -1

                                                                                                                                                                                                    -1

                                                                                                                                                                                                            -1
                                                                                                 ar

                                                                                                           ar

                                                                                                                   ar

                                                                                                                          ar

                                                                                                                                  ar

                                                                                                                                          ar

                                                                                                                                                  ar

                                                                                                                                                          ar

                                                                                                                                                                  ar

                                                                                                                                                                          ar

                                                                                                                                                                                  ar

                                                                                                                                                                                          ar

                                                                                                                                                                                                  ar

                                                                                                                                                                                                          ar

                                                                                                                                                                                                                  ar

                                                                                                                                                                                                                         ar
to 1,075; at the same time, new home sales
                                                                                                M

                                                                                                          M

                                                                                                                M

                                                                                                                          M

                                                                                                                                 M

                                                                                                                                      M

                                                                                                                                              M

                                                                                                                                                      M

                                                                                                                                                               M

                                                                                                                                                                      M

                                                                                                                                                                              M

                                                                                                                                                                                      M

                                                                                                                                                                                              M

                                                                                                                                                                                                      M

                                                                                                                                                                                                              M

                                                                                                                                                                                                                         M
increased 8 percent a year, to 620 homes.                                REO = real estate owned.
                                                                         Source: Zonda

                                                                                                                                                          Comprehensive Housing Market Analysis Dayton, Ohio
                                                                                                                          U.S. Department of Housing and Urban Development, Office of Policy Development and Research
Dayton, Ohio Comprehensive Housing Market Analysis as of April 1, 2021                                                                                                                                Home Sales Market 14

Trends in Home Sales Prices:                                                                                  Figure 10. 12-Month Average Sales Price by Type of Sale in the Dayton HMA

2005 Through 2019                                                                                   350,000
                                                                                                                             New Home Sales              Regular Resales             REO Home Sales

The average home sales price increased every
year from 2014 through 2019 after generally                                                         300,000

                                                                          Average Sales Price ($)
decreasing from 2006 through 2013 (Figure 10),
                                                                                                    250,000
when REO sales—which tend to sell at a significant
discount—were increasing, putting downward                                                          200,000
pressure on sales prices. From 2006 through
2013, the average home sales price declined at an                                                   150,000
average annual rate of 1 percent. At the same time,
                                                                                                    100,000
regular resale home prices remained relatively
unchanged, and new home sales prices increased                                                       50,000
an average of 4 percent a year. From 2014 through

                                                                                                          6

                                                                                                                                 9
                                                                                                                        8
                                                                                                                  7

                                                                                                                                                                                                                         0

                                                                                                                                                                                                                                 1
                                                                                                                                                                                                                 9
                                                                                                                                         0

                                                                                                                                                                                         6

                                                                                                                                                                                                         8
                                                                                                                                                         2

                                                                                                                                                                 3

                                                                                                                                                                         4

                                                                                                                                                                                 5

                                                                                                                                                                                                 7
                                                                                                                                                 1
                                                                                                         -0

                                                                                                                -0

                                                                                                                        -0

                                                                                                                                -0

                                                                                                                                                                                                                       -2

                                                                                                                                                                                                                               -2
                                                                                                                                       -1

                                                                                                                                               -1

                                                                                                                                                       -1

                                                                                                                                                               -1

                                                                                                                                                                       -1

                                                                                                                                                                               -1

                                                                                                                                                                                       -1

                                                                                                                                                                                               -1

                                                                                                                                                                                                       -1

                                                                                                                                                                                                               -1
2019, a period that included increased home

                                                                                                       ar

                                                                                                              ar

                                                                                                                      ar

                                                                                                                              ar

                                                                                                                                     ar

                                                                                                                                             ar

                                                                                                                                                     ar

                                                                                                                                                             ar

                                                                                                                                                                     ar

                                                                                                                                                                             ar

                                                                                                                                                                                     ar

                                                                                                                                                                                             ar

                                                                                                                                                                                                     ar

                                                                                                                                                                                                             ar

                                                                                                                                                                                                                     ar

                                                                                                                                                                                                                             ar
                                                                                                      M

                                                                                                              M

                                                                                                                   M

                                                                                                                             M

                                                                                                                                     M

                                                                                                                                             M

                                                                                                                                                     M

                                                                                                                                                             M

                                                                                                                                                                     M

                                                                                                                                                                             M

                                                                                                                                                                                     M

                                                                                                                                                                                             M

                                                                                                                                                                                                     M

                                                                                                                                                                                                             M

                                                                                                                                                                                                                     M

                                                                                                                                                                                                                            M
sales, home sales prices increased an average                             REO = real estate owned.
of 4 percent a year, to $164,000. The sales price                         Source: Zonda
increased for every housing type during the period
                                                                         the HMA, however, increased from 1.6 percent a year ago. The recent increase in the rate began in May
as the inventory of homes for sale decreased
                                                                         2020, after the introduction of countermeasures to slow the spread of COVID-19 resulted in significant
every year.
                                                                         job losses, and some homeowners struggled to make their mortgage payments. Approximately 2,725
                                                                         mortgages in the region were 90 or more days past due in March 2021—almost a twofold increase from
REO Sales and                                                            March 2020; however, the number of foreclosures declined 32 percent, and REOs declined 62 percent.
Delinquent Mortgages                                                     The decline in foreclosures reflects increased participation in mortgage forbearance programs by
The overall improvement in sales housing market                          borrowers, which was provided for under the $2.2 trillion Coronavirus Aid, Relief, and Economic Security
conditions in the HMA since 2010 has led to a                            (CARES) Act.
reduction in the rate of seriously delinquent
mortgages and REO properties. As of March                                Sales Construction Activity
2021, 3.1 percent of home loans were seriously                           Homebuilding activity, as measured by the number of sales units permitted, has generally increased
delinquent or had transitioned into REO status—                          since 2012, but fewer new homes have been permitted on an annual basis compared with the
down from a peak of 7.5 percent in January 2010                          2000-through-2008 period (Figure 11). From 2000 through 2005, an average of 2,600 homes were
(CoreLogic, Inc.). The current rate is below the                         permitted annually. In response to continued local economic contraction and the onset of the national
3.7-percent rate for the nation. The overall rate in                     housing market downturn, the number of homes permitted decreased to an average of 1,475 homes

                                                                                                                                                             Comprehensive Housing Market Analysis Dayton, Ohio
                                                                                                                             U.S. Department of Housing and Urban Development, Office of Policy Development and Research
Dayton, Ohio Comprehensive Housing Market Analysis as of April 1, 2021                                                                                                                 Home Sales Market 15

annually from 2006 through 2008 before                                                         Figure 11. Average Annual Sales Permitting Activity in the Dayton HMA
declining further to an average of 710 homes                                                                       Single-Family Homes/Townhomes                 Condominiums
permitted annually from 2009 through 2011.                                  3,000
Production began to increase the following year,
                                                                            2,500
and from 2012 through 2020—a period that
included economic expansion and a shift to net                              2,000
in-migration—homebuilding activity increased to
an average of 860 homes annually. During the                                1,500

12 months ending March 2021, approximately                                  1,000
1,125 homes were permitted—up 100 homes
compared with the same period the previous                                    500

year. From 2000 through 2008, approximately                                      0
9 percent of all homes permitted were

                                                                                         5

                                                                                                       8

                                                                                                                      1

                                                                                                                                    6

                                                                                                                                                  17

                                                                                                                                                                18

                                                                                                                                                                               19

                                                                                                                                                                                             20

                                                                                                                                                                                                            21
                                                                                       00

                                                                                                     00

                                                                                                                    01

                                                                                                                                  01
condominiums, but since 2009, that proportion

                                                                                                                                                20

                                                                                                                                                              20

                                                                                                                                                                             20

                                                                                                                                                                                           20

                                                                                                                                                                                                          20
                                                                                     –2

                                                                                                   –2

                                                                                                                  –2

                                                                                                                                –2
                                                                                     00

                                                                                                 06

                                                                                                                09

                                                                                                                              12
has dropped to 3 percent, partly because

                                                                                 20

                                                                                               20

                                                                                                              20

                                                                                                                            20
purchasing a single-family home is relatively                             Notes: Includes single-family homes, townhomes, and condominiums. Data for 2021 are through March 2021.
                                                                          Sources: U.S. Census Bureau, Building Permits Survey; 2000 through 2020—final data and estimates by the analyst; 2021—preliminary data and
affordable in the HMA. All condominium                                    estimates by the analyst
construction in the HMA has occurred in Greene
and Montgomery Counties since 2000.
                                                                         in Centerville is a planned community with 277 lots. At the community, 238 lots have been sold, and
More than 83 percent of new for-sale home                                39 are available for sale. Homes in the community feature two to seven bedrooms and two to seven
construction since 2012 has occurred in                                  bathrooms. The price of the most recently sold home was $351,500.
Greene and Montgomery Counties. In Greene
County, just east of Wright-Patterson AFB, in                            Housing Affordability
the city of Fairborn is the Waterford Landing                            Homeownership in the HMA is generally affordable, although the affordability of buying a home in the
community, which was established in 2011 and                             HMA has trended downward since the early 2010s (Figure 12), when more REO homes were on the market
has more than 200 completed homes; homes                                 during the foreclosure crisis. Many of those homes have since been sold, putting upward pressure on
sales are currently underway at Phase 9. The                             sales prices despite only moderate income growth. The National Association of Home Builders and Wells
most recent phase includes 37 single-family                              Fargo Housing Opportunity Index (HOI)—which represents the share of homes sold that would have been
residential lots, with three- and four-bedroom                           affordable to a family earning the local median income—for the HMA was 88.8 during the first quarter of
homes starting at $296,990 and $316,490,                                 2021, up from 87.4 during the first quarter of 2020. During the first quarter of 2021, the HMA was more
respectively. Approximately 20 miles southwest,                          affordable than 213, or 90 percent, of the 237 ranked MSAs in the nation. By comparison, the Cincinnati
in Montgomery County, the Trails at Saddle Creek                         and Columbus MSAs were more affordable than 208 and 146 MSAs, respectively. Despite the recent

                                                                                                                                           Comprehensive Housing Market Analysis Dayton, Ohio
                                                                                                            U.S. Department of Housing and Urban Development, Office of Policy Development and Research
Dayton, Ohio Comprehensive Housing Market Analysis as of April 1, 2021                                                                                                                Home Sales Market 16

increase in affordability, the HOI in the HMA                                                                          Figure 12. Dayton HMA Housing Opportunity Index
is below the high of 94.3 reached during the                                                       96
first quarter of 2012, when the HMA was more                                                       94
affordable than 222, or 94 percent, of the ranked

                                                                          NAHB Opportunity Index
                                                                                                   92
MSAs in the nation. From the first quarter of 2012                                                 90
to the first quarter of 2021, median income grew                                                   88
at a slower pace than median home price—up                                                         86
20 and 78 percent, respectively.                                                                   84

Forecast                                                                                           82
                                                                                                   80
During the next 3 years, demand is expected
                                                                                                   78
for an estimated 3,575 new homes in the HMA

                                                                                                      12

                                                                                                                 13

                                                                                                                           14

                                                                                                                                      15

                                                                                                                                                  16

                                                                                                                                                               17

                                                                                                                                                                        18

                                                                                                                                                                                    19

                                                                                                                                                                                               20

                                                                                                                                                                                                          21
(Table 5). Demand is expected to increase slightly

                                                                                                    20

                                                                                                               20

                                                                                                                         20

                                                                                                                                    20

                                                                                                                                                20

                                                                                                                                                             20

                                                                                                                                                                      20

                                                                                                                                                                                  20

                                                                                                                                                                                             20

                                                                                                                                                                                                        20
                                                                                                   1Q

                                                                                                             1Q

                                                                                                                       1Q

                                                                                                                                  1Q

                                                                                                                                              1Q

                                                                                                                                                        1Q

                                                                                                                                                                    1Q

                                                                                                                                                                               1Q

                                                                                                                                                                                          1Q

                                                                                                                                                                                                      1Q
every year of the forecast period. Currently tight
                                                                         NAHB = National Association of Home Builders. 1Q = first quarter.
sales housing market conditions combined with                            Sources: NAHB; Wells Fargo
low mortgage interest rates, continued net in-
migration, and economic recovery will contribute                                                        Table 5. Demand for New Sales Units in the Dayton HMA During the Forecast Period
to increased demand. The 310 homes currently                                                                                                   Sales Units
under construction will satisfy a portion of                                        Demand                                                                                             3,575 Units
                                                                                    Under Construction                                                                                   310 Units
the demand.
                                                                         Note: The forecast period is from April 1, 2021, to April 1, 2024.
                                                                         Source: Estimates by the analyst

                                                                                                                                                   Comprehensive Housing Market Analysis Dayton, Ohio
                                                                                                                       U.S. Department of Housing and Urban Development, Office of Policy Development and Research
Dayton, Ohio Comprehensive Housing Market Analysis as of April 1, 2021                                                                                                             Rental Market 17

Rental Market                                                                                                                                   as of 2019—down from 44 percent during 2013
                                                                                                                                                (ACS 1-year data). In addition, 20 percent of all
Market Conditions: Balanced                                                                                                                     renter households lived in buildings with two to
   Rental construction activity has increased since 2015, but the overall rental vacancy rate and the                                           four units during 2019—unchanged from 2013.
   apartment vacancy rate have declined since 2010, when conditions were soft.                                                                  Multifamily buildings with five or more units,
                                                                                                                                                typically apartments, accounted for 38 percent
Current Conditions and Recent Trends                                                                                                            of all occupied rental units during 2019—up from
The overall rental market in the HMA is balanced, with an estimated 8.2-percent vacancy rate—down                                               36 percent during 2013.
from 12.3 percent in April 2010, when conditions were soft (Table 6). The elevated vacancy rates reflect
the large number of abandoned single-family rental properties that are captured in the available-for-rent
                                                                                                                                                Apartment Market
data. The vacancy rate has declined since 2010, partly due to a shift to net in-migration and a shift from                                      Conditions and Trends
homeownership to renting. More recently, a surge in apartment construction since 2015 and the impact                                            The apartment market in the HMA is tight and
of COVID-19 since early 2020 had minimal impacts on the vacancy rate. The Federal Housing Finance                                               has generally been tightening since 2007,
Agency, which extended the eviction moratorium until September 2021 from rental units with federally                                            when conditions were soft. During the first
backed mortgages, may have partly eased the full impact of the countermeasures used to slow the spread                                          quarter of 2021, the apartment vacancy rate was
of COVID-19. Renter households currently account for 36.3 percent of all households in the HMA—up from                                          3.1 percent, compared with 2.9 percent during
35.1 percent in 2010. Nationally, renter households accounted for 34.6 percent of total households in 2019                                      the first quarter of 2020 (Moody’s Analytics REIS;
(ACS 1-year data). Approximately 42 percent of renter households in the HMA lived in single-family homes                                        Figure 13) and below the 5.4-percent rate for the
                                                                                                                                                nation. The average apartment rent in the HMA
                     Table 6. Rental and Apartment Market Quick Facts in the Dayton HMA                                                         was relatively unchanged—up by $2, or less
                                                                                          2010 (%)                      Current (%)             than 1 percent, to $825 during the first quarter
                                 Rental Vacancy Rate                                        12.3                            8.2                 of 2021 from a year earlier. By comparison, the
                                                                                          2013 (%)                       2019 (%)               average rent decreased 3 percent, to $1,453,
     Rental Market               Occupied Rental Units by Structure                                                                             nationally. From the first quarter of 2000 through
      Quick Facts                  Single-Family Attached & Detached                        43.5                          41.8
                                                                                                                                                the first quarter of 2006, when readily available
                                   Multifamily (2–4 Units)                                  19.6                          20.3
                                   Multifamily (5+ Units)                                   35.8                          37.8                  access to mortgage credit contributed to a higher
                                   Other (Including Mobile Homes)                            0.1                           0.0                  propensity for homeownership, the apartment
                                                                                          1Q 2021                      YoY Change
                                                                                                                                                vacancy rate in the HMA increased from 2.8 to
   Apartment Market              Apartment Vacancy Rate                                       3.1                           0.2                 9.4 percent. With stricter lending standards after
      Quick Facts                Average Rent                                               $825                            0%                  2006, demand for apartments increased despite
 1Q = first quarter. YoY= year-over-year.                                                                                                       continued net out-migration, and the apartment
 Notes: The current date is April 1, 2021. Percentages may not add to 100 due to rounding.
 Sources: 2010 vacancy rate—2010 Census; current vacancy rate—estimate by the analyst; occupied rental units by structure—2010 and 2019
                                                                                                                                                vacancy rate decreased to 6.2 percent by the first
 American Community Survey 1-year data; apartment data—Moody’s Analytics REIS, with adjustments by the analyst                                  quarter of 2012. From the first quarter of 2000

                                                                                                                                          Comprehensive Housing Market Analysis Dayton, Ohio
                                                                                                              U.S. Department of Housing and Urban Development, Office of Policy Development and Research
Dayton, Ohio Comprehensive Housing Market Analysis as of April 1, 2021                                                                                                                Rental Market 18
                                                                                                           Figure 13. Apartment Rents and Vacancy Rates in the Dayton HMA
through the first quarter of 2012, the average                                                                            Average Monthly Rent            Vacancy Rate
rent increased an average of $10, or 2 percent,
                                                                                                     850                                                                                  $825 9.5
annually, to $654. When the sales housing
market began to recover from the housing crisis                                                      800                                                                                        8.5

                                                                          Average Monthly Rent ($)
and net out-migration continued, demand for                                                          750                                                                                        7.5

                                                                                                                                                                                                      Vacancy Rate (%)
apartments decreased slightly, and the apartment
                                                                                                     700                                                                                        6.5
vacancy rate increased to 6.8 percent by the first
quarter of 2014. Although home sales continued                                                       650                                                                                        5.5
to increase and apartment construction began
                                                                                                     600                                                                                        4.5
increasing in 2015, the vacancy rate declined
nearly every year to reach 4.0 percent during                                                        550                                                                                   3.1 3.5

the first quarter of 2019 because of improving                                                       500                                                                                        2.5
economic conditions and net in-migration. From

                                                                                                       1Q 000

                                                                                                       1Q 001

                                                                                                       1Q 002

                                                                                                       1Q 003

                                                                                                       1Q 004

                                                                                                       1Q 005

                                                                                                       1Q 006

                                                                                                       1Q 007

                                                                                                       1Q 008

                                                                                                       1Q 009

                                                                                                       1Q 010

                                                                                                       1Q 011

                                                                                                       1Q 012

                                                                                                       1Q 013

                                                                                                       1Q 014

                                                                                                       1Q 015

                                                                                                       1Q 016

                                                                                                       1Q 017

                                                                                                       1Q 018

                                                                                                       1Q 019

                                                                                                       1Q 020
                                                                                                            21
the first quarter of 2013 through the first quarter

                                                                                                         20
                                                                                                         2

                                                                                                         2

                                                                                                         2

                                                                                                         2

                                                                                                         2

                                                                                                         2

                                                                                                         2

                                                                                                         2

                                                                                                         2

                                                                                                         2

                                                                                                         2

                                                                                                         2

                                                                                                         2

                                                                                                         2

                                                                                                         2

                                                                                                         2

                                                                                                         2

                                                                                                         2

                                                                                                         2

                                                                                                         2

                                                                                                         2
                                                                                                     1Q
of 2019, the average rent increased by an
average of $21, or 3 percent, annually, to $790.                          1Q = first quarter.
                                                                          Source: Moody’s Analytics REIS, with adjustments by the analyst

Apartment Market Conditions                                              and 1 year after the BRAC process began increasing personnel at Wright-Patterson AFB. The rent in the
by Market Area                                                           market area rose an average of 2 percent a year from the first quarter of 2007 through the first quarter of
                                                                         2021, to $881—the second highest rent of the five market areas that constitute the HMA. The highest rent,
Wright-Patterson AFB, the University of Dayton,
                                                                         $890, was in the South market area, where most for-sale housing construction is occurring and where the
and Wright State University—the universities
                                                                         vacancy rate was 3.8 percent—unchanged from the first quarter of 2020.
with the highest enrollment in the HMA—have
significant impacts on the apartment market in                           In the Central Dayton market area, which contains the University of Dayton and downtown Dayton, the
the HMA and the surrounding market areas. In                             vacancy rate declined to 3.9 percent during the first quarter of 2021—down from 4.1 percent during
the Moody’s Analytics REIS-defined Northeast                             the first quarter of 2020 and the lowest vacancy rate since the first quarter of 2000. During the recent
market area, immediately surrounding the AFB                             period, the average rent was relatively unchanged—up $2, or less than 1 percent, to $734. Even though
and Wright State University, the vacancy rate                            the University of Dayton moved to remote learning during the 2020–2021 school year in an effort to
during the first quarter of 2021 was 2.1 percent—                        reduce COVID-19 outbreaks, the decline in the vacancy rate occurred partly because student enrollment
up slightly from 1.7 percent during the first quarter                    has generally increased since 2001. From fall 2001 through fall 2019, enrollment rose by an average of
of 2020. The current rate is down significantly                          70 students, or 0.6 percent, a year, to 11,500 (Integrated Postsecondary Education Data System, with
from the 8.5-percent vacancy rate during the                             adjustments by the analyst), of which nearly one-half lived in off-campus apartments. In addition, the
first quarter of 2006, immediately before sales                          revitalization of downtown Dayton attractions boosted the popularity of urban living in apartments that
housing market conditions began to deteriorate                           were repurposed from warehouses and offices. Revitalization of attractions in the market area included

                                                                                                                                            Comprehensive Housing Market Analysis Dayton, Ohio
                                                                                                                 U.S. Department of Housing and Urban Development, Office of Policy Development and Research
Dayton, Ohio Comprehensive Housing Market Analysis as of April 1, 2021                                                                                                                        Rental Market 19

the completion of the RiverScape MetroPark, a                                                 Figure 14. Average Annual Rental Permitting Activity in the Dayton HMA
park along the Great Miami River, in 2000; the
Fifth Third Field, a baseball field, which opened                          1,600
in 2000; and the Benjamin & Marian Schuster                                1,400
Performing Arts Center, which opened in 2003.                              1,200
Rents in the remaining two market areas, where                             1,000
the least apartment construction has occurred                                800
recently, were the lowest among the five market
                                                                             600
areas that constitute the HMA. During the
first quarter of 2021, rents averaged $716 and                               400

$697, respectively, in the Miami County and the                              200
Northwest market areas—down 1 and 4 percent                                     0
from the previous year. At the same time, the

                                                                                         5

                                                                                                      4

                                                                                                                                                                                            20

                                                                                                                                                                                                           21
                                                                                                                                                                              19
                                                                                                                                  16

                                                                                                                                                               18
                                                                                                                    15

                                                                                                                                                 17
vacancy rates decreased to 2.6 percent from

                                                                                      00

                                                                                                    01

                                                                                                                  20

                                                                                                                                20

                                                                                                                                               20

                                                                                                                                                             20

                                                                                                                                                                            20

                                                                                                                                                                                          20

                                                                                                                                                                                                         20
                                                                                                  –2
                                                                                    –2
                                                                                    00

                                                                                                06
2.8 percent in the Miami County market area and

                                                                                20

                                                                                              20
increased to 1.3 percent from 1.0 percent in the
Northwest market area.                                                    Notes: Includes apartments and units intended for rental occupancy. Data for 2021 are through March 2021.
                                                                          Sources: U.S. Census Bureau, Building Permits Survey; 2000–2020—final data and estimates by the analyst; 2021—preliminary data and estimates
                                                                          by the analyst
Rental Construction Activity
Rental construction, as measured by the
                                                                         migration, production rebounded. From 2015 through 2020, rental construction activity increased to
number of rental units permitted, has been at
                                                                         an average of 910 units annually. During the 12 months ending March 2021, approximately 1,025 rental
an elevated level since 2015 (Figure 14), and
                                                                         units were permitted—up nearly 41 percent from the 12 months ending March 2020 (preliminary data,
the total number of units permitted is only
                                                                         with adjustments by the analyst).
2 percent below the total number of units
permitted during the period from 2000 through                            Recent rental development has been concentrated in Montgomery County, in and around downtown
2014. From 2000 through 2005, an average of                              Dayton, and in Greene County, particularly in Sugarcreek Township (Map 1). In downtown Dayton, across
710 rental units were permitted annually, before                         from the RiverScape MetroPark, one of the largest properties under construction is The Monument
decreasing to an average of 270 units permitted                          apartments. When complete in April 2022, the property will include 125 market-rate units. In addition,
annually from 2006 through 2014, a period that                           the Art Lofts at the Arcade in the newly remodeled Dayton Arcade—a nine-building property with work
included weak economic conditions and net out-                           spaces, shopping, and event space in downtown Dayton—is expected to be completed in June 2021; the
migration. By 2015, when economic conditions                             Dayton Arcade will reopen after 30 years of being closed. Art Lofts will feature 103 affordable units and
had improved for a few years and population                              7 market-rate units oriented toward artists, with rents ranging from $748 to $930 for one-bedroom units
growth accelerated because of a shift to net in-                         and from $878 to $1,080 for two-bedroom units. The growing aging population has also affected the

                                                                                                                                           Comprehensive Housing Market Analysis Dayton, Ohio
                                                                                                           U.S. Department of Housing and Urban Development, Office of Policy Development and Research
Dayton, Ohio Comprehensive Housing Market Analysis as of April 1, 2021                                                                                                           Rental Market 20

                                                                                                        Map 1. Completed Projects in the Dayton HMA since 2010
rental market, and 30 percent of units under
construction are senior housing. In Sugarcreek
Township, Dogwood Commons will feature 55
apartment units for residents age 55 and older
when it opens in August 2021. Approximately
1 mile north, 224 independent-living, assisted-
living, and memory-care units are underway at
The Grand of Sugarcreek, which is expected to
open in November 2021.

Housing Affordability: Rental
The rental market in the HMA has become more
affordable since 2015 despite a decrease in
affordability in 2016, when rent growth outpaced
income growth. From 2015 to 2019, the median
income for renter households rose 28 percent,
from $26,856 in 2015 to $34,209 in 2019. During
the same time, the median gross monthly rent
increased 8 percent, from $754 to $812. As a
result, the HUD Rental Affordability Index, a
measure of median renter household income
relative to qualifying income for the median-
priced rental unit, trended upward (Figure 15).
The index was 105.3 during 2019—up from 89.0
in 2014.

Renter Cost Burdens
During the 2013-through-2017 period, an estimated
20.2 percent of all renter households in the
                                                                          Source: McGraw-Hill Construction Pipeline database, with adjustments by the analyst
HMA were cost burdened and 21.0 percent were
severely cost burdened, spending 50 percent                              of renter households were cost-burdened and severely cost-burdened, respectively. Cost-burden is a
or more of their income on rent (Table 7). By                            more significant issue for lower-income renter households in the HMA. Of renter households with incomes
comparison, nationwide, 21.8 and 22.9 percent                            less than 50 percent of the area median family income in the HMA, 28.0 percent paid between 30 and

                                                                                                                                             Comprehensive Housing Market Analysis Dayton, Ohio
                                                                                                            U.S. Department of Housing and Urban Development, Office of Policy Development and Research
You can also read