BUSINESS FORECAST San Joaquin Valley - Emerging Trends in the Valley's Economy - California State University Stanislaus
←
→
Page content transcription
If your browser does not render page correctly, please read the page content below
2021
                            VOL XI | ISS 1

 San Joaquin Valley

BUSINESS
FORECAST
   Emerging Trends in the
     Valley’s Economy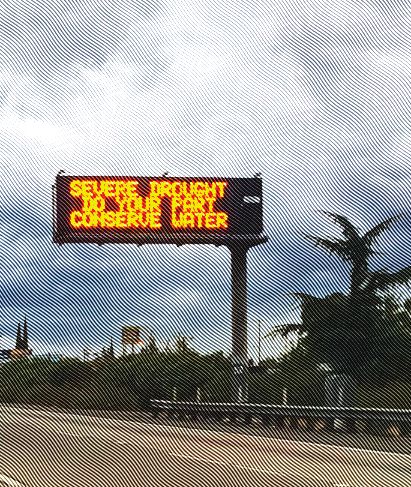
Table of Contents

                            Contributors ............................................................................................................................ 3

                            Executive Summary .............................................................................................................. 4

                            Introduction ............................................................................................................................ 5

                            Employment Indicators........................................................................................................ 6

                            Housing Sector ......................................................................................................................16

                            Inflation and Prices...............................................................................................................18

                            Banking and Capital Markets ...........................................................................................20

                            Concluding Remarks .......................................................................................................... 22

                 SAN JOAQUIN VALLEY BUSINESS FORECAST 2022
                  Volume XI, Issue 1                 We wish to thank Foster Farms
                 csustan.edu/sjvbf                   for generously providing the
                                                     endowment for this project.
                 Gökçe Soydemir, Ph.D.
                 Stanislaus State
                 One University Circle
                 Turlock, CA 95382

2 | Stanislaus State
Contributors

                                                                                                               College of Business
Faculty                                                                                                        Administration Staff

Gökçe                    Tomas              Annhenrie             David                Katrina Kidd            Diamelle Abalos           Carmen Garcia
Soydemir, Ph.D.          Gomez-Arias, Ph.D. Campbell, Ph.D.       Lindsay, Ph.D.       Director, MBA Programs Administrative Support     Administrative Analyst
Foster Farms Endowed     Dean, College      Professor,            Professor,                                  Coordinator
Professor of Business    of Business        Accounting and        Accounting
Economics                Administration     Finance               and Finance

Student Assistants                          Communications and Public Affairs

Abdulla                 David Yohanan       Rosalee Rush          Kristina Stamper     Steve Caballero         Mandeep Khaira           Katie Dowling
Mammadsoy                                   Senior Associate      Director for         Senior Graphic          Senior Web and           Graphic Designer
                                            Vice President for    Communications and   Designer                Electronic
                                            Communications,       Creative Services                            Communications
                                            Marketing and Media                                                Developer
                                            Relations

                                                                                                 San Joaquin Valley Business Forecast, 2022 | Volume XI • Issue 1 | 3
Executive Summary
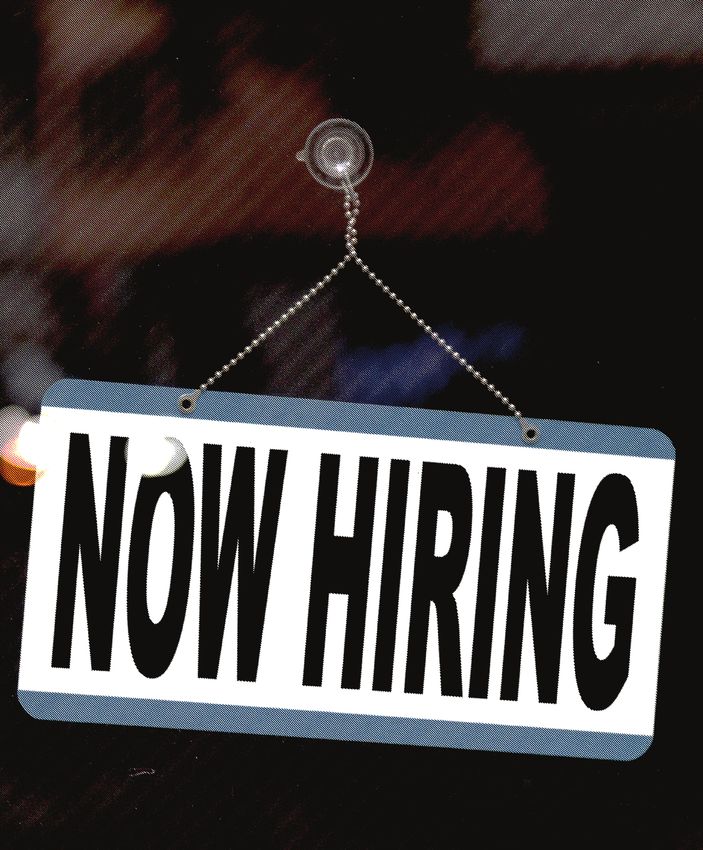
With the seeking of emergency authorization for of 3.01 percent in 2020. Despite an increase in employment
COVID-19 oral medications, and with vaccine booster growth projections for 2022, changing policy variables
shots now being widely administered, key economic should compel employment levels to grow at a much slower
indicators - including falling interest rates, easy monetary rate in 2023.
policy, and low tax rates - are beginning to reverse Valley building permits increased at a phenomenal rate of
course. Though the Federal Reserve announced no rate hikes 35.65 percent in 2021. This is similar to the pace observed
for 2022, long-term rates have begun to rise. In addition, in 2018 and it reflects the supply side trying to catch up
home values in the Valley registered a whopping 14.43 with the excess demand caused by a shortage of inventory.
percent increase in the second quarter of 2021. Given the Because of the extension of the Biden administration’s
structurally disadvantaged position of our region’s economy relief package and the Federal Reserve’s continued deployed
and the ongoing drought, the consequent combined impact tools to mitigate the negative effects of the pandemic, there
on the Valley most certainly will were basically no foreclosures in
be disproportionate to the rest of 2021 - similar to 2020. Freddie Mac
the country. The data suggests no 30-year rates continued to fall in
immediate downturn in economic the third quarter of 2021, after the
activity, but it is important to Federal Reserve's signal of no rate
note that the future course of the hikes through 2022. Because of the
economy will very much depend rising price of oil and wages along
on how fast and how high interest with increased demand and liquidity
rates rise. A sudden panic of injection, the yearly inflation rate
homeowners rushing to sell all increased very significantly in 2021
at once may bring about a sudden and is likely to stay high through
correction in the housing market, the first quarter of 2022. Home
which would greatly impact values continued to increase in
the Valley. 2020, registering a 5.42 percent
Every category of employment in average yearly increase – outpacing
the Valley continued to recover the long-term benchmark growth of
with the exception of government 5.07 percent. The increase in home
employment, which posted the values was much greater in 2021
same decline as in the previous than 2020 but some of it was due to
year - 3.91 percent in 2020 and inflation. Controlling for inflation,
3.92 percent in 2021. Despite real growth in home values was a bit
recovering from the previous lower, yet still very significant. Home
year, a few categories continued values are expected to grow at much
to post declining rates, albeit at slower rates in the coming months,
slower paces. Farm-related Valley particularly in real terms. As in the
wholesale trade employment, case of the previous housing crisis of
negatively affected by the drought, 2008, an increase in interest rates to
declined at an average yearly rate of 1.13 percent in 2021, very high levels and at very fast rates may very well mean
less than the 2020 decline of 4.75 percent. Education and another correction. Homeowners looking at nominal growth
health services employment declined at a slower rate of 0.16 rates may panic and try to sell all at once in an attempt to
percent in 2021, compared to 0.76 percent decline in 2020. take advantage of home value appreciations, triggering a
Another category of employment that declined less than the another significant correction in the housing market. It is
previous year was financial activities employment, which therefore important to watch the rate of increase in the
posted a decline of 4.09 percent in 2020 and 2.43 percent Federal Funds rate along with the pace of change in home
in 2021. Structurally problematic information employment values closely as we move forward.
declined 9.12 percent in 2021, still notably less than the To fight the negative effects of the pandemic, tremendous
19.06 percent decline in 2020. liquidity was injected into the economy both in 2021 and
Retail trade, at an average annual rate of 5.93 percent, 2020. However, the Federal Reserve clearly signal that
was the fastest-growing category of employment in 2021, tapering began in November. Liquidity injection was an
followed by trade, transportation and utilities employment important factor behind the very high inflation rates of the
growing at 5.56 percent. The third-fastest was leisure and past two quarters. Another reason was wage inflation, a
hospitality services employment, posting 4.62 percent result of a labor shortage that pressured employers to create
growth in 2021. Manufacturing employment grew 2.05 monetary incentives for people to return to work. The rise in
percent in 2021, its fastest pace since 2015. Among the labor costs was passed on to consumers in the form of higher
categories that switched from negative to positive territory, prices for goods and services.
Valley construction employment grew the slowest at 1.99
percent in 2021, still a significant jump back from a decline
4 | Stanislaus State
Introduction

Average weekly wages rose 4.93             This report examines data from January 2001 to October 2021. Two-
percent in 2021, still very fast but       year medium-term forecasts are from November 2021 to December
not as fast as the rate observed in        2023. Forecasting a range rather than a point provides a more realistic
2020 at 8.48 percent, the fastest          assessment of likely future values. When actual numbers fall within the
increase since the report began            upper and lower forecast bands, the forecast becomes accurate.
tracking this indicator. Bottlenecks       The remainder of this report is structured as follows: labor market
in supply chain as a cost-push factor      conditions for the San Joaquin Valley; a look at the real estate market in
was another main cause of high             the eight metropolitan statistical areas of the Valley; a discussion of prices
inflation. The average yearly inflation    and inflation; an examination of indicators from local banking and capital
rate during 2021 was 3.66 percent,         markets; and a conclusion.
corresponding to a real wage increase
of 1.27 percent.
President Biden’s stimulus plan and
the Federal Reserve’s continued
intervention again spurred bank
activity in 2021. Valley total deposits
grew 25.71 percent in 2021, which
was a faster rate than the 21.19
percent rate observed in 2020 and                                              San Joaquin Valley
just shy of three times the long-term
benchmark rate of 8.68 percent.
Net loans and leases grew 11.36           San Joaquin
percent in 2021, slower than the
                                                                                                                 Madera
17.63 percent growth in 2020. Valley
net loans growth fell significantly
below the rate of growth in bank
deposits, indicating the community
                                                    Merced                                                              Fresno
banks did not extend loans as they
did in pre-pandemic years. Valley
bank non-accruals began to trend
more significantly upward, relative
to 2020, creating a serious concern                                                                                            Tulare
for the coming months. Community
bank assets in default 30-to-89 days
and assets in default 90-plus days                              Kings
also displayed a steepening trend
as banks continued to keep a tab on
unpaid loans. As relief programs such
as eviction moratoriums end, non-                                                                                                         Kern
accruals are projected to rise much
faster in the coming months. Data
does not point to any immediate
significant downturn in economic
activity, but rising yields, Federal
Reserve tapering, steep increases
in home values and tax increases
may be triggers of an oncoming
correction. As a precaution, Valley
residents and business should
consider refinancing while interest
rates are still low, moving into rental
property, reducing leverage and
increasing cash holdings.

                                                                            San Joaquin Valley Business Forecast, 2021 | Volume XI • Issue 1 | 5
Employment Indicators
Total employment grew in all counties Total Employment
except Kings County in 2021. However,
1,900,000
Kings County is on the way to posting
significantly positive average yearly growth 1,800,000
numbers beginning from December 2021
Number of Employees
as the incoming growth numbers begin to 1,700,000
outweigh the negative rates reported earlier
1,600,000
in the year. Merced County total employment
grew 3.56 percent, the fastest among the 1,500,000
eight counties of the San Joaquin Valley.
Stanislaus County total employment grew the 1,400,000
third fastest at 3.04 percent. Fresno County
grew 1.98 percent, followed by Kern County 1,300,000
2003M09
2006M05
2008M05
2004M05
2005M09
2009M09
2002M05
2020M05
2023M09
2022M05
2007M09
2003M01
2005M01
2010M05
2001M09
2009M01
2013M09
2016M05
2018M05
2014M05
2015M09
2023M01
2019M09
2012M05
2021M09
2007M01
2017M09
at 1.84 percent. Tulare County reported 1.48
2001M01
2013M01
2015M01
2011M09
2019M01
2021M01
2017M01
2011M01
percent growth in 2021. Growth numbers for
all counties switched from declining rates
Months
in the negative territory to growing in the
positive territory beginning in April 2021, Actual Projected
and employment levels have been growing
steadily since then. Overshooting followed by
undershooting is a regular phenomenon of Financial activities employment was yet another category that
any series trying to find steady rate of growth declined less in 2021, at 2.43 percent, than in 2020, at 4.09 percent.
following a significant economic impact.
Average yearly growth in Valley total employment grew 3.84 percent
in 2021. Valley total employment will likely continue to stay below
MERCED COUNTY TOTAL EMPLOYMENT GREW 1,800,000 through 2023. Projections point to an average growth of
3.56%
3.51 percent in 2022 and slower growth of 0.88 percent in 2023 as
several policy variables are expected to reverse course.
Total Employment:
Historical vs. Projected Average Yearly Growth
6.00%
4.16%
Average Percentage Change
4.00% 3.51%
2.86%
All categories of employment, with the 2.00% 1.47%
0.88%
exception of government employment, are 0.85% 1.11% 3.84% 0.29%
0.00%
clearly in recovery phases but some have
not yet begun to report positive growth. The -2.00%
historically problematic sector of information
-4.00%
employment reported a decline of 9.12 percent
in 2021, but even this was an improvement -6.00%
over the faster decline of 19.06 percent -6.85%
-8.00%
during the worst months of the pandemic in Sample 2019 2020 2021 2022 2023
2020. Government employment declined at Average Average Average Average Forecast Forecast
a near-identical rate in 2021 at 3.92 percent Actual Optimistic Most Likely Pessimistic
as it did in 2020 at 3.91 percent. A few other
categories continued to post declining rates,
albeit slower than the previous year. Farm-
related Valley wholesale trade employment,
negatively affected by the drought, declined at
an average yearly rate of 1.13 percent in 2021,
slower than the 4.75 percent decline in 2020.
Education and health services employment
declined at a slower rate of 0.16 percent in
2021 compared to a 0.76 percent decline
in 2020.
6 | Stanislaus State
The Consumer Confidence Index, an Consumer Confidence Index
important leading indicator of upcoming
economic activity, has continuously 160
displayed an increasing pattern since the 140
fourth quarter of 2020 and now appears 120
to have stabilized around a value of 120.
Index Value
100
As the Covid-19 pill becomes publicly
available in the second half of 2022, 80
confidence in consumer spending should 60
continue to rise. 40
With the pandemic recovery taking hold, 20
labor force and employment growth
0
both are in positive territory. However,
9/1/2000
9/1/2003
9/1/2006
9/1/2008
9/1/2005
9/1/2004
9/1/2009
9/1/2002
9/1/2020
9/1/2007
9/1/2001
9/1/2010
9/1/2013
9/1/1993
9/1/2016
9/1/2018
9/1/1996
9/1/1998
9/1/2015
9/1/1995
9/1/2014
9/1/2019
9/1/1994
9/1/1999
9/1/2012
9/1/1992
9/1/2017
9/1/1997
9/1/2011
labor force growth lags significantly
behind employment growth due to
low labor force participation rates. A
similar pattern, at a much-lower scale, of Months
employment growth exceeding labor force Conference Board
growth was observed at the end of the
2008 recession. The tendency to switch Labor Force vs. Employment Growth
directions in both series is now acting as
a new leading indicator for our region. 15
Percentage Change from Previous Year
12
ALL CATEGORIES OF
9
6
EMPLOYMENT, WITH THE 3
EXCEPTION OF GOVERNMENT 0
EMPLOYMENT, ARE CLEARLY -3
-6
IN RECOVERY PHASES BUT -9
SOME HAVE NOT YET BEGUN TO -12
REPORT POSITIVE GROWTH. -15
-18
2003M03
2008M06
2006M09
2009M08
2004M05
2002M08
2006M02
2020M09
2020M02
2005M07
2007M04
2003M10
2010M03
2009M01
2013M09
2016M08
2015M06
2018M05
2002M01
2013M02
2014M04
2004M12
2021M04
2017M03
2019M07
2012M07
2010M10
2016M01
2011M05
2018M12
2007M11
2017M10
2014M11
2011M12
Just as in the in 2008 recession, statewide
employment growth fell below the
employment growth of the Valley during Months
the pandemic. But with the recovery Labor Force Employment
well underway, employment growth
of the state now exceeds the Valley Employment Growth: State vs. San Joaquin Valley
employment growth. This pattern during
the recovery is different than the pattern
observed after the 2008 recession, 12.00%
Annual Percentage Change
perhaps reflecting the negative effects
7.00%
of the ongoing drought impacting the
Valley to a greater degree than the rest 2.00%
of the state.
-3.00%
-8.00%
-13.00%
-18.00%
2003M07
2006M07
2008M07
2005M07
2004M07
2009M07
2002M07
2020M07
2007M07
2003M01
2006M01
2008M01
2005M01
2004M01
2009M01
2002M01
2020M01
2007M01
2010M07
2013M07
2016M07
2018M07
2015M07
2014M07
2019M07
2012M07
2021M07
2017M07
2010M01
2013M01
2016M01
2018M01
2015M01
2014M01
2019M01
2012M01
2021M01
2011M07
2017M01
2011M01
Months
Valley State
San Joaquin
San Joaquin
Valley Valley
Business
Business
Forecast
Forecast,
Report,2021
2021| Volume
| VolumeXIXI• •Issue
Issue1 1| | 7
Employment Indicators
Following the sudden pandemic-related U.S. Real GDP Annual Growth
decline of more than 30 percent, real 40.0
gross domestic product overshot the
mean at the start of the recovery, then 30.0
quickly rebounded at roughly the same 20.0
rate. The latest growth numbers point
Percentage Change
to a pattern of return to the steady state 10.0
growth of about 3 percent. With the 0.0
recovery taking hold in 2021, real GDP
is projected to grow at 2.65 percent in -10.0
2022 and at a significantly slower rate of -20.0
0.51 percent in 2023 as the impact from
-30.0
reversing course begins to intensify.
-40.0
AT THE CURRENT PACE OF
2000q1
2003q1
2006q1
2008q1
2005q1
2004q1
2009q1
2002q1
2020q1
2023q1
2022q1
2007q1
2001q1
2010q1
2013q1
2016q1
2018q1
2015q1
2014q1
2019q1
2012q1
2021q1
2017q1
2011q1
RECOVERY, EMPLOYMENT Quarters
LEVELS IN EDUCATION AND Actual Projected
HEALTH SERVICES ARE
PROJECTED TO EXCEED Education and Health Services Employment
235,000 BY THE END OF 2023. 255,000
235,000
Noteworthy is the negative projected real
Number of Employees
GDP growth of the lower bound around 215,000
the end of the first quarter of 2023. Even 195,000
though there are no immediate signs, a
series of quick rate hikes that reach 175,000
above a 6 percent threshold may trigger 155,000
a housing correction led by a panic of
135,000
homeowners rushing to sell all at once.
115,000
Education and health services employment
2003M09
2006M05
2008M05
2004M05
2005M09
2009M09
2002M05
2020M05
2023M09
2022M05
2007M09
2003M01
2005M01
2010M05
2001M09
2009M01
2013M09
2016M05
2018M05
2014M05
2015M09
reported a decline of 0.16 percent in
2023M01
2019M09
2012M05
2021M09
2007M01
2017M09
2001M01
2013M01
2015M01
2011M09
2019M01
2021M01
2017M01
2011M01
2021, but the decline was slower than the
previous year’s decline of 0.79 percent.
Delays in school openings and unrelated Months
healthcare centers undoubtedly had an
impact on the relatively slower recovery Actual Projected
in this category.
At the current pace of recovery, Education and Health Services Employment:
employment levels in education and Historical vs. Projected Average Yearly Growth
health services are projected to exceed
235,000 by the end of 2023. Projections
Average Percentage Growth
5.00%
point to a switch from negative to
positive territory and faster growth in the 4.00%
coming months. As the Valley’s economy 3.00%
continues to recover, employment in this 2.00%
1.46% 1.29%
1.22% 1.07%
category is expected grow at an average 1.00%
0.98% 0.84%
yearly rate of 1.22 percent in 2022 before 3.22% 4.05%
slowing to 1.07 percent in 2023. 0.00%
-0.79% -0.16%
-1.00%
-2.00%
Sample 2019 2020 2021 2022 2023
Average Average Average Average Forecast Forecast
Actual Optimistic Most Likely Pessimistic
8 | Stanislaus State
Valley manufacturing employment Manufacturing Employment
grew 2.05 percent in 2021, a significant
130,000
improvement over the decline of 2.04
percent in 2020. At this new pace, the 125,000
seasonal spike level of manufacturing
Number of Employees
120,000
employment will likely exceed 115,000
by the end of 2023. The manufacturing 115,000
employment long-term benchmark 110,000
growth rate remains in positive territory
105,000
as the recovery of the Valley economy
intensifies in 2021. 100,000
95,000
2.05 %
VALLEY MANUFACTURING EMPLOYMENT GREW 90,000
2003M04
2006M04
2009M04
2008M07
2005M07
2002M07
2020M07
2023M07
2004M01
2004M10
2018M04
2015M04
2012M04
2021M04
2022M01
2022M10
2007M01
2007M10
2014M07
2017M07
2001M01
2001M10
2010M01
2010M10
2013M01
2013M10
2016M01
2016M10
2019M01
2019M10
2011M07
Months
Actual Projected
IN 2021 2.50%
Manufacturing Employment:
Historical vs. Projected Average Yearly Growth
Manufacturing employment in the state
Average Percentage Change
and nation had been struggling before 2.00%
1.20%
the pandemic, just as it did in the Valley. 1.50% 0.96%
1.00% 0.71%
With the new infrastructure plan taking 0.43%
0.50% 0.19%
hold, the effect of new investments is 0.00%
0.12% 0.25% 2.05% -0.04%
expected to contribute to faster growth -0.50%
in this category. Projections point to an -1.00%
average annual increase of 0.96 percent in -1.50%
2022 and 0.19 percent in 2023. -2.00%
-2.04%
-2.50%
The Institute of Supply Management’s Sample 2019 2020 2021 2022 2023
Average Average Average Average Forecast Forecast
Purchasing Managers Index reached an
all-time high value of 65 in March 2021. Actual Optimistic Most Likely Pessimistic
Since then, the index appears to have
reverted to its mean, reflecting the strong
confidence of consumers, who now can Purchasing Managers Index
make plans into the future - as opposed
the months when the effects of the 70
pandemic were worse. The index value is
65
now around 60, with any value above 50
considered a signal of expansion. 60
Index Value
55
50
45
40
35
30
Jan-03
Jan-06
Jan-08
Jan-05
Jan-04
Jan-09
Jan-02
Jan-20
Jan-07
Jul-03
Jul-06
Jul-08
Jul-05
Jul-04
Jul-09
Jan-01
Jan-10
Jan-13
Jul-02
Jul-20
Jan-16
Jan-18
Jan-15
Jan-14
Jan-19
Jan-12
Jan-21
Jul-07
Jan-17
Jul-01
Jul-10
Jul-13
Jul-16
Jul-18
Jul-15
Jul-14
Jul-19
Jan-11
Jul-12
Jul-21
Jul-17
Jul-11
Months
Institute of Supply Management
San Joaquin Valley Business Forecast, 2021 | Volume XI • Issue 1 | 9
Employment Indicators
Leisure and hospitality services employment Leisure and Hospitality Services Employment
has been one of the worst-affected
155,000
categories of employment during the
pandemic because of the dominance of 145,000
unskilled workers earning minimum wage.
Number of Employees
135,000
Leisure and hospitality services employment 125,000
grew 4.62 percent in 2021, a very significant
115,000
improvement after falling 17.18 percent in
2020. Employment levels are expected to 105,000
exceed 125,000 by the end of 2023, but the 95,000
discrepancy resulting from the pandemic most 85,000
likely will continue beyond 2023.
75,000
65,000
2003M04
2006M04
2009M04
2008M07
2005M07
2002M07
2020M07
2023M07
2004M01
2004M10
2018M04
2015M04
2012M04
2021M04
2022M01
2022M10
2007M01
2007M10
2014M07
2017M07
2001M01
2001M10
2010M01
2010M10
2013M01
2013M10
2016M01
2016M10
2019M01
2019M10
2011M07
Months
Actual Projected
Leisure and Hospitality Services Employment:
Historical vs. Projected Average Yearly Growth
15.00%
LEISURE AND HOSPITALITY 10.00%
11.04%
9.57%
8.09%
SERVICES EMPLOYMENT GREW
Annual Growth
5.00% 3.64%
4.62 PERCENT IN 2021
2.34%
1.42% 2.51% 4.62% 1.03%
0.00%
-5.00%
The long-term benchmark growth rate for -10.00%
leisure and hospitality services employment
increased to 1.42 percent after factoring in the -15.00%
-17.18%
growth in 2021. The remaining discrepancy -20.00%
in employment levels will likely be around Sample 2019 2020 2021 2022 2023
Average Average Average Average Forecast Forecast
5,000 by the end of 2021, which still would
be a significant improvement. In this category Actual Optimistic Most Likely Pessimistic
alone, about 30,000 workers were laid off in
2020. Projections point to an average annual Trade, Transportation and Utilities Employment
growth of 9.57 percent in 2022 and 2.34
percent in 2023. 330,000
The only category to post growth during the 310,000
worst months of the pandemic was trade,
transportation and utilities employment. In
Number of Employees
290,000
2021, the growth intensified to 5.56 percent,
becoming one of the fastest-growing categories 270,000
of employment in the Valley. Further, this
250,000
category of employment was the quickest
to recover, exceeding the pace of growth in 230,000
construction employment. At this rate, and
with supply chain issues, trade, transportation 210,000
and utilities employment is projected to exceed
310,000 by the of 2023. 190,000
2003M04
2006M04
2009M04
2008M07
2005M07
2002M07
2020M07
2023M07
2004M01
2004M10
2018M04
2015M04
2012M04
2021M04
2022M01
2022M10
2007M01
2007M10
2014M07
2017M07
2001M01
2001M10
2010M01
2010M10
2013M01
2013M10
2016M01
2016M10
2019M01
2019M10
2011M07
Months
Actual Projected
10 | Stanislaus StateTrade, transportation and utilities is an Trade, Transportation and Utilities Employment:
essential sector when explaining the fast Historical vs. Projected Average Yearly Growth
rebound from the pandemic. In particular,
this was the only category that could not 6.00% 5.56%
switch to remote work environments, 5.00%
since goods had to be physically
Average Growth
transported from one location to other, 4.00%
especially as consumers switched to
3.00% 2.51%
online purchasing. A shortage of truck 2.32% 2.03%
drivers and other logistical issues has 2.12% 1.79%
2.00% 1.83% 1.56%
created bottlenecks that will last well into 1.21%
2022. Trade, transportation and utilities 1.00%
0.48%
employment is projected to grow at an
0.00%
average yearly rate of 2.32 percent in Sample 2019 2020 2021 2022 2023
2022 and slow to a 1.79 percent growth Average Average Average Average Forecast Forecast
in 2023. Actual Optimistic Most Likely Pessimistic
TRADE, TRANSPORTATION Retail Trade Employment
AND UTILITIES IS AN ESSENTIAL 190,000
SECTOR WHEN EXPLAINING THE 180,000
FAST REBOUND FROM
Number of Employees
170,000
THE PANDEMIC.
160,000
150,000
140,000
130,000
Retail trade employment suffered a huge
loss during the worst months of the 120,000
pandemic, but the 5.93 percent comeback 110,000
in 2021 was the fastest among all 100,000
categories. Employment in this category
2003M04
2006M04
2009M04
2008M07
2005M07
2002M07
2020M07
2023M07
2004M01
2004M10
2018M04
2015M04
2012M04
2021M04
2022M01
2022M10
2007M01
2007M10
2014M07
2017M07
2001M01
2001M10
2010M01
2010M10
2013M01
2013M10
2016M01
2016M10
2019M01
2019M10
2011M07
is expected to exceed 160,000 by the end
of 2023. Initially, retail trade employment
was slow to recover from the pandemic Months
but in 2021 pace of growth picked up very
significantly, even surpassing the growth Actual Projected
rates observed in strong categories
such as trade, transportation and Retail Trade Employment:
utilities employment and construction Historical vs. Projected Average Yearly Growth
employment.
8.00%
The long-term benchmark growth
increased to 0.81 percent on momentum 6.00%
5.93%
created by the strong growth rates in
2021. However, competition from online 4.00% 2.80%
Annual Growth
shopping continues to hurt retail trade 2.30%
1.81% 1.48%
2.00% 0.99%
employment in the Valley. Factoring the 0.49%
impact of online shopping, projections 0.00%
0.81%
point to 2.30 percent growth in 2022 -1.41%
and 0.99 percent in 2023 as the effects of -2.00%
tapering and rate increases take their toll
-4.00% -4.01%
on consumer spending.
-6.00%
Sample 2019 2020 2021 2022 2023
Average Average Average Average Forecast Forecast
Actual Optimistic Most Likely Pessimistic
San Joaquin Valley Business Forecast, 2021 | Volume XI • Issue 1 | 11Employment Indicators
Worsening drought conditions took a toll Wholesale Trade Employment
on wholesale trade employment in 2021,
50,000
causing it to perform below retail trade
employment. To fight the adverse effects of 48,000
drought and climate change the Valley must 46,000
Number of Employees
increase its water storage to make the region 44,000
more resilient to longer-lasting droughts. 42,000
Given these ongoing drought conditions, 40,000
employment levels in the category are 38,000
expected to stay below 47,000 through
36,000
the end of 2023.
34,000
32,000
THE DECLINE IN INFORMATION 30,000
9.12%
EMPLOYMENT IN 2021 WAS
2003M04
2006M04
2009M04
2008M07
2005M07
2002M07
2020M07
2023M07
2004M01
2004M10
2018M04
2015M04
2012M04
2021M04
2022M01
2022M10
2007M01
2007M10
2014M07
2017M07
2001M01
2001M10
2010M01
2010M10
2013M01
2013M10
2016M01
2016M10
2019M01
2019M10
2011M07
Months
Actual Projected
Wholesale Trade Employment:
Historical vs. Projected Average Yearly Growth
Primarily because of the drought and the
pandemic, the seasonal pattern observed 3.00%
1.79%
in prior years was not observed in 2021. 2.00% 1.48%
1.28% 1.18% 1.01%
0.65%
Wholesale trade employment in the Valley 1.00%
Annual Growth
0.01% 0.29%
declined by 1.13 percent, a slower decline 0.00%
-1.13%
when compared to the 4.75 percent drop -1.00%
in 2020. Projections point to 1.48 percent -2.00%
growth in 2022 and 0.65 percent growth in -3.00%
2023. Because of the drought, however, the -4.00%
-4.75%
discrepancy of about 2,000 workers will likely -5.00%
not disappear during the forecast interval. -6.00%
Sample 2019 2020 2021 2022 2023
Average Average Average Average Forecast Forecast
Information employment nationally, statewide
and in the Valley had been declining long Actual Optimistic Most Likely Pessimistic
before the pandemic. The use of social
media and consumers’ changing digital
media preferences are the main causes of Information Employment
this decline. The decline in information
employment in 2021 was 9.12 percent, 18,500
compared to 19.06 percent the previous year. 16,500
Number of Employees
The decline slowed in 2021 but was roughly
twice the rate observed in 2019. Employment 14,500
levels in this category will likely stay below 12,500
8,500 through the end of 2023.
10,500
8,500
6,500
4,500
2003M05
2008M08
2005M08
2006M05
2009M05
2002M08
2020M08
2023M08
2004M02
2022M02
2007M02
2018M05
2015M05
2014M08
2010M02
2013M02
2016M02
2012M05
2021M05
2019M02
2017M08
2001M01
2011M08
2004M11
2022M11
2007M11
2001M11
2010M11
2013M11
2016M11
2019M11
Months
Actual Projected
12 | Stanislaus StateThe long-term benchmark decline fell Information Employment:
further, to 3.35 percent, or about one- Historical vs. Projected Average Yearly Growth
third of the decline in 2021. Because the 10.00%
declines in 2020 and 2021 were extreme 4.58% 3.05%
– multifold of the long-term benchmark 5.00% 3.20% 1.66%
1.82% 0.28%
rate – a switch from negative to positive 0.00%
Annual Growth
territory is expected in the coming -3.35%
-5.00% -4.24%
months. Projections point to average
yearly growth of 3.20 percent in 2022 -10.00% -9.12%
and 1.66 percent in 2023. Given the
-15.00%
historical declining pattern prevailing
since 2008, the growth in 2023 might -20.00% -19.06%
very well occur closer to the lower
-25.00%
bound of 0.28 percent. Sample 2019 2020 2021 2022 2023
Average Average Average Average Forecast Forecast
Construction employment bounced
back quickly in the initial stages of the Actual Optimistic Most Likely Pessimistic
pandemic, but in later months grew at
rates more in line with the long-term
benchmark rate. Employment in this
category grew 1.99 percent in 2021, Construction Employment
rebounding from a 3.01 percent decline
in 2020. Increased construction activity 95,000
is easily visible to the eye in the Valley.
85,000
However, the inventory shortage is
Number of Employees
likely to last for some time, as the
75,000
number of homes being built in the
Valley is not close to what is necessary 65,000
to satisfy the demand.
55,000
THE HUGE SPIKE IN BUILDING 45,000
PERMITS IN 2021 SERVES AS 35,000
A LEADING INDICATOR THAT
2008M04
2005M04
2002M04
2020M04
2023M04
2004M07
2022M07
2007M07
2003M01
2003M10
2006M01
2006M10
2009M01
2009M10
2014M04
2001M07
2010M07
2013M07
2016M07
2017M04
2019M07
2018M01
2018M10
2015M01
2015M10
2011M04
2012M01
2012M10
2021M01
2021M10
MORE HOMES WILL BE BUILT. Months
Low interest rates were another factor Actual Projected
contributing to increased demand
for housing in the Valley, as was an
emerging trend – Bay Area residents Construction Employment:
relocating to more sparsely populated Historical vs. Projected Average Yearly Growth
areas. The huge spike in building
permits in 2021 serves as a leading 4.00%
3.25%
indicator that more homes will be built. 3.00% 2.57%
2.82%
2.40%
Projections point to an average annual 2.00% 1.99% 1.71%
Annual Growth
growth of 2.82 percent in 2022, then a 1.23%
1.00% 0.92% 0.76%
fall to 1.23 percent in 2023 as tapering
and rising rates begin to take effect. 0.00%
-1.00%
-2.00%
-3.00%
-3.01%
-4.00%
Sample 2019 2020 2021 2022 2023
Average Average Average Average Forecast Forecast
Actual Optimistic Most Likely Pessimistic
San Joaquin Valley Business Forecast, 2021 | Volume XI • Issue 1 | 13Employment Indicators
Government employment was the only Government Employment
category of employment that did not
325,000
improve from the previous year, declining
315,000
3.92 percent in 2021 – nearly matching the
3.91 percent decline observed in 2020. 305,000
Number of Employees
Recovery in this category comes with 295,000
a lag, as it did during the 2008 recession. 285,000
During a contractionary phase, the decline 275,000
in this category also comes at a later stage
265,000
than the declines in all other categories
of employment. 255,000
245,000
NOT COUNTING THE SEASONAL UPS AND 235,000
2003M04
2006M04
2009M04
2008M07
2005M07
2002M07
2020M07
2023M07
2004M01
2004M10
2018M04
2015M04
2012M04
2021M04
2022M01
2022M10
2007M01
2007M10
2014M07
2017M07
2001M01
2001M10
2010M01
2010M10
2013M01
2013M10
2016M01
2016M10
2019M01
2019M10
2011M07
DOWNS, GOVERNMENT EMPLOYMENT LEVELS
WILL LIKELY REACH
295,000
Months
Actual Projected
Government Employment:
Historical vs. Projected Average Yearly Growth
BY THE END OF 2023. 3.00% 2.36%
2.01% 1.88% 2.06%
Not counting the seasonal ups and downs, 2.00% 1.59% 1.75%
1.30%
government employment levels will likely 1.00%
reach 295,000 by the end of 2023. The 0.61%
Annual Growth
0.00%
discrepancy of about 12,500 employees will
not likely be filled during the two-year ahead -1.00%
forecast interval. Projections point to an -2.00%
average yearly growth of 1.59 percent in 2022
-3.00%
and a lagged positive response of 1.06 percent
in 2023. -4.00%
-3.91% -3.92%
Valley financial activities employment -5.00%
2023
Sample 2019 2020 2021 2022
continued to improve, even as growth did Average Average Average Average Forecast Forecast
not switch from negative to positive territory.
Employment levels in this category continued Actual Optimistic Most Likely Pessimistic
to decline in 2021 but at a slower pace than
the year before. Employment in this category
will likely reach 42,000 in the fourth quarter
of 2023. Financial Activities Employment
In the coming months, as interest rates begin 51,000
to increase, Valley banks’ profitability also 49,000
Number of Employees
will increase. As interest rates fell during the 47,000
pandemic, Valley banks extended fewer loans, 45,000
reacting to very high default risks and interest
43,000
rates too low to generate profit. Financial
activities employment is projected to increase 41,000
at an average yearly rate of 2.22 percent in 39,000
2022 and 1.24 percent in 2023. 37,000
2003M09
2006M05
2008M05
2004M05
2005M09
2009M09
2002M05
2020M05
2023M09
2022M05
2007M09
2003M01
2005M01
2010M05
2001M09
2009M01
2013M09
2016M05
2018M05
2014M05
2015M09
2023M01
2019M09
2012M05
2021M09
2007M01
2017M09
2001M01
2013M01
2015M01
2011M09
2019M01
2021M01
2017M01
2011M01
Months
Actual Projected
14 | Stanislaus StateRecovery seems to be well underway Financial Activities Employment:
and is steady, based on the incoming Historical vs. Projected Average Yearly Growth
data. However, many important policy 3.00% 2.61%
2.22%
variables – such as easy monetary 2.00% 1.83% 1.66%
1.24%
policy and falling interest rates – will 0.81%
Annual Growth
1.00% 0.51%
be reversing course in the coming 0.00%
-0.41%
months. While the projections are -1.00%
upbeat in 2022, slower growth should -2.00%
prevail in 2023 due to a changing -3.00% -2.43%
business environment. Though there -4.00%
are no immediate signs of a downturn, -4.09%
-5.00%
it is important to watch incoming Sample 2019 2020 2021 2022 2023
Forecast
Average Average Average Average Forecast
data to take necessary positions and
be prepared before the impact of such Actual Optimistic Most Likely Pessimistic
reversing of course begins to be felt on
our economy. Consumer credit grew
more slowly than in previous months,
limiting the ability of consumers to
spend and eventually lowering their
spending power. To prepare for an
oncoming correction, it would be
prudent for businesses and consumers
to lower debt exposure, increase cash
holdings, lock interest rates early on
loans and move from flexible to fixed-
rate borrowing.
RECOVERY SEEMS TO BE
WELL UNDERWAY AND IS
STEADY, BASED ON THE
INCOMING DATA.
San Joaquin Valley Business Forecast, 2021 | Volume XI • Issue 1 | 15Housing Sector
The eight Metropolitan Statistical Areas (MSAs) Single-Family Building Permits
of the Bureau of Labor Statistics that make up
3,000
the San Joaquin Valley are Fresno, Bakersfield-
Delano, Hanford-Corcoran, Madera-Chowchilla,
2,500
Merced, Modesto, Stockton, and Visalia-
Porterville. The aggregated data from these MSAs
Number of Permits
2,000
constitute the total single-family building permits
in the Valley.
1,500
Housing permits spiked 35.65 percent in 2021,
an increase more than four times the long-term 1,000
benchmark rate of 8.22 percent. Even during
the pandemic, building permits increased 13.26 500
percent. Next year’s building permit totals will
likely be lower due to the spike in 2021. In any 0
case, the building permit data points to highly
2005M05
2006M09
2008M09
2009M05
2004M09
2023M05
2020M09
2022M09
2007M05
2006M01
2008M01
2013M05
2004M01
2010M09
2015M05
2016M09
2018M09
2019M05
2020M01
2014M09
2021M05
2012M09
2022M01
2017M05
2010M01
2016M01
2018M01
2011M05
2014M01
2012M01
increased activity in home building in the Valley.
At this strong pace, Valley housing permits will
most likely exceed 1,000 per month by the second Months
half of 2022.
Actual Projected
With 2,020 permits, Fresno kept the lead in issuing
the most housing permits in 2021, followed by
1,749 in Stockton and 1,351 in Bakersfield. Visalia Single-Family Building Permits:
issued 927 permits in 2020, while Madera and Historical vs. Projected Average Yearly Growth
Merced issued 778 and 93, respectively. Modesto 40.00%
issued 26 building permits, while no housing 35.00%
35.65%
permits were issued in Hanford-Corcoran.
30.00%
Annual Growth
Projections point to average annual growth of
25.00%
17.60 percent in 2022 and 3.76 percent in 2023, 19.61%
20.00% 17.60%
as the effects of tapering and rate hikes begin to 15.60%
15.00% 13.26%
take hold on the housing sector.
10.00% 8.22%
Because of the Federal Reserve’s continued 5.69%
5.00% 3.76%
intervention in 2021, the foreclosures started 0.00%
1.52% 1.84%
series in California fell further, to all-time lows, Sample 2019 2020 2021 2022 2023
Average Average Average Average Forecast Forecast
and became virtually nonexistent. Thus, this series
remains at the lowest levels since 1999. Bank Actual Optimistic Most Likely Pessimistic
accruals, however, began to rise sharply in 2021,
as they did in 2020. With the ending of mortgage
assistance in September, 2021, a sharp increase Foreclosure Starts in California
in foreclosures is expected in the coming
2.4
two-year period.
2.1
1.8
Percentage
1.5
1.2
0.9
0.6
0.3
0
Q3 2000
Q3 2003
Q3 2006
Q3 2009
Q4 2008
Q4 2005
Q4 2002
Q2 2004
Q4 2020
Q2 2007
Q1 2008
Q3 2018
Q1 2005
Q3 2015
Q2 2001
Q1 2002
Q2 2010
Q3 2012
Q2 2013
Q1 2020
Q4 2014
Q4 1999
Q2 2016
Q2 2019
Q4 2017
Q4 2011
Q1 2014
Q1 1999
Q1 2017
Q1 2011
Quarters
Mortgage Bankers Association of America
16 | Stanislaus State30-Year Fixed Rate
Other than a temporary spike in April, 10
2021, long-term interest rates kept falling. 9
Falling rates kept borrowing costs very low, 8
but home values increased sharply. The
7
Percentage
refinancing activity of homeowners who
6
could afford to do so was very active in
2021. When interest rates reverse course, 5
in concert with other important variables – 4
such as low tax rates – it undoubtedly will 3
have a dampening effect on the housing 2
sector. Whether this dampening turns
2000M06
2006M06
2008M06
2004M06
2003M02
2002M06
2020M06
2005M02
2009M02
2007M02
2003M10
2010M06
2005M10
2009M10
2016M06
2018M06
1996M06
1998M06
2014M06
1994M06
2001M02
2013M02
2012M06
2015M02
1995M02
2019M02
1999M02
2021M02
2007M10
2017M02
1997M02
2001M10
2013M10
1993M10
2015M10
1995M10
2019M10
1999M10
2011M02
2017M10
1997M10
2011M10
into a correction will very much depend
on how fast and how high interest rates
rise. Home values continued to increase Months
but the pace intensified in 2021. Home Freddie Mac
values in the Valley rose 12.19 percent in
2021 – more than twice the rate of the
5.38 percent observed in 2020. Yearly Growth in Housing Prices
Home value appreciation in 2021
Percentage Change Over the Previous Year
40
was the fastest since 2014. About
30
3.66 percent of this increase was due
to inflation, corresponding to 8.93 20
percent real appreciation. Even in real 10
terms, however, the appreciation was 0
significant enough to create the concern -10
of a potential correction in the housing
-20
market, particularly if such high rates
of appreciation do not retreat to more -30
sustainable rates. -40
2000q4
2003q4
2004q3
2006q4
2009q4
2008q2
2005q2
2002q2
2020q2
2022q3
2023q2
2007q3
2000q1
2001q3
2003q1
2010q3
2013q3
2006q1
2016q3
2009q1
2019q3
2018q4
2015q4
2012q4
2014q2
2021q4
2017q2
2018q1
2015q1
2011q2
2012q1
2021q1
The fastest increase in home values took
place in Stockton, which reported a 13.92
Quarters
percent average annual increase in 2021.
The second fastest increase in home Actual Projected
values was in Modesto at 13.03, followed
by Merced at 12.50 percent. Madera came
next at 12.02 percent, followed by 11.92 Yearly Growth in Housing Prices:
percent in Visalia and Porterville. Fresno Historical vs. Projected Average Yearly Growth
home prices increased 11.67 percent.
14.00%
Fresno and Hanford-Corcoran reported 12.19%
12.00%
Annual Yearly Growth
the slowest increase in home prices in
2020 at 11.26 percent and 11.19 percent, 10.00%
respectively. Projections point to a 6.38 8.00% 7.30%
6.38%
percent increase in 2022 and a 3.94 6.00%
5.23% 5.38% 5.46% 4.83%
4.46% 3.94%
percent increase in 2023. 4.00% 3.05%
2.00%
0.00%
Sample 2019 2020 2021 2022 2023
Average Average Average Average Forecast Forecast
Actual Optimistic Most Likely Pessimistic
San Joaquin Valley Business Forecast, 2021 | Volume XI • Issue 1 | 17Inflation and Prices
As the pandemic recovery intensified, Inflation Rate: Nationwide vs. West
enormous liquidity injections in the 5.5
economy began to take their toll on the rate 4.5
of inflation, and these high inflation rates
Yearly Inflation Rate
3.5
are likely to stay with us through the first 2.5
quarter of 2022. 1.5
As was the case following the 2008 recession, 0.5
the overall price level has risen during the -0.5
recovery from 2020 faster nationwide than for -1.5
our region, a reverse of historic performance. -2.5
2003M07
2006M07
2008M07
2005M07
2004M07
2009M07
2002M07
2020M07
2007M07
2003M01
2006M01
2008M01
2005M01
2004M01
2009M01
2002M01
2020M01
2001M07
2007M01
2010M07
2013M07
2016M07
2018M07
2015M07
2014M07
2019M07
2012M07
2021M07
2017M07
2001M01
2010M01
2013M01
2016M01
2018M01
2015M01
2014M01
2019M01
2012M01
2021M01
2011M07
2017M01
This change in pattern during recessions and
2011M01
immediately after recovery acts as another
reliable coincidental indicator for our region. Months
The rate of inflation began to come in at rates
West Nationwide
above 5 percent following the second quarter
of 2021. In 2021, the average yearly inflation
was 3.66 percent, well above the long-term U.S. West Inflation Rate
benchmark rate of 2.34 percent. The high price
6.0
of oil acts as a cost-push factor, driving prices 5.0
Yearly Percentage Change
higher. Another cost-push factor is high labor 4.0
costs, which have begun to increase well in 3.0
advance of the rate of inflation in the early 2.0
months of recovery. 1.0
0.0
-1.0
-2.0
-3.0
2003M09
2006M05
2008M05
2004M05
2005M09
2009M09
2002M05
2020M05
2023M09
2022M05
2007M09
2003M01
2005M01
2010M05
2001M09
2009M01
2013M09
2016M05
2018M05
2014M05
2015M09
2023M01
2019M09
2012M05
2021M09
2007M01
2017M09
2001M01
2013M01
2015M01
2011M09
2019M01
2021M01
2017M01
2011M01
Months
THE RATE OF INFLATION BEGAN Actual Projected
TO COME IN AT RATES ABOVE 5
PERCENT FOLLOWING THE SECOND U.S. West Inflation Rate:
Historical vs. Projected Average Yearly Growth
QUARTER OF 2021.
Yearly Percentage Change
4.00%
3.66%
3.50% 3.00%
2.81%
Inflation remains mainly anchored 3.00% 2.69% 2.63%
2.50% 2.34% 2.03%
to the price of oil. However, excess demand 2.00%
1.87%
1.76% 1.71%
conditions and shortages observed in 1.50%
commodity markets is another significant 1.00%
0.50%
factor driving prices up from the demand-pull 0.00%
side. Projections of the rate of inflation for Sample 2019 2020 2021 2022 2023
Average Average Average Average Forecast Forecast
the Western region point to an average yearly
increase of 2.81 in 2022 and 1.87 percent as Actual Optimistic Most Likely Pessimistic
the tapering intensifies and rates rise in 2023.
18 | Stanislaus StateWe had reported in our previous report that Quarterly Average Wages
perhaps the most interesting development 1150
during the early months of the recovery was 1050
950
Average Quarterly Wage
the yearly change in average weekly wages.
900
Wages normally fall during recessions.
850
However, average weekly wages in the 800
Valley rose 8.48 percent in 2020, another 750
characteristic that made this recession 700
unique. This sharp rise in wages was due to 650
the reluctance of workers afraid for many 600
550
reasons – including the fear of catching the
500
virus - to return to work and the amount of 450
available unemployment compensation.
2008q3
2005q3
2002q3
2003q2
2020q3
2004q4
2023q3
2006q2
2009q2
2022q4
2007q4
2001q4
2004q1
2010q4
2013q4
2014q3
2016q4
2019q4
2018q2
2015q2
2012q2
2021q2
2022q1
2007q1
2017q3
2001q1
2010q1
2011q3
2013q1
2016q1
2019q1
The reservation wage of a typical Valley
worker (the amount the average employee Quarters
would require to return to work) increased Actual Projected
about three times the long-term benchmark
rate of 3.21 percent during 2021. Slower
Quarterly Wage Growth:
increases will likely occur following the first Historical vs. Projected Average Yearly Growth
quarter of 2021. Average weekly wages in
9.00% 8.48%
the Valley will likely exceed $1,050 by the
8.00%
end of 2023. Projections point to an average
Average Yearly Growth
yearly increase of 2.77 in 2022 and 1.58 7.00%
percent in 2023. 6.00%
5.00% 4.93%
3.81%
DURING 2021, THE AVERAGE RATE OF 4.00%
3.21% 3.34%
2.77%
3.66 %
3.00%
INFLATION STOOD AT 2.00%
2.21% 1.82%
1.58%
1.33%
1.00%
0.00%
Sample 2019 2020 2021 2022 2023
Average Average Average Average Forecast Forecast
Actual Optimistic Most Likely Pessimistic
During 2021, the average rate of inflation Yearly Wage Growth vs. Inflation
stood at 3.66 percent. During the same time, 14.0
Average Percentage Change
average weekly wages rose 4.93 percent, 12.0
corresponding to a gain in purchasing power 10.0
of 1.27 percent. In 2020, the rate of inflation 8.0
was 1.76 percent while the increase in 6.0
average weekly wages was 8.48 percent, 4.0
corresponding to a gain in purchasing power 2.0
of 6.72 percent – the largest gain since 2001. 0.0
In the coming months, however, average
-2.0
weekly wages will likely be increasing at a
-4.0
slower pace than the rate of inflation, thus
2003q3
2006q3
2009q3
2008q4
2005q4
2002q4
2004q2
2007q2
2008q1
2018q3
2005q1
2015q3
2002q1
2010q2
2012q3
2013q2
2020q1
2014q4
2016q2
2019q2
2017q4
2011q4
2014q1
2017q1
2011q1
decreasing purchasing power.
Quarters
Inflation Wage Growth
San Joaquin Valley Business Forecast, 2021 | Volume XI • Issue 1 | 19Banking and Capital Markets
The continued interventions in the Total Bank Deposits (in $ Thousands)
economy to fight the impacts of the 29,000,000
pandemic resulted in tremendous liquidity
injections, which were reflected in bank 24,000,000
deposits and net loans and leases as well
Total Deposits
as bank accruals.
14,000,000
Valley total bank deposits spiked 25.71
\
percent in 2021 and 21.19 percent in 2020.
9,000,000
When these are compared with the long-
term benchmark rate of 8.68 percent one
4,000,000
can understand the magnitude of the
2003q4
2004q3
2006q4
2009q4
2008q2
2005q2
2020q2
2022q3
2023q2
2007q3
2003q1
2010q3
2013q3
2006q1
2016q3
2009q1
2019q3
2018q4
2015q4
2012q4
2014q2
2021q4
2017q2
2018q1
2015q1
2011q2
2012q1
2021q1
increase resulting from the Federal Reserve
intervention. Yet despite the banks being
Quarters
flooded with cash, they do not appear be
extending loans at the same pace as the Actual Projected
increase in deposits because of a high default
risk and low interest rates. Community bank
deposits in the Valley will likely increase
at rates in line with their historic rates as Total Bank Deposits:
tapering resumes and interest rates rise. Historical vs. Projected Average Yearly Growth
Valley total bank deposits are projected to 30.00% 25.71%
Average Yearly Growth
increase at an average annual rate of 5.58 25.00%
21.19%
percent in 2022 and 4.49 percent in 2023 as 20.00%
the Federal Reserve slowly begins to deflate 15.00%
the balance sheet. 10.00% 8.68% 7.07% 7.07%
5.58% 6.06%
4.09% 4.49%
5.00% 2.91%
VALLEY TOTAL BANK DEPOSITS ARE PROJECTED TO 0.00%
5.58 %
INCREASE AT AN AVERAGE ANNUAL RATE OF Sample
Average
2019
Average
2020
Average
2021
Average
2022
Forecast
2023
Forecast
Actual Optimistic Most Likely Pessimistic
IN 2022
Assets in Nonaccrual
250,000
Thousand Dollars
200,000
Bank assets in non-accrual have begun to trend
more visibly upward in 2021. With the end 150,000
of mortgage forbearance programs and other
support in September of 2021, the pace of 100,000
non-accruals will likely rise at a faster rate. The
rise in interest rates will make it more difficult 50,000
for Valley residents to meet their mortgages
and other financial obligations. The anticipated -
2003q4
2006q4
2008q4
2005q4
2003q2
2004q4
2009q4
2006q2
2008q2
2005q2
2004q2
2009q2
2020q4
2020q2
2007q4
2007q2
2010q4
2013q4
2016q4
2018q4
2015q4
2010q2
2013q2
2014q4
2019q4
2016q2
2018q2
2015q2
2012q4
2014q2
2019q2
2012q2
2021q2
2017q4
2017q2
2011q4
2011q2
increases in taxes also will contribute to a
decrease in the disposable income that fuels
Quarters
consumer spending and savings.
Federal Deposit Insurance Corporation
20 | Stanislaus StateThe pattern observed in bank assets Assets in Default 30-Plus Days
in default 90-plus days is not yet 80,000
consistent with the pattern observed 70,000
in bank assets in non-accrual. The two
Thousand Dollars
60,000
series are exhibiting a flatter trend when
50,000
viewed against the steep trend observed
40,000
in bank non-accruals. The two series
will likely increase at much faster rates 30,000
in the coming months as the Federal 20,000
Reserve begins to gradually decrease the 10,000
balance sheet and resorts to a series of -
rate hikes to control inflation.
2008q3
2005q3
2003q2
2020q3
2004q4
2006q2
2009q2
2007q4
2004q1
2010q4
2013q4
2014q3
2016q4
2019q4
2018q2
2015q2
2012q2
2021q2
2007q1
2017q3
2010q1
2011q3
2013q1
2016q1
2019q1
Community bank net loans and leases
Quarters
increased 11.36 percent in 2021. The
rate of increase was less than the 17.63 Assets in Default 30-89 Days Assets in Default 90-Plus Days * 10
percent increase in 2020, pointing to
further cuts on the part of community
banks to issue loans. It means banks
Net Loans and Leases (in $ Thousands)
are increasingly choosing to sit on
17,300,000
cash rather than extend more loans.
The expected increase in interest 15,300,000
Net Loans and Leases
rates may change this picture in the 13,300,000
coming months as higher interest
rates correspond to increased bank 11,300,000
profitability. 9,300,000
The economic stimulus plan, indeed, 7,300,000
delivered much-needed assistance to
5,300,000
fight-off the impact of the pandemic
on the economy. Had the plan not 3,300,000
been implemented, the effect of the
2003q4
2004q3
2006q4
2009q4
2008q2
2005q2
2020q2
2022q3
2023q2
2007q3
2003q1
2010q3
2013q3
2006q1
2016q3
2009q1
2019q3
2018q4
2015q4
2012q4
2014q2
2021q4
2017q2
2018q1
2015q1
2011q2
2012q1
2021q1
pandemic on the economy would be
much more devastating. But with the Quarters
end of assistance programs and easy Actual Projected
monetary policy and with falling rates
reversing course, the trajectory of the
economy will likely change in the next
Net Loans and Leases:
two years.
Historical vs. Projected Average Yearly Growth
Community bank deposits and net loans 20.00%
and leases both are likely to grow more 18.00% 17.63%
16.00%
in line with their historical benchmark
Yearly Growth
14.00%
rates as the Federal Reserve begins 12.00% 11.36%
10.00%
8.24% 8.16%
to deflate the balance sheet to tame 8.00% 6.00% 6.00%
6.00% 5.24%
inflation. Projections point to net loans 4.00%
4.47% 4.07%
2.14%
and leases increasing at an average 2.00%
0.00%
yearly rate of 5.24 percent in 2022 Sample 2019 2020 2021 2022 2023
Average Average Average Average Forecast Forecast
and 4.07 in 2023.
Actual Optimistic Most Likely Pessimistic
San Joaquin Valley Business Forecast, 2021 | Volume XI • Issue 1 | 21Concluding Remarks
Incoming data points to a recovery that is now well
underway. With the seeking of emergency authorization for
COVID-19 oral medications, and with vaccine booster shots
poised to be publicly available in the second half of 2021, we
are quickly moving away from the pandemic’s hold on the
economy. However, easy monetary policy and falling interest
rates will be reversing courses and change the trajectory of
the economy. Much will depend on how fast and how high
interest rates rise following the tapering activity by the
Federal Reserve.
Valley total employment will likely grow at an overall average
rate of 3.51 percent in 2022, followed by slower growth of
0.88 percent in 2023. During 2021, total employment in all
counties grew, with the exception of Kings County. Merced
County employment grew the fastest, with Madera and
San Joaquin counties tying for second place. Fourth-fastest
growth occurred in Stanislaus County while Kern and Fresno
counties took fifth and sixth place, followed by Tulare.
Information employment continued to decline at the
fastest rate of all sectors in 2021, but these declines were
occurring long before the pandemic hit. The information
The overall price level rose above 5 percent and high
employment rate of decline was much slower than the
inflation rates are likely to prevail through the first quarter
decline in 2020. The fastest-growing category of employment
of 2022. Average weekly wages rose 4.93 percent, well above
was retail trade, followed by trade, transportation and
the 3.66 percent rate of average yearly inflation. There was
utilities employment. The leisure and hospitality services
a 1.27 percent gain in purchasing power in 2021 but in the
category grew the third-fastest while manufacturing and
coming months inflation is likely to outpace the increase in
construction employment were the fourth- and fifth-
average weekly wages.
fastest growing categories. Financial activities employment
declined in 2021, but the decline was slower than that of Both Valley bank deposits and net loans and leases increased
2020. Government employment posted the same decline significantly, but the increase in net loans and leases lagged
in 2021 as in the previous showing. Education and health behind the increase in bank deposits. This discrepancy
services employment grew the slowest in 2021, due to delays meant community banks extended fewer loans in 2021.
in school-openings and with healthcare workers primarily Valley community bank assets in nonaccrual began to trend
assigned to fighting the pandemic. Because of the worsening more steeply upwards in 2021 compared to the year before
drought, farm-related wholesale employment declined and are likely to continue at this pace as tapering resumes
in 2021. and rates rise. Community bank assets in default 30 to 89
days and assets in default 90 plus days displayed a different
Home values posted very significant increases in 2021,
pattern in 2021 than the pattern displayed by bank assets in
bringing back worries of a correction in the housing market.
non-accrual, but with the ending of mortgage forbearance
While there are no immediate signs of this happening,
programs and similar support, the two series will rise in a
tapering and rate hikes may trigger a crisis if homeowners
pattern similar to banks’ assets in non-accrual.
panic and attempt to sell their homes all at once, an action
that would significantly depress home values. It is important In all, the regional and national indicators point to a
for homeowners to keep an eye on the variables as they recovery taking hold, but easy monetary policy, falling
reverse course and to prepare for a potential correction by interest rates and low taxes will be reversing course and
lowering debt exposure, moving into cash, locking-in fixed will change the dynamics of the Valley economy. While the
interest rates by moving from flexible rates while interest data does not point to any immediate correction, it is now
rates are still low, and even selling homes and moving into important for Valley residents and business community to
rental property. keep a close eye on the impact from key variables reversing
course in the coming months.
22 | Stanislaus StateYou can also read


