Superforecasters: A Decade of Stochastic Dominance - Good ...
←
→
Page content transcription
If your browser does not render page correctly, please read the page content below
Technical White Paper, October 2021

               Superforecasters: A Decade of Stochastic Dominance
                                          Christopher W. Karvetski, PhD
                                          karvetski@goodjudgment.com

1. Introduction                                                2. Analysis

    The emergence of “Superforecasters” occurred                  For our comprehensive analysis, we compiled
during the initial multi-year geopolitical forecasting         forecasting data over a six-year period on 108
tournaments that were sponsored by the research arm            geopolitical forecasting questions that were posted
of the US Intelligence Community (IARPA) and ran               simultaneously on the GJ Inc Superforecaster
from 2011 until 2015. These Superforecasters                   platform as well as the Good Judgment Open (GJ
routinely placed in the top 2% of accuracy among               Open) forecasting platform, an online forecasting
their peers and were a winning component of the                platform and community that allows anyone to sign
experimental research program of the Good                      up, make forecasts, and track their accuracy over
Judgment Project, one of five teams that competed              time and against their peers. The 108 forecasting
in the initial tournaments. These elite                        questions were diverse, spanning elections,
Superforecasters exceeded the many forecasting                 economics and policy, COVID-19, and other key
accuracy targets set by IARPA, and notably were                geopolitical events. The keywords from the
over 30% more accurate than US intelligence                    questions are presented in Figure 1.
analysts forecasting the same events with access to
classified information. While the story of
Superforecasters has been chronicled in numerous
media and academic publications, it is best told in
Tetlock and Gardner’s book Superforecasting: The
Art and Science of Prediction[1].

   While the official IARPA geopolitical
forecasting tournaments ended in 2015, many from
the original cohort of Superforecasters, as well as
newly-identified elite forecasters, have continued to
make forecasts as professional forecasters within
Good Judgment Inc (GJ Inc), the commercial
successor to the Good Judgment Project that serves
a variety of public and private sector clients. Our
goal within this technical whitepaper is to fill the gap
between 2015 and 2021 and benchmark the accuracy
of Superforecasters versus a large peer group of
online forecasters.                                      Figure 1. Phrases that comprised the forecasting questions.

                                                           1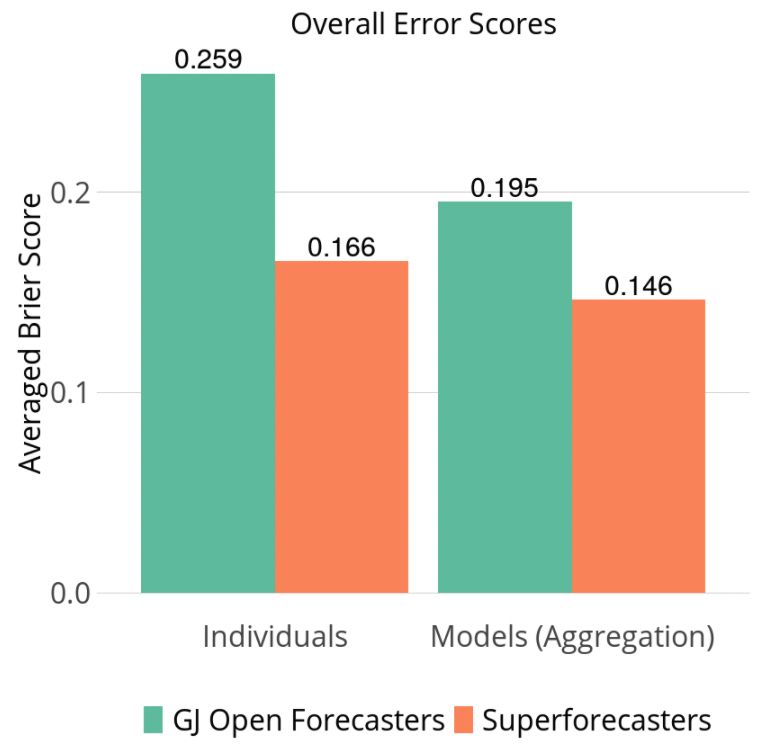
Technical White Paper, October 2021
The average time each forecasting question was question and on the same day. This approach ensures
open was 214 days. In total, as shown in Figure 2, that each forecaster was benchmarked against other
there were 219 (1.5%) Superforecasters versus forecasters who had the opportunity to access the
14,179 (98.5%) GJ Open forecasters that made at same information at the same point in time, as
least one forecast on one of the 108 questions. opposed to comparing forecasts on the same
Despite being relatively small in number, the question but made at differing time points within the
Superforecasters were much more prolific, making question, which would yield a potential
59,756 (35.6%) forecasts on these questions versus informational advantage to the forecaster making
107,866 (64.4%) forecasts for GJ Open forecasters. later forecasts.
Figure 2. Composition of forecasters and forecasts.
Figure 3. Question level statistics.
As shown in Figure 3, each Superforecaster
In total, there were 16,358 days where at least one
made, on average, forecasts on 25 of the 108
Superforecaster and at least one GJ Open forecaster
different questions, versus less than three for each GJ
made a forecast on the same question, which
Open forecaster. Consistent with the reporting in
produced a sample of 53,001 forecasts from
Grant’s book Think Again: The Power of Knowing
Superforecasters and 92,155 forecasts from GJ Open
What You Don’t Know[2] and the study of Atanasov
forecasters. We scored every forecast using Brier
et al.[3], Superforecasters were also much more likely
scoring (or a comparable scoring method for ordinal
to update their beliefs via small, incremental changes
binned questions); and then for each day, we
to their forecast. Superforecasters made almost 11
calculated the average Superforecaster score and the
forecasts per question, with an average change of
average GJ Open forecaster score. Finally, with
0.036 probability units per update, versus 2.8
16,358 pairs of averaged scores, we took an overall
forecasts per question for GJ Open forecasters with
average as our single score for each group, which is
an average change of 0.059 probability units. To
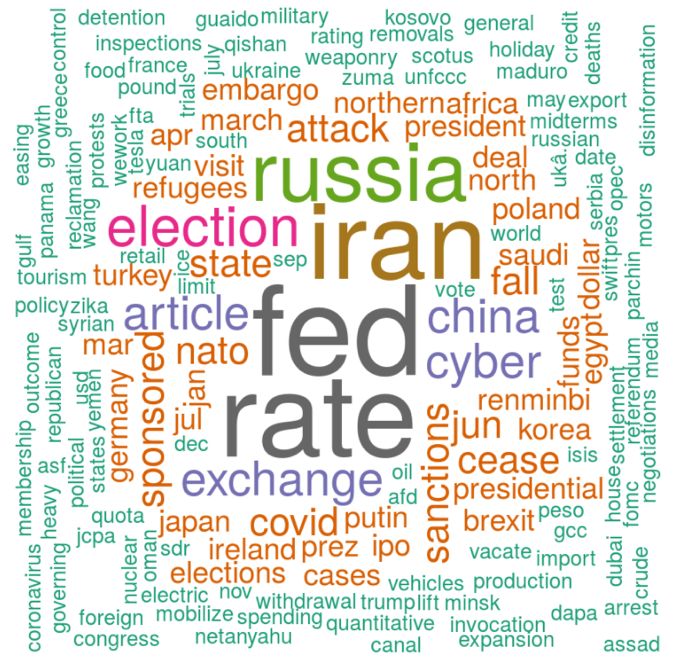
shown in Figure 4. We see that, on average,
isolate forecasting skill, we aligned and compared
Superforecasters’ daily average error scores were
forecasts from both groups made on the same
2
Technical White Paper, October 2021

35.9% more accurate than their GJ Open increases, the Superforecasters achieve lower Brier
counterparts (0.166 versus 0.259, respectively).       error scores, signifying greater accuracy and earlier
                                                       insight.
   While these figures account for difference in
accuracy among the individual forecasters, we also        To provide reference, we see that when GJ Open
wanted to benchmark the accuracy when the forecasters achieve an error score near 0.5, which
forecasts were aggregated. Using GJ Inc aggregation corresponds to forecasting 50/50 on a binary
methods, we calculated the aggregate forecast for outcome, Superforecasters have an average score of
each of the two forecasting groups on the 16,358 0.28, which implies providing a forecast of
days, then scored each aggregate forecast in a similar 0.63/0.37 on the same event and having the first
manner, and finally averaged the daily aggregate option resolve as true. We see that in cases when
error scores. These results are shown in Figure 4, GJ Open forecasters are categorically wrong and
where we see that aggregation had a notably larger achieve a score of 2.0 (i.e., putting 100% wrong on
effect on GJ Open forecasters, yet the the wrong outcome), the average score of
Superforecaster aggregate forecasts were, on Superforecasters is 1.22, which corresponds to a
average, 25.1% more accurate than the aggregate 0.78/0.22 binary forecast with second option
forecasts using GJ Open forecasts (0.146 versus resolving as true.
0.195, respectively).

                                                           Figure 5. Average daily forecasting error comparison.

                                                              In Figure 6 we track the average error score as it
                                                           relates to the days until the respective questions’
Figure 4. Averaged error scores.
                                                           outcomes were resolved. We see that across all time
                                                           points Superforecasters had an average error score
   Using the same 16,358 days with at least one            that was significantly less than that of their GJ Open
forecast from both groups on the same question,            forecasting counterparts. The average error score for
Figure 5 shows the average daily error score of            GJ Open forecasters just before resolution (zero
Superforecasters’ forecasts when charted against           days) was comparable to average error score for
the average daily error score of forecasts from GJ         Superforecasters on forecasts made 30 days out from
Open forecasters that were made on the same day.           resolution. More impressively, the average error
We see that when forecasts are trivially easy (i.e.,       score for GJ Open forecasters at 30 days from
error scores near zero), the two error scores are          resolution was larger than any of the average error
comparable. Yet, as the difficulty of the question

                                                       3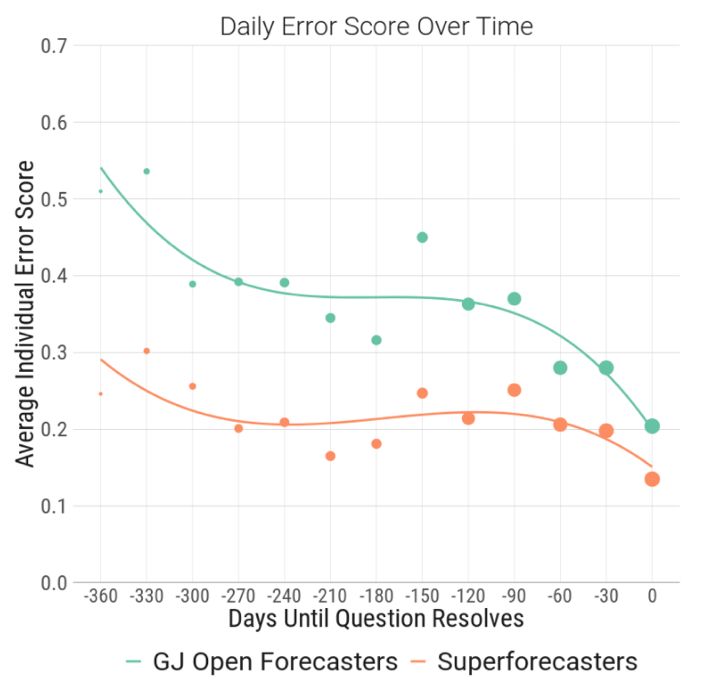
Technical White Paper, October 2021

scores of Superforecasters on any day up to 300 days average absolute distance between the forecasted
prior to resolution.                                 values and the occurrence rates. GJ Open
                                                     forecasters differ from perfect calibration by an
                                                     average of 0.068 probability units, whereas
                                                     Superforecasters differ by only 0.014 probability
                                                     units, a 79% improvement.

Figure 6. Average daily error scores over time.

                                                            Figure 7. Calibration curves of each forecasting group.
   To get a better idea of why Superforecasters
were more accurate, we calculated forecasting
metrics of calibration, discrimination or resolution,           By divvying up the forecasts that were assigned
and noise for the two sets of forecasts from the            to bins/events that eventually resolved as true, versus
individual forecasters. Using the entire set of             those that eventually resolved as false, we calculated
167,622 forecasts (those described in Figure 2), we         two metrics of forecast discrimination. In general,
plotted the overall calibration curve for each group        better discrimination implies a clearer dividing line
of forecasters in Figure 7. For example, seeing a           among forecasts for events that resolved true versus
value of 6.5% for the GJ Open curve at the                  forecasts on events that eventually resolved false.
forecasted point near zero implies that while the
average of all bin forecasts near zero was actually            The first metric that measures discrimination is
0.4%, the percentage of times the corresponding             Area Under the Curve (AUC), which ranges from
bins resolved as true was 6.5%, and therefore GJ            0.5 (completely random guessing) to 1 (perfect
Open forecasters were overconfident in these                discrimination). In Table 1, we see forecasts from GJ
forecasts.                                                  Open forecasters had an AUC value of 0.867 versus
                                                            a value of 0.950 for Superforecaster forecasts. A
   In general, we see that GJ Open forecasters              second metric of discrimination, d-prime,
follow the typical over-confident pattern observed          corresponds to the notion of effect size between
across many other forecasting studies[4], where they        forecasts on bins/events that resolved as true versus
forecast between 0% and 20% when there is a                 those that resolved as false. The metric is oriented
greater possibility of the event occurring and              such that 0 implies no discrimination and the metric
similarly over-predict the likelihood of events             increases as discrimination improves. We see the GJ
occurring for forecasts greater than 50%. This              Open forecasters achieved a d-prime score of 1.764
pattern is notably absent for the Superforecasters.         whereas Superforecasters had a d-prime score of
The miscalibration score in Table 1 translates the          2.837. The mean forecast value of Superforecasters’
calibration curve into a score and reflects the             forecasts on events that eventually resolved as true

                                                        4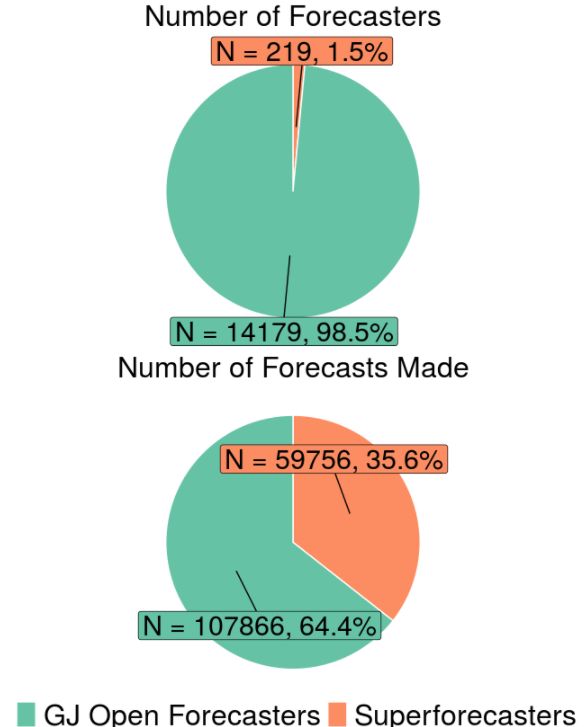
Technical White Paper, October 2021

was 0.741, versus a mean forecast value of 0.116 on           forecasts were well-calibrated and without
events that eventually resolved as false. In contrast,        noticeable biases such as over-confidence, which
the mean forecast value of GJ Open forecasters for            were displayed by the GJ Open forecasters. This
events that eventually resolved as true was 0.676,            implies a forecast from Superforecasters can be
versus a mean forecast value of 0.164 for events that         taken at its probabilistic face value. Superforecasters
eventually resolved as false.                                 had greater resolution in identifying the eventual
                                                              outcome. Finally, the amount of between-forecaster
Table 1. Metrics of comparison.                               noise was minimal, implying greater consistency
                                                              and reliability in translating the variety of different
                       GJ Open        Super-                  signals—whether from myriad news or social media
    Metric            Forecasters   forecasters               feeds of varying credibility, or mined from relevant
 miscalibration         0.068          0.014                  events from history—into a numeric estimate of
     AUC                0.867          0.950                  chance.
    d-prime             1.764          2.837
  Noise (SD)            0.102          0.046
                                                              References

    Finally, in an effort to measure forecasting noise,       [1] Tetlock, P. E., & Gardner, D. (2015).
we selected all days where at least two                       Superforecasting: The Art and Science of
Superforecasters and two GJ Open forecasters                  Prediction. New York, NY: Crown Publishers.
forecasted the same question on the same day (N =
9,586 days). While some deviation is expected                 [2] Grant, A. (2021). Think Again: The Power of
between forecasters due to difference of opinion or           Knowing What You Don’t Know. New York, NY:
interpretation of the evidence, excessive noise               Viking.
implies lack of forecasting reliability and can be one
of the largest components of forecasting error[5][6].         [3] Atanasov, P., Witkowski, J., Ungar, L., Mellers,
By looking at the average standard deviation (SD)             B., & Tetlock, P. (2020). Small steps to
from each group of forecasts made on the same                 accuracy: Incremental belief updaters are better
question and same day, we see that GJ Open                    forecasters. Organizational Behavior and
forecasters had an average forecast standard                  Human Decision Processes, 160, 19–35.
deviation of 0.102 probability units, whereas
Superforecasters had an average standard deviation            [4] Moore, D. A., Swift, S. A., Minster, A., Mellers,
of 0.046 probability units, a 55% reduction in noise.         B., Ungar, L., Tetlock, P., Yang, H. H. J., &
This is consistent with the findings of Satopää et            Tenney, E. R. (2017). Confidence calibration in a
al.[7], in analyzing data from the original IARPA             multiyear geopolitical forecasting
tournaments, that Superforecasters were superior to           competition. Management Science, 63(11), 3552–
their forecasting peers in tamping down judgmental            3565.
noise when producing their forecasts.
                                                              [5] Kahneman, D., Sibony, O., Sunstein, C. R.
3. Summary                                                    (2021). Noise: A Flaw in Human Judgment. New
                                                              York, NY: Little, Brown Spark.
   Our analysis showed that Superforecasters, while
a comparatively small group, were significantly               [6] Armstrong, J. S. (2001). Principles of
more accurate than their GJ Open forecasting peers.           Forecasting: A Handbook for Researchers and
The gains in accuracy were relatively consistent              Practitioners. Norwell, MA: Kluwer Academic
across different forecasting timelines and different          Publishers.
levels of forecasting difficulty. In further
investigating three different components of                   [7] Satopää, V. A., Salikhov, M., Tetlock, P., &
forecasting error, we found that Superforecasters             Mellers, B. (2021). Bias, information, noise: The
excelled in comparison to GJ Open forecasters                 BIN model of forecasting. Management Science, in
across the board. In particular, Superforecaster              press.

                                                          5
You can also read