VARIATIONS IN PUBLIC CONTRACTS OF ROAD WORKS - 3Ciencias
←
→
Page content transcription
If your browser does not render page correctly, please read the page content below
3C Empresa. Investigación y pensamiento crítico. ISSN: 2254-3376                              Ed. 43 Vol. 9 N.º 3 Agosto - Noviembre

     INTEGRAL FORMULA FOR THE DETERMINATION OF PRICE
     VARIATIONS IN PUBLIC CONTRACTS OF ROAD WORKS
                                                                                               Eddie Enzo Aronés Barbarán
                                                                                   National University Federico Villarreal, (Perú).
                                                     E-mail: fkaseng@unfv.edu.pe ORCID: https://orcid.org/0000-0003-1157-5603

                                                                                                Freddy Lizardo Kaseng Solis
                                                                                   National University Federico Villarreal, (Perú).
                                                     E-mail: fkaseng@unfv.edu.pe ORCID: https://orcid.org/0000-0002-2878-9053

                                                                                                  Ciro Rodriguez Rodriguez
                                                                              National University Mayor de San Marcos, (Perú).
                                            E-mail: crodriguezro@unmsm.edu.pe ORCID: https://orcid.org/0000-0003-2112-1349

                                                          Recepción: 20/04/2020 Aceptación: 16/06/2020 Publicación: 24/08/2020

          Citación sugerida:
          Aronés, E.E., Kaseng, F.L., y Rodriguez, C. (2020). Integral formula for the determination of price variations
          in public contracts of road works. 3C Empresa. Investigación y pensamiento crítico, 9(3), 97-107. https://doi.
          org/10.17993/3cemp.2020.090343.97-107

97
3C Empresa. Investigación y pensamiento crítico. ISSN: 2254-3376                 Ed. 43 Vol. 9 N.º 3 Agosto - Noviembre

     ABSTRACT
     The objective of the research is to generate a new formula to determine the variation in prices in a public
     works contract that allows the financial balance of the counterparts. The methodology for calculating
     and adjusting the price variation in public works contracts is given as a function of the K factor, which
     is a number that comes from the calculation of polynomial formulas whose theoretical basis lies in the
     price indices, which are established in a legal framework of mandatory use of the polynomial formula
     to determine the K factor, with eight monomials in the budget and the quantity of supplies that exceeds
     one hundred. It is considered a subjective margin since its elaboration depends on the discretion of the
     one who elaborates on the polynomial formula. The investigation questions the procedure established
     by the state regulations for the calculation of the polynomial formula and shows the margin of error that
     exists between the value obtained by the method set for regulations and that obtained using the entries
     of the work budget. The result shows the positive variation in inputs, and the prices have increased, with
     adjustments paid in the contracts with the benefit of contractors.

     KEYWORDS
     Readjustment of prices, Polynomial formula, Variations, Index numbers, Price index, Contracts.

98                                                                      https://doi.org/10.17993/3cemp.2020.090343.97-107
3C Empresa. Investigación y pensamiento crítico. ISSN: 2254-3376 Ed. 43 Vol. 9 N.º 3 Agosto - Noviembre
1. INTRODUCTION
To regulate the procedure for calculating adjustments, in 1979, DS No. 11-79-VC (Vice-Ministry of
Construction, 1979) was published, where it is established that it will be calculated based on the K factor
resulting from an expression Mathematics that considers the incidence of materials, this expression is
called polynomial formula. K is a number that comes from the calculation of polynomial formulas,
whose theoretical basis lies in the price indices (Muñoz, 2004).
The particularity of this polynomial formula is that it considers only a maximum of eight inputs, the
most representative in terms of costs, regardless of the complexity of the work or budget. It is necessary
to mention that the simplest work has more than one hundred inputs. That is, to date, adjustments are
paid with a polynomial formula that only considers a reduced fraction of all the inputs of a public works
budget, so classification is important (Soto, 2020).
The current methodology of the polynomial formula for calculating the K factor, which restricts only
eight monomials regardless of the complexity of a road work, calls into question the representation of
the variation in the prices of the budget estimated by K.
This situation would be leading to an overestimation or underestimation of the budget adjustment
(Sanchez, 2020), thus affecting the economic balance between the parties. In the present research work,
the analysis of a sample of two polynomial formulas of road works contracts is performed (Huapaya,
2020), calculating the K factor using all the inputs contained in the technical file. The differences between
the K factors established by each method have been made and the margin of error that exists between
both methods has been determined (Levy, 2020).
2. MATERIAL AND METHODS
The type of research type is applied, prospective, comparative, and correlational since two variables
were related. The factor K obtained by the established polynomial formula and the factor K obtained
99 https://doi.org/10.17993/3cemp.2020.090343.97-1073C Empresa. Investigación y pensamiento crítico. ISSN: 2254-3376 Ed. 43 Vol. 9 N.º 3 Agosto - Noviembre
from a polynomial formula considering all the inputs. It is predictive of using inferential statistics to
corroborate the calculations. The design applied for the development of this thesis is oriented to the
study and analysis of the variables that are the subject of our research.
The research design evaluates multiple variables reflected in the unified indices have been manipulated,
which have allowed determining the K factors both by the current polynomial formula and by using all
the inputs, proposed in the research.
The source of the data corresponds to the road works contracts of the last five years. The budget, the
list of inputs, the execution schedule, and its polynomial formula have been used as the base material for
these contracts.
The technical files of road works carried out by the Special Project of Decentralized Transport - PVD of
the Ministry of Transport have been considered, to which the probabilistic sampling was applied to the
technical files with the same possibility of being chosen. The level of confidence that has been assumed
is 95%.
The techniques used for the research will be:
• Documentary review: this technique was used to obtain information through the rules, books,
theses, manuals, regulations, directives, and other information.
• Documentary analysis: the technical files of the works contracted by the Ministry of Transport
and Communications were analyzed.
• For the management of data such as budgets, unit price analysis, input relationship, preliminary
grouping, etc., Excel spreadsheets were used.
Different statistical techniques and tools were used, such as:
• Verification of data normality.
100 https://doi.org/10.17993/3cemp.2020.090343.97-107relationship, preliminary grouping, etc., Excel spreadsheets were used.
Different statistical techniques and tools were used, such as:
3C Empresa. Investigación y pensamiento crítico. ISSN: 2254-3376
• Verification of data normality. Ed. 43 Vol. 9 N.º 3 Agosto - Noviembre
• Correlation analysis.
• Correlation analysis.
• Regression analysis.
• Data analysis.
• Regression visualization.
• Monte Carlo simulation to measure approximate risk.
• Data visualization.
The MS Office and SPSS programs were used to process and analyze the data.
• Monte Carlo simulation to measure approximate risk.
The research was carried out in the city of Lima with data from public road works, and
the methodology process, to determine the K factor, index numbers, and price indices, is
The MS Office and SPSS programs were used to process and analyze the data.
showed in Figure 1.
The research was carried out in the city of Lima with data from public road works, and the methodology
process, to determine the K factor, index numbers, and price indices, is showed in Figure 1.
Determination of K values for a Determination of K values for a
period of one year using the period of one year using the
Determination of the difference
existing polynomial formula polynomial formula usimg all
for each value of K
from the technical files of the the inputs from the technical
sample files of the sample
Using the statistical tools,
analize the individual results Verification of the null
Make conclusions
and the results of the entire hypothesis
sample
Figure 1. Methodology for determining K factor differences.
3. RESULTS
Figure 1. Methodology for determining K factor differences.
The analysis of two polynomial formulas of two public road works contracts that to date have been
concluded and settled has been carried out.
3. Results
The analysis of two polynomial formulas of two public road works contracts that to date
have been concluded and settled has been carried out.
The general information of the two works (Case 1 and Case 2) are:
101 https://doi.org/10.17993/3cemp.2020.090343.97-107
Case 1:3C Empresa. Investigación y pensamiento crítico. ISSN: 2254-3376 Ed. 43 Vol. 9 N.º 3 Agosto - Noviembre
The general information of the two works (Case 1 and Case 2) are:
Case 1:
K = 0.085 (Mr / Mo) + 0.054 (FAMr / FAMo) + 0.112 (ACr / ACo) + 0.118 (PMAr / PMAo) + 0.101
(Mr / Mo) + 0.270 (DLr / DLo) + 0.260 (Ir / Io)
The calculated values of
K in the execution period are shown in Table 1:
Table 1. K values of Case 1 obtained with the current formula.
oct-16 nov-16 dic-16 ene-17 feb-17 mar-17 abr-17 may-17 jun-17 jun-17
1,01 1,016 1,016 1,014 1,01 1,016 1,013 1,016 1,014 1,013
Case 2:
Its polynomial formula is:
K = 0.066 AMr / AMo + 0.138 ACr / ACo + 0.117 Mr / Mo + 0.082 Jr / Jo + 0.285 Dr / Do + 0.121
Ar / Ao + 0.191 GGUr / GGUo
The calculated values of
K in the execution period are shown in Table 2:
Table 2. K values for Case 2 obtained by the current polynomial formula.
may-13 jun-13 jul-13 ago-13 sep-13 oct-13 nov-13 dic-13 ene-14 feb-14
0,995 1,012 1,026 1,031 1,029 1,026 1,03 1,028 1,033 1,035
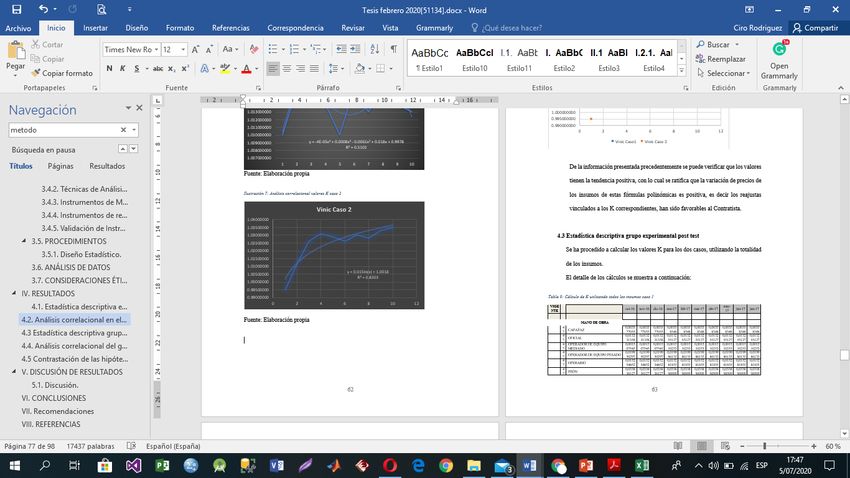
Correlational analysis in the pretest
The correlational analysis of K in figure x. a) shows the graphic of the correlation
y = -4E-05x4 + 0.0008x3 - 0.0061x2 + 0.018x + 0.9978, and R² = 0.5102
The correlational analysis of K in figure x. b) shows the graphic of the correlation
y = 0.015ln(x) + 1.0018 and R² = 0.8303
102 https://doi.org/10.17993/3cemp.2020.090343.97-1073C Empresa. Investigación y pensamiento crítico. ISSN: 2254-3376 Ed. 43 Vol. 9 N.º 3 Agosto - Noviembre
In Table 3, the consolidated values of both cases are shown:
Table 3. K values calculated with the current polynomial formula.
Nª Vinic Case 1 Vinic Case 2
1 1,010000000 0,99500000
2 1,016000000 1,01200000
3 1,016000000 1,02600000
4 1,014000000 1,03100000
5 1,010000000 1,02900000
6 1,016000000 1,02600000
7 1,013000000 1,03000000
8 1,016000000 1,02800000
9 1,014000000 1,03300000
10 1,013000000 1,03500000
Source: own elaboration.
Correlational analysis of the experimental group in the pre-test
Correlational analysis of the experimental group in the pre-test
The results of the correlational analysis are shown in Figures 2 with the comparison of
The results of the correlational analysis are shown in Figures 2 with the comparison of the K values with
the K values with the methods used in cases 1 and 2 and the respective distribution of
the methods usedininKcases
differences 1 and 2 and the respective distribution of differences in K values.
values.
Correlational
Correlational analysis
analysis in the in the pre-test
pre-test ofVinic
of the K the Kvalues
Viniccase
values case
1 and case1 2.
and case 2.
(a) (b)
Figure 2. Correlational analysis of K values a) Vinic case1 and b) Vinic case 2.
(a) (b)
Figure 2. Correlational analysis of K values a) Vinic case1 and b) Vinic case 2.
103 https://doi.org/10.17993/3cemp.2020.090343.97-107
Correlational analysis of the experimental group in the post-test
The results of the correlational analysis post-test are shown in Figure 3 with the(a) (b)
3C Empresa.
Figure Investigación
2. Correlational y pensamiento
analysis crítico.
of K values ISSN:case1
a) Vinic 2254-3376
and b) Vinic case 2. Ed. 43 Vol. 9 N.º 3 Agosto - Noviembre
Correlational
Correlational analysis of analysis of the experimental
the experimental group in the post-test
group in the post-test
The resultsThe
of the correlational
results analysis post-test
of the correlational are post-test
analysis shown in are
Figure 3 with
shown the 3 with the comparison of the K
in Figure
comparison of the K values. Figure 4 shows correlation with the methods used in for
cases 1 andvalues.
2. Figure 4 shows correlation with the methods used in for cases 1 and 2.
(a) (a) (b)
Figure 3. Comparison between K values using the two methods, a) case 1 and b) case 2.
(b)
Figure 4. Distribution of differences in K values in cases 1 and 2.
5
4. DISCUSSION
With the information has been verified that, in all cases, there is a difference of K more significant than
0.1%, It has been established as a maximum allowed value of 0.1% since, with current regulations,
104 https://doi.org/10.17993/3cemp.2020.090343.97-1073C Empresa. Investigación y pensamiento crítico. ISSN: 2254-3376 Ed. 43 Vol. 9 N.º 3 Agosto - Noviembre
K values are rounded to the thousandth, with which any variation above 0.1% will produce different
readjustments.
In road works contracts, there are monthly valuations that on average exceed one million soles, which
means that variations above the 0.1% threshold implied that the readjustments that have been paid were
different from those corresponding
According to the graphs that have been shown, where you can see, the differences are negative, which
means that the readjustments that have been paid have been more than they were due to the contractors.
5. CONCLUSION
The K values obtained, using all the inputs, with a reliability of 95%, are less than those resulting from
the current polynomial formula, the difference in these values reaches a maximum of -0.043, which
means a difference, with regarding the floor value of 0.001, of 4,300% difference, that in terms of
money, in a monthly valuation with a minimum positive difference, however, if the contracting of works
is considered, annually for more than 10 billion, the approximate value of S /. 430’000,000.00 where
the mean of the difference for case 2 corresponds to 0.039.
Likewise, the polynomial formula established by current regulations does not reflect the correct variation
in input prices and to determine the K value, all the inputs that intervene in the road works budget must
be used, so the polynomial formula should be stated as:
Where:
n = The total amount of inputs from the works budget
A = The incidence of i resulting from the value of the input between the total value of the budget minus taxes
105 https://doi.org/10.17993/3cemp.2020.090343.97-1073C Empresa. Investigación y pensamiento crítico. ISSN: 2254-3376 Ed. 43 Vol. 9 N.º 3 Agosto - Noviembre
Iri = The unified index of i one month after recovery
Ioi = The unified index of i per month of the reference value
REFERENCES
Huapaya, H. D., Rodriguez, C., & Esenarro, D. (2020). Comparative analysis of supervised
machine learning algorithms for heart disease detection. 3C Tecnología. Glosas de innovación
aplicadas a la pyme. Edición Especial, Abril 2020, 233-247. http://doi.org/10.17993/3ctecno.2020.
specialissue5.233-247
Levy, J., Pandey, B., Chowdhry, B. S., & Rodriguez, C. (2020). Prologue: Recent trends in computer
science and engineering (RTCSE). 3C Tecnología. Glosas de innovación aplicadas a la pyme. Edición
Especial, Abril 2020, 19-25. http://doi.org/10.17993/3ctecno.2020.specialissue5.19-25
Ministry of Transport. (2015). Statistical Yearbook 2015. Solyani.
Muñoz, D. R. (2004). Manual de estadística. Eumed.net. https://www.researchgate.net/profile/
David_Ruiz-Munoz/publication/267829008_Manual_de_Estadistica_Manual/
links/5821b19708ae5385869fdb6e/Manual-de-Estadistica-Manual.pdf
Navarro, J. D. (2017, March 22). Matemáticas financieras. Valor del dinero en el tiempo. ABCfinanzas.com.
https://www.abcfinanzas.com/matematicas-financieras/valor-del-dinero-en-el-tiempo
Sánchez, J., Vega, H., Guzmán, Y., Rodriguez, C., & Quinto, D. (2020). Data mart design to
improve the decision-making process of the after-sales service. Test Engineering and Management, 83,
15481–15494. http://www.testmagzine.biz/index.php/testmagzine/article/view/6539
Soto, B., Vega, H., Guzmán, Y., Rodriguez, C., & Quinto, D. (2020). Classification algorithm
based on machine learning to optimize athletes talent detection. Test Engineering, 83, 13464–13471.
http://www.testmagzine.biz/index.php/testmagzine/article/view/6067
106 https://doi.org/10.17993/3cemp.2020.090343.97-1073C Empresa. Investigación y pensamiento crítico. ISSN: 2254-3376 Ed. 43 Vol. 9 N.º 3 Agosto - Noviembre 107 https://doi.org/10.17993/3cemp.2020.090343.97-107
You can also read