Survey of Radon Concentrations in the University of Granada in Southern Spain
←
→
Page content transcription
If your browser does not render page correctly, please read the page content below
International Journal of
               Environmental Research
               and Public Health

Article
Survey of Radon Concentrations in the University of Granada
in Southern Spain
Irene Calvente 1,2 , María Isabel Núñez 1,2,3, * , Rachid Chahboun Karimi 4 and Juan Villalba-Moreno 1,4

                                          1   Department of Radiology and Physical Medicine, School of Medicine, University of Granada,
                                              18016 Granada, Spain; irenejaramal@gmail.com (I.C.); jvillal@ugr.es (J.V.-M.)
                                          2   Research Support Unit, Biosanitary Institute of Granada (ibs.GRANADA),
                                              San Cecilio University Hospital of Granada, 18016 Granada, Spain
                                          3   Biopathology and Regenerative Medicine Institute (IBIMER), University of Granada, 18016 Granada, Spain
                                          4   Radiological Protection Service, University of Granada, 18010 Granada, Spain; rachid@ugr.es
                                          *   Correspondence: isabeln@ugr.es; Tel.: +34-958-242-077

                                          Abstract: The objective of this pilot study was to gather and analyze data on radon concentrations
                                          in workplaces in three buildings of Granada University (Southern Spain) constructed in different
                                          centuries. All measurements were made at basement or ground floor level under normal use
                                          conditions except for one space (mineral store), in which measurements were compared between
                                          the door closed and open. Measurements were conducted during different time periods between
                                          October 2013 and March 2019 with a Radon-Scout PLUS portable Radonmonitor. The duration of
                                          continuous recordings at different sites ranged between 42 and 1104 h. Mean accumulated radon

                                   concentrations ranged between 12 and 95 Bq/m3 , below the maximal level of 300 Bq/m3 set by the
                                          World Health Organization (WHO). Relatively high values were recorded in the oldest building
Citation: Calvente, I.; Núñez, M.I.;
                                          (15th century), which was also poorly ventilated. Ventilation appeared to be an important factor in
Chahboun Karimi, R.;
                                          reducing radon levels, especially in areas less exposed to radon, such as Southern Spain.
Villalba-Moreno, J. Survey of Radon
Concentrations in the University of
Granada in Southern Spain. Int. J.
                                          Keywords: radon health effects; indoor radon levels; radon exposure; ventilation
Environ. Res. Public Health 2021, 18,
2885. https://doi.org/10.3390/
ijerph18062885
                                          1. Introduction
Academic Editors: Paul                          Radon is a major component of the ionizing radiation dose received by the general
B. Tchounwou and How-Ran Chao             population, and there is no zero-risk level [1]. Since 1998, radon and disintegration prod-
                                          ucts have been considered human carcinogens (group 1) by the International Agency for
Received: 11 February 2021
                                          Research on Cancer (IARC) of the World Health Organization (WHO) due to their known
Accepted: 9 March 2021
                                          effects on the lung. Exposure to indoor radon is estimated to be the second cause of lung
Published: 11 March 2021
                                          cancer after tobacco smoking [1–4].
                                                Radon (Rn-222) derives from the radium (Ra-226) present in soils (depending on the
Publisher’s Note: MDPI stays neutral
                                          rock type), water (when from underground streams in which the gas is dissolved), or
with regard to jurisdictional claims in
                                          construction materials (e.g., ceramic bricks, concrete, plaster, cement, fly ash) [5]. This
published maps and institutional affil-
                                          radioactive gas tends to concentrate in enclosed spaces such as underground mines, work-
iations.
                                          places, and dwellings. Its concentration in buildings largely depends on the uranium
                                          content of the earth’s crust beneath them, their construction materials, age, and ventila-
                                          tion [1,5,6]. It has been estimated that materials used in construction are responsible for
                                          20% of the total radon recorded in rooms, making a contribution of 5–20 Becquerel/m3
Copyright: © 2021 by the authors.
                                          (Bq/m3 ) [5,7]. The half-life (3.82 days) of radon is sufficiently long for the gas to spread from
Licensee MDPI, Basel, Switzerland.
                                          its source and accumulate in enclosed indoor spaces, posing a potential health threat [8,9].
This article is an open access article
                                                Indoor radon surveys carried out in a sample of 5600 dwellings in Spain between 1990
distributed under the terms and
                                          and 2005, performing measurements in each dwelling for three months, reported a mean
conditions of the Creative Commons
Attribution (CC BY) license (https://
                                          indoor radon exposure of 90 Bq/m3 with a geometric mean of 45 Bq/m3 [10,11]. A pilot
creativecommons.org/licenses/by/
                                          study of indoor radon exposure in workplaces in different Spanish regions found radon
4.0/).
                                          concentrations higher than 300 Bq/m3 in 46% of workplaces in Galicia (n = 58) and in 10.6%

Int. J. Environ. Res. Public Health 2021, 18, 2885. https://doi.org/10.3390/ijerph18062885                   https://www.mdpi.com/journal/ijerph
Int. J. Environ. Res. Public Health 2021, 18, 2885                                                                              2 of 11

                                        of those in Madrid (n = 11). Out of 640 workers evaluated at their workplaces, 19% were
                                        exposed to radon concentrations higher than 300 Bq/m3 and 6.3% to concentrations higher
                                        than 500 Bq/m3 [12].
                                              Epidemiological studies have associated long-term exposure to high concentrations of
                                        radon in workplaces and homes with a higher risk of developing lung cancer [1,11,13], and
                                        this risk was reported to depend on the indoor concentration of radon, the exposure time,
                                        and the degree of building ventilation [14–16]. In addition, a recent epidemiologic review
                                        on residential radon exposure and its impact on lung cancer risk found that, while tobacco
                                        is the main risk factor for lung cancer, residential radon is the first cause in never-smokers
                                        and the second in ever-smokers [17]. A pooled case-control study that only included
                                        never-smokers (523 cases and 892 controls) evidenced an association of residential radon
                                        exposure with the subsequent development of lung cancer. An odds ratio of 1.73 (95% CI:
                                        1.27–2.35) was observed for individuals exposed to ≥200 Bq/m3 compared with those
                                        exposed to ≤100 Bq/m3 . These authors described residential radon as a clear risk factor
                                        for lung cancer in never-smokers [18]. In addition, pooled studies in Europe [4], China [19],
                                        and North America [20] found that a rise of 100 Bq/m3 in the mean indoor concentration
                                        increases the likelihood of developing lung cancer by 10% [6].
                                              Although radon has always been present in the environment we breathe, its concen-
                                        tration in interior spaces has significantly risen over recent years due to the increasing
                                        construction of buildings with improved thermal insulation and less ventilation. These
                                        changes increase energy saving but can lead to dangerous radon concentration levels,
                                        especially in poorly ventilated areas and those in closer contact with land, the main natural
                                        source of this gas, such as basements, semi-basements, and garages [21].
                                              This pilot study was designed to evaluate radon levels in certain workplaces (where
                                        workers spend >8 h/day) within three university buildings in Granada, Southern Spain,
                                        one from the 15th century, one from the 20th century, and one from the 21st century, and to
                                        investigate factors associated with these levels. The aim was to examine the cumulative
                                        concentrations of radon in the air that may potentially be inhaled by the workers.

                                        2. Materials and Methods
                                              Radon measurements were made in the three buildings under study during different
                                        time periods between October 2013 and March 2019 using a Radon-Scout PLUS portable
                                        radon monitor (SARAD GmbH, Dresden, Germany, serial number 390, purchased in 2010)
                                        calibrated at Cantabria University in May 2015. This instrument detects Rn-222 in ambient
                                        air based on a continuous cycle of measurements. An ionization chamber in the device
                                        stores data on concentrations of radon activity and on temperature, relative humidity,
                                        and atmospheric pressure at the time of measurement. All data are stored in an internal
                                        memory with a capacity for up to 2047 records. Measurement periods can be set from 1 to
                                        255 min. It operates autonomously, with no requirement for membrane pumps, external
                                        power supply, or other mechanisms, facilitating its utilization at home or in the workplace.
                                        The device offers continuous data recording for at least four months. The calibration of the
                                        radon monitor was checked before measurements were made.
                                              In the present survey, the duration of continuous recordings at the different sites
                                        ranged between 42 h (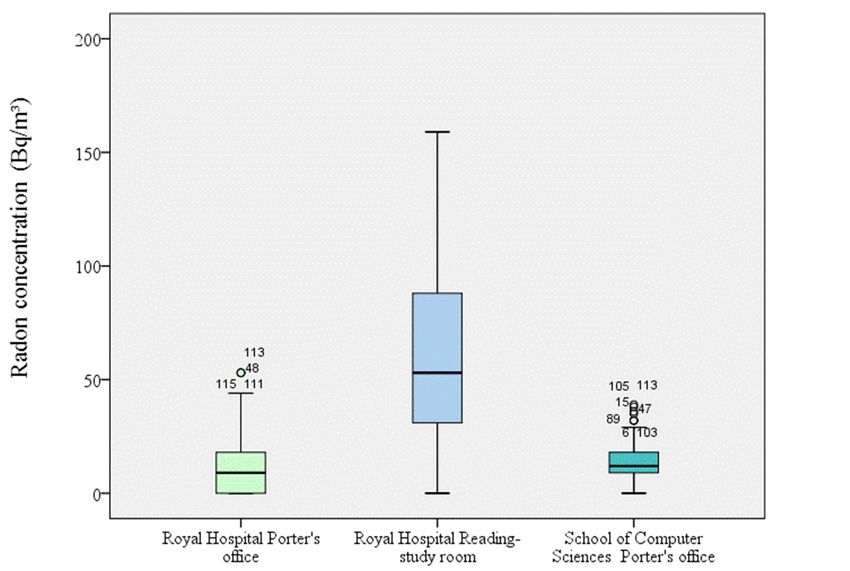
Int. J. Environ. Res. Public Health 2021, 18, 2885                                                                                  3 of 11

                           Table 1. Technical data (Radon-Scout PLUS Radon monitor, SARAD GmbH, Germany).

                Measurement Range                                                        0 . . . 10 MBq/m3
                          Error                                              ±5% within the whole range or smaller
                                                                        1.8 cpm/1000 Bq/m3 (regardless of the humidity)
                      Sensitivity                                   200 Bq/m3 with statistical error of 20% (1 σ) at 1 h interval
                                                                    1000 Bq/m3 with statistical error 90 days
                      Uncertainty                                                           1–2 Bq/m3

                                        2.1. Study Areas
                                             The survey was conducted in seven areas in each of three university buildings, which
                                        were constructed in the 15th century (Royal Hospital), the 20th century (School of Sciences),
                                        and the 21st century (School of Computer Sciences). The Royal Hospital was constructed
                                        with stone (sedimentary rocks) and the other buildings with concrete.

                                        2.2. Statistical Analysis
                                             Descriptive analysis of measurements was performed, computing arithmetic means
                                        with standard deviation (SD) and median values. Microsoft Excel 2010 was used for data
                                        analyses and Microsoft Photoshop Cs6 for graphics.

                                        3. Results
                                              In this study of three university buildings in Southern Spain, radon levels were within
                                        the maximum limits established by the WHO. Levels were higher in the stone building
                                        from the 15th century than in the two concrete buildings constructed in the 20th and the
                                        21st centuries, respectively. Table 2 exhibits the measurements obtained in each building,
                                        including mean (±SD) radon activity concentration, measurement duration, temperature,
                                        humidity, and pressure. Mean concentrations in the buildings ranged from 12 to 95 Bq/m3 ,
                                        with an overall mean of 43 Bq/m3 . The highest mean value, (95 ± 46) Bq/m3 , was recorded
                                        in the reading/study room of the oldest building (Royal Hospital).
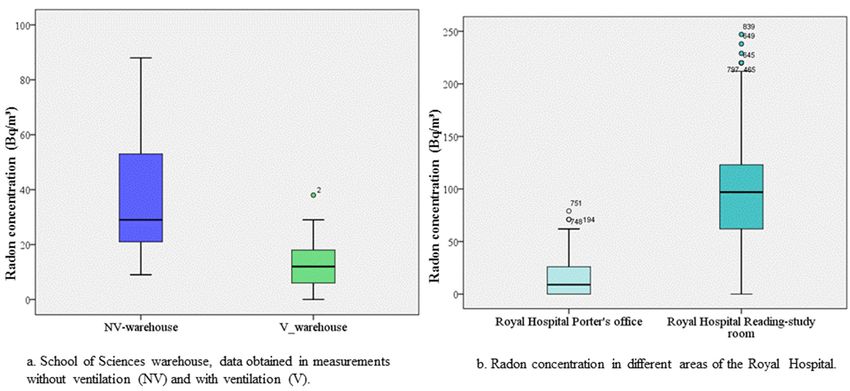
                                              In the School of Sciences, the four areas measured were in the basement, where the
                                        ventilation of each area was only provided by the door. With the doors closed, mean
                                        radon concentrations in the central laboratory (70 ± 59) Bq/m3 were 1.9-fold higher than
                                        in the warehouse (37 ± 21) Bq/m3 , 1.8-fold higher than in the maintenance room (40 ± 27)
                                        Bq/m3 , and 2-fold higher than in the documentation-archive room (32 ± 21) Bq/m3 . This
                                        is in part because the detector in the central laboratory is immediately in front of the door
                                        to the room containing uranium.
                                              Among the areas measured on the ground floor in the three university buildings,
                                        radon concentrations were more than five-fold higher in the reading/study room of the
                                        Royal Hospital (95 ± 46) Bq/m3 than in the Porter’s offices in the same building (17 ± 17)
                                        Bq/m3 and the School of Computer Sciences (14 ± 8) Bq/m3 (Figure 1). Overall, radon
                                        concentrations were around two-fold higher in areas located in the basement (School
                                        of Sciences) than in those on the ground floor (Royal Hospital and School of Computer
                                        Sciences). It has previously been reported that concentrations of this gas are almost two-fold
                                        higher on the second floor of buildings than on lower floors [6]. Mean radon concentrations
                                        were higher in the 15th century building than in the more modern constructions, although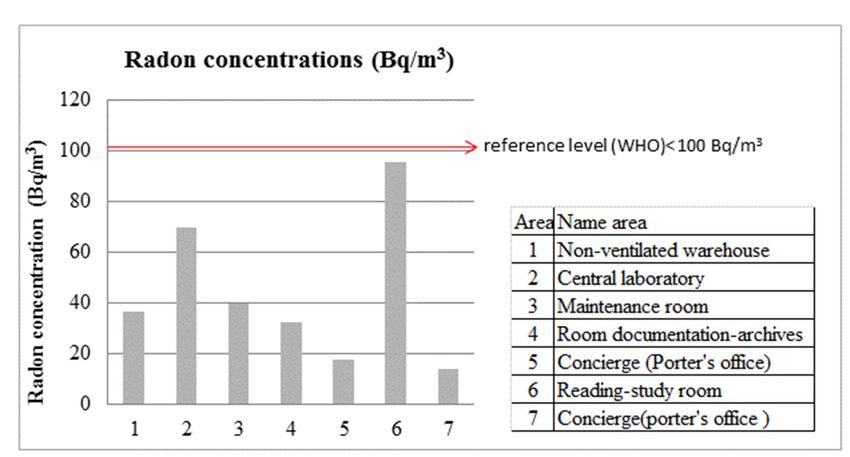
concentrations were around two-fold higher in areas located in the basement (Sc
Sciences) than in than
Sciences) thoseinon the ground
those floor (Royal
on the ground floor Hospital and School
(Royal Hospital and of Computer
School of Com
Sciences). Sciences). It has previously been reported that concentrations of this gas are two-
It has previously been reported that concentrations of this gas are almost almo
fold higher fold on higher the on second floor offloor
the second buildings than onthan
of buildings lower on floors
lower [6].floorsMean[6]. radon
Mean
Int. J. Environ. Res. Public Health 2021, 18, 2885 4 of 11
concentrationsconcentrationswere higher in the 15th
were higher in thecentury buildingbuilding
15th century than inthan the more
in themodernmore m
constructions, although
constructions, this may
although also
this may be also
influenced by differences
be influenced in their in
by differences ventilation
their ven
(Figure (Figure2). Lee 2). et Lee
al. found
et al. nofoundstatistically significant
no statistically correlation
significant betweenbetween
correlation radon
this may also be influenced by differences in their ventilation (Figure 2). Lee et al. found no
concentrationsconcentrationsand year
statistically and ofyear
construction,
significant correlation although
of construction,
between European
radonalthough reference
European
concentrations and levels differ
reference
year of construction, levels
3
betweenbetween new buildings
although (200
European Bq/m 3) and
reference existing
levels differ buildings
between new (400
buildings Bq/m
(200
new buildings3 (200 Bq/m ) and existing buildings (400 Bq/m ) [9,22].
3 3) [9,22].
Bq/m ) and3existing
buildings (400 Bq/m ) [9,22].
Figure Figure 1. Mean
1.Figure
Mean indoor
indoor
1. Mean air airradon
radonair
indoor concentrations
concentrationsat University of Granada
at University
radon concentrations of(Southern
Granada
at University ofSpain).
(Southern
Granada Spain). Spain).
(Southern
Figure
Figure 2.Figure
2. Radon Radon
in indoor2.in
air indoor
Radon inair in(Royal
indoor
in 15th century 15th century
airHospital) (Royal
in 15thand
century Hospital)
(Royal
21st century and 21st and
Hospital)
(School Computercentury (School
centuryComputer
21stbuildings.
Sciences) (School Com
Sciences)Sciences)
buildings.
buildings.Int. J. Environ. Res. Public Health 2021, 18, 2885 5 of 11
Table 2. Radon concentrations.
University Building Radon (Bq/m3 ) T (◦ C) % RH P (mbar) Radon
Sample Time Data Total Exposure
Study Area Floor AM SD P50 P90 Min Max AM AM AM
(Hours) Recorded (Bqh/m3 )
NV-warehouse basement 151 52 37 21 29 70 9 88 17 45 947 5629
V-warehouse basement 162 54 12 8 12 23 0 38 14 62 948 1958
School of Sciences Central laboratory basement 1104 368 70 59 47 173 0 265 15 54 0 76,788
Maintenance room basement 42 14 40 27 29 69 9 109 17 45 947 1571
Documentation-archives room basement 214 214 32 21 26 62 0 97 20 44 951 6890
Porter’s office ground 984 984 17 17 9 36 0 115 20 36 951 16,957
Royal Hospital
Reading-study room ground 842 842 95 46 97 150 0 247 22 47 942 80,293
School of Computer
Porter’s office ground 360 120 14 8 12 24 0 39 23 38 943 4793
Sciences
NV: non-ventilated; V: ventilated; AM: arithmetic mean; SD: standard deviation; P50: percentile 50; P90: percentile 90; Min: minimum; Max: maximum; T: temperature; RH: relative humidity; P: pressure.Int. J. Environ. Res. Public Health 2021, 18, x FOR PEER REVIEW 6 of 11
Int. J. Environ. Res. Public Health 2021, 18, 2885 6 of 11
Decontamination by Ventilation
In the warehouse
Decontamination of the School of Sciences, the mean radon concentration was (37 ±
by Ventilation
21) Bq/m with
In3the the door
warehouse closed
of the Schoolversus (12 the
of Sciences, ± 8)mean
Bq/m 3 with the door open (for 62 h),
radon concentration was (37 ± 21)
Bq/m3 with
highlighting the
theimportance
door closed of ventilation
versus (12 ± 8) to 3 with
reduce
Bq/m indoor radon
the door openexposure
(for 62 h),(Figure
high- 3).
Leelighting the importance
et al. observed of ventilation
a 1.7-fold reductiontoinreducemean indoor radon aexposure
levels when room was (Figure 3). Lee(with
ventilated
et al.
open observed
windows) fora 2–3
1.7-fold
h and reduction
reportedinamean levels when
statistically a roomcorrelation
significant was ventilated (withradon
between
open windows) for 2–3 h and reported a statistically significant correlation
levels and ventilation duration [9]. However, Dieguez-Elizondo et al. concluded that between radon
levels and ventilation duration [9]. However, Dieguez-Elizondo et al. concluded that
natural ventilation alone is not sufficient to keep radon concentrations below acceptable
natural ventilation alone is not sufficient to keep radon concentrations below acceptable
limits and that forced ventilation is required, although natural ventilation was considered
limits and that forced ventilation is required, although natural ventilation was considered
adequate
adequate byby Garcia-Talavera
Garcia-Talavera et al. when
et al. whenradon radonconcentrations
concentrations were
were below
below the WHO
the WHO limit limit
of 100 Bp/m
of 100 3
Bp/m [6,14]. Figure
3 [6,14]. 3 shows
Figure 3 shows that indoor
that indoorradon
radonconcentrations
concentrationswerewere higher
higher inin non-
ventilated versusversus
non-ventilated ventilated areasareas
ventilated in the
in present study.
the present study.
Figure 3.Figure
(a) and (b) Comparison
3. (a,b) of radon
Comparison of radonconcentrations
concentrationsas as a function
a function ofpresence
of the the presence
or theor the absence
absence of ventilation.
of ventilation.
4. Discussion
4. Discussion
There
There hashasbeenbeenlittle
littleresearch
research onon indoor
indoorradon
radonconcentrations
concentrations in Spanish workplaces.
in Spanish workplaces.
No data are available on radon concentrations in workplaces in the University
No data are available on radon concentrations in workplaces in the University of Granada, of Granada,
prompting this pilot study in three different building of the institution. Mean accumulated
prompting this pilot study in three different building of the institution. Mean accumulated
radon concentrations detected in this study ranged between 12 and 95 Bq/m3 ,3 below
radon concentrations detected in this study ranged between 12 and 95 Bq/m , below the
the maximal level set by the WHO. The highest radon concentrations were found in the
maximal level set by
Royal Hospital, an the
old WHO.
buildingThe madehighest radon
of stone, concentrations
in agreement were found
with previous in the
findings onRoyal
Hospital, an oldofbuilding
the influence stone-based made of stone,
interior in agreement
and exterior buildingwith previous
materials findings
on indoor radonon the
influence
concentrations [23]. The lowest indoor radon values were observed in ventilated areas,radon
of stone-based interior and exterior building materials on indoor
concentrations
regardless of the [23].
ageThe lowest
of the indoor radon values were observed in ventilated areas,
building.
regardlessAmong
of thetheage
seven
of areas investigated in this study, the concentration of this radioactive
the building.
gas ranged thebetween 0–20 3 in two areas and between 21 and 60 Bq/m3 in three
Bq/minvestigated
Among seven areas 3
in this study, the concentration of this
areas and was above 61 Bq/m in the remaining two (Figure 1). The wide deviation in 3
radioactive gas ranged between 0–20 Bq/m3 in two areas and between 21 and 60 Bq/m in
results can be attributed to various 3factors, including differences between day and night
three areas and was above 61 Bq/m in the remaining two (Figure 1). The wide deviation
in these long-term measurements, varied ventilation conditions (opened/closed doors),
in results can be attributed
and variations in pressureto andvarious factors,
temperature includingPotentially
conditions. differences betweenfactors
influential day andnotnight
in these long-term
considered in this measurements,
pilot study include varied ventilation conditions
the meteorological (opened/closed
conditions, which doors),
can affect the
andemission
variations in pressure
of radon by the land,andan temperature conditions.
especially important radonPotentially influential
source for ground floorfactors
areas not
considered in this
such as those pilothere.
studied study include
Further the meteorological
limitations conditions,
of this preliminary whichthe
study include can affect
lack of the
data for each building during different seasons of the year.
emission of radon by the land, an especially important radon source for ground floor areas
such as those studied here. Further limitations of this preliminary study include the lack
of data for each building during different seasons of the year.
National surveys and other investigations have described the range and the
distribution of indoor radon levels in many European countries [10,24], observing meanInt. J. Environ. Res. Public Health 2021, 18, x FOR PEER REVIEW 7 of
Int. J. Environ. Res. Public Health 2021, 18, 2885 7 of 11
values ranging from 20 to 140 Bq/m3 and geometric means ranging from 25 to 110 Bq/
[24]. García-Talavera
National surveys andetotheral. (2013) found that
investigations havethe areas most
described exposed
the range and theto radon in Spain a
distribu-
in of
tion northwestern
indoor radon and levelswestern
in manyparts of the
European country,
countries withobserving
[10,24], a lesser mean
exposure
values in southe
ranging from 20 to 140 Bq/m 3 and geometric means ranging from 25 to 110 Bq/m3 [24].
regions (Figure 4). However, other regions are not classified as either radon-prone or no
García-Talavera
prone because et of
al. inadequate
(2013) foundsample
that thesizes,
areas as
mostin exposed
the casetoofradon in Spainthe
Andalusia, aresetting
in of t
northwestern and western parts of the country, with a lesser exposure in southern regions
present study [6]. A case-control study in Galicia, a radon-prone area of northwest Spa
(Figure 4). However, other regions are not3 classified as either radon-prone or non-prone 3
found radon levels above 148 Bq/m in 21.3% of the homes and above 200 Bq/m in 12
because of inadequate sample sizes, as in the case of Andalusia, the setting of the present
[25].[6].AAstudy
study of indoor
case-control study in concentrations using etched
Galicia, a radon-prone track dosimeters
area of northwest Spain, found described
geometric mean concentration
3 of (285 ± 2.5) Bq/m 3 in Santiago de Compostela,
radon levels above 148 Bq/m in 21.3% of the homes and above 200 Bq/m in 12% [25]. 3 a city in t
A same
study region;
of indoortheconcentrations
authors observed usingthat radon
etched concentrations
track were higher
dosimeters described during the nig
a geometric
andconcentration
mean 2.3-fold higher during
of (285 Bq/m3 in than
± 2.5)holidays working
Santiago days, buta city
de Compostela, theyinfound
the sameno season
region; the authors observed that radon concentrations were higher during
variations in concentrations [26]. Another study of 600 dwellings in Galicia describ the night and
2.3-fold
radonhigher
levelsduring holidays
exceeding 200than working
Bq/m days,21.9%,
3 in 7.6%, but theyand
found no seasonal
68.5% of houses variations
in areas of lo
in concentrations [26]. Another study of 600 dwellings in Galicia described radon levels
medium, and high radiation exposure, respectively [27]. High concentrations of indo
exceeding 200 Bq/m3 in 7.6%, 21.9%, and 68.5% of houses in areas of low, medium, and
radon have also been found in workplaces in regions that are not characterized as rado
high radiation exposure, respectively [27]. High concentrations of indoor radon have also
prone
been found[12].
in workplaces in regions that are not characterized as radon-prone [12].
Figure 4.4.Map
Figure Mapofofexposure
exposureto radon-CSN
to radon-CSN(Spanish Nuclear
(Spanish Safety Council).
Nuclear The province
Safety Council). of GranadaofisGranada
The province demarcated with a
is demarcated with
ablack
black line,
line, andand
the the capital
capital (Granada)
(Granada) is indicated
is indicated with dot.
with a black a black dot. http://www.csn.es/en/mapa-de-exposicion-al-radon-
http://www.csn.es/en/mapa-de-exposicion-al-radon-
en-espana (accessed
en-espana (accessed onon
2222 April
April 2019).
2019).
Other studies have revealed the influence of geological factors on radon risk
dwellings in northern Portugal. Winter measurements showed that average indoor rad
concentrations were 85, 220, and 430 Bq/m3 in dwellings built on metasediments, A
granite, and AT2 granite, respectively [28]. Winter measurements by the same autho
in a biotite granite region showed levels over 400 Bq/m3 in 62.6% of studied dwellings [2Int. J. Environ. Res. Public Health 2021, 18, 2885 8 of 11
Other studies have revealed the influence of geological factors on radon risk in
dwellings in northern Portugal. Winter measurements showed that average indoor radon
concentrations were 85, 220, and 430 Bq/m3 in dwellings built on metasediments, AT1
granite, and AT2 granite, respectively [28]. Winter measurements by the same authors in a
biotite granite region showed levels over 400 Bq/m3 in 62.6% of studied dwellings [29]. A
cross-sectional study in a hydrothermal area (Furnas volcano, Azores, Portugal) found a
mean indoor radon concentration of 115 Bq/m3 , above the limit recommended by the WHO
(100 Bq/m3 ) [1]. This was attributed by the authors to the lack of ventilation, exacerbated
by the fact that measurements were made in the winter [30,31]. Among non-European
countries, radon concentrations above the reference level were recorded in 51% of dwellings
studied in bauxite-bearing areas of southern Adamawa in Cameroon [32]. In an inves-
tigation in a rural region of Southern Serbia, Žunić et al. reported mean indoor radon
levels ranging between 39 and 202 Bq/m3 in schools and between 42 and 101 Bq/m3 in
dwellings [33]. Mean findings were generally lower in the present study, although they
were higher than might have been expected given the geology of the area and previous
findings of lower levels in Southern Spain (Figure 1).
This study was not designed to evaluate the impact of indoor radon exposure on the
health of staff in the workplaces under study. Nevertheless, various authors have proposed
a link between this type of exposure and the risk of lung cancer [17,18]. Barros-Dios
et al. found a more than two-fold increase in the risk of lung cancer at radon exposure
levels above 37 Bq/m3 [25]. However, it is not yet clear whether radon exposure causes
diseases other than lung cancer. A study of 28,557 participants in South Korea found that
significantly higher indoor radon exposure was experienced by those who suffered from
a stroke, which was more frequent with increased indoor radon levels (p < 0.001). The
authors reported that indoor radon levels increased the risk of stroke after adjusting for
potential confounding factors (OR: 1.004 (95 CI: 1.001–1.007), p = 0.010), and they observed
an association between indoor radon exposure over 100 Bq/m3 and this disease (OR: 1.242
(95 CI: 1.069–1.444), p = 0.005) [30]. A prospective trial in the USA found a significant
association between radon exposure and mortality from chronic obstructive pulmonary
disease (COPD) [34]. However, the relationship of this exposure to diseases other than
lung cancer, especially leukemia and COPD, remains controversial [35–38]. The United
Nations Scientific Committee on the Effects of Atomic Radiation (UNSCEAR) and the
International Commission on Radiological Protection (ICRP) described an increase of 0.16
in excess relative risk per 100 Bq/m3 [36]. Levels above 148 Bq/m3 were described as
requiring action by the US Environmental Protection Agency (USEPA) [39] in 2012, and
levels above 100 Bq/m3 were specified by the WHO [1]. A European Directive in 2013
set an annual exposure limit of 300 Bq/m3 for housing and closed spaces [22]. There has
been a demand for strong regulations to avoid this exposure, given that an extremely small
amount of radon in the air can be highly hazardous to health [14]. Given variations among
published protocols or guidelines for measuring radon [40–42], there appears to be a need
for a national plan to gather the endemic characteristics of each region in relation to its
geological features, meteorological conditions, and the types of construction and materials
used. Indoor radon exposure levels are not usually taken into account by clinicians. In fact,
no lung cancer risk score (predicting incidence or mortality) includes radon as a variable.
Further studies are needed to find out the molecular pathways of radon that cause lung
cancer and to explore the involvement of this radioactive gas in the development of other
diseases. It is necessary to increase awareness among administrations, health professionals,
and the general population about the risks of exposure, especially in radon-prone areas [17].Int. J. Environ. Res. Public Health 2021, 18, 2885 9 of 11
5. Conclusions
Among its 17 Sustainable Development Goals, the United Nations called for more
indoor radon measurements to estimate the exposure of general populations to this ra-
dioactive gas and evaluate its health effects. It is important for a National Radon Plan
to be developed in Spain as in the majority of European countries. In the meantime, we
consider that the population should be informed of the health risks associated with expo-
sure to radon and its possible accumulation in indoor spaces, describing the factors that
influence its concentration. These include type of exposure source, geographic localization,
age of buildings, height of floor above ground, insulation level, and ventilation practices,
among others. In the present study, ventilation appeared as an important protective factor,
although only limited data were gathered on this variable. Because this gas is odorless,
surveys of this type are essential to detect and monitor its presence and ensure that workers
are not exposed to this hazard, for which there is no zero-risk level. Reductions in radon
exposure can be expected with the implementation of energy-saving policies for complete
thermal insulation using appropriate construction materials and improving ventilation
measures. A more comprehensive study is needed to verify and expand the present find-
ings in order to obtain annual average values in accordance with Instruction IS-33 [43] on
workplace exposure to radon.
Author Contributions: Conceptualization, I.C., M.I.N. and J.V.-M.; methodology, I.C. and R.C.K.;
formal analysis, I.C.; Writing—Original draft preparation, I.C. and R.C.K.; Writing—Review and
editing, I.C., M.I.N. and J.V.-M.; supervision, I.C., J.V.-M. and M.I.N. All authors have read and agreed
to the published version of the manuscript.
Funding: This research received no external funding.
Data Availability Statement: Not applicable.
Acknowledgments: The authors are grateful to Richard Davies for editorial assistance.
Conflicts of Interest: The authors declare no conflict of interest.
References
1. WHO (World Health Organization). WHO Handbook on Indoor Radon; A Public Health Perspective; World Health Organiza-
tion: Geneva, Switzerland, 2009; Available online: http//www.whqibdoc.who.int/publications/2009/9789241547673_eng.pdf
(accessed on 14 April 2019).
2. Chen, J. Lifetime lung cancer risks associated with indoor radon exposure based on various radon risk models for Canadian
population. Radiat. Prot. Dosim. 2016, 173, 252–258. [CrossRef] [PubMed]
3. ICRP (International Commission on Radiological Protection). Lung cancer risk from radon and progeny and statement on radon.
Ann. ICRP 2010, 40, 115.
4. Darby, S.; Hill, D.; Deo, H.; Auvinen, A.; Barros-Dios, J.M.; Baysson, H.; Bochicchio, F.; Falk, R.; Farchi, S.; Figueiras, A.; et al.
Residential radon and lung cancer—Detailed results of a collaborative analysis of individual data on 7148 persons with lung
cancer and 14 208 persons without lung cancer from 13 epidemiologic studies in Europe Scand. J. Work Environ. Health 2006, 32,
1–84.
5. CSN (Consejo de Seguridad Nuclear). Colección Informes Técnicos; España, Referencia INT-04.20; Consejo de Seguridad Nuclear:
Madrid, Spain, 2010.
6. García-Talavera, M.; García-Peréz, A.; Rey, C.; Ramos, L. Mapping radon-prone areas using γ-radiation dose rate and geological
information. J. Radiol. Prot. 2013, 33, 605–620. [CrossRef] [PubMed]
7. Roserens, G.A.; Johner, H.U.; Piller, G.; Imbaumgarten, P. Swiss Radon Handbook; Swiss Federal Office of Public Health: Berna,
Switzerland, 2000.
8. Kurnaz, A.; Küçükömeroğlu, B.; Çevik, U.; Çelebi, N. Radon level and indoor gamma doses in dwellings of Trabzon, Turkey.
Appl. Radiat. Isot. 2011, 69, 1554–1559. [CrossRef] [PubMed]
9. Lee, C.M.; Kwon, M.H.; Kang, D.R.; Park, T.H.; Park, S.H.; Kwak, J.E. Distribution of radon concentrations in child-care facilities
in South Korea. J. Environ. Radioact. 2017, 167, 80–85. [CrossRef]
10. WHO Guidelines for Indoor Air Quality: Selected Pollutants; WHO Regional Office for Europe coordinated the development of these
WHO guidelines; The WHO European Centre for Environment and Health, Bonn Office: Bonn, Germany, 2010.
11. UNSCEAR (United Nations Scientific Committee on the Effects of Atomic Radiation). Effects of Ionizing Radiation. UNSCEAR
2006 Report. In Annex E: Sourcesto-Effects Assessment for Radon in Homes and Workplaces; United Nations: New York, NY, USA,
2009; Volume II, Available online: http//www.unscear.org (accessed on 4 February 2021).Int. J. Environ. Res. Public Health 2021, 18, 2885 10 of 11
12. Ruano-Raviña, A.; Narocki, C.; López Jacob, M.J.; García-Oliver, A.; Calle, M.C.; Peón, J.; Barrios-Dios, J.M. Indoor radon in
Spanish workplaces. A pilot study before the introduction of the European Directive 2013/59/Euratom. Gac. Sanit. 2019, 33,
563–567. [CrossRef] [PubMed]
13. WHO (World Health Organization). Radon and Health. Fact Sheet No. 291. 2005. Available online: http//www.who.int/
mediacentre/factsheets/fs291/en/index.html (accessed on 4 February 2021).
14. Dieguez-Elizondo, P.M.; Gil-Lopez, T.; O’Donohoe, P.G.; Castejon-Navas, J.; Galvez-Huerta, M.A. An analysis of the radioactive
contamination due to radon in a granite processing plant and its decontamination by ventilation. J. Environ. Radioact. 2017, 167,
26–35. [CrossRef]
15. Lázár, I.; Tóth, E.; Marx, G.; Cziegler, I.; Köteles, G.J. Effects of residential radon on cancer incidence. J. Radioanal. Nucl. Chem.
2003, 258, 519–524. [CrossRef]
16. Neuberger, J.S.; Gesell, T.F. Residential radon exposure and lung cancer: Risk in nonsmokers. Health Phys. 2002, 83, 1–18.
[CrossRef]
17. Lorenzo-González, M.; Torres-Durán, M.; Barbosa-Lorenzo, R.; Provencio-Pulla, M.; Barros-Dios, J.M.; Ruano-Ravina, A. Radon
exposure: A major cause of lung cancer. Expert Rev. Respir. Med. 2019, 13, 839–850. [CrossRef] [PubMed]
18. Lorenzo-González, M.; Ruano-Ravina, A.; Torres-Durán, M.; Kelsey, K.T.; Provencio, M.; Parente-Lamelas, I.; Leiro-Fernández, V.;
Vidal-García, I.; Castro-Añón, O.; Martínez, C.; et al. Lung cancer and residential radon in never-smokers: A pooling study in the
Northwest of Spain. Environ. Res. 2019, 172, 713–718. [CrossRef]
19. Lubin, J.H.; Wang, Z.Y.; Boice, J.D.; Xu, Z.Y.; Blot, W.J.; De Wang, L.; Kleinerman, R.A. Risk of lung cancer and residential radon in
China: Pooled results of two studies. Int. J. Cancer 2004, 109, 132–137. [CrossRef] [PubMed]
20. Krewski, D.; Lubin, J.H.; Zielinski, J.M.; Alavanja, M.; Catalan, V.S.; William Field, R.; Klotz, J.B.; Létourneau, E.G.; Lynch, C.F.;
Lyon, J.L.; et al. A Combined Analysis of North American Case-Control Studies of Residential Radon and Lung Cancer. J. Toxicol.
Environ. Health A 2007, 69, 533–597. [CrossRef]
21. Piedecausa, B. Radon measurement in underground workspace of the Campus of the University of Alicante. Inf. Construcción
2013, 531, 301–310. [CrossRef]
22. 90/143/Euratom—EUR-Lex—Europa EU. Comisión de las Comunidades Europeas. In Recomendación de la Comisión de 21
de Febrero de 1990 Relativa a la Protección de la Población Contra Peligros de Una Exposición al Radón en el Interior de Edificios
(90/143/Euratom); European Commission: Brussels, Belgium, 1990; Volume L80, pp. 26–28.
23. Barros-Dios, J.M.; Barreiro, M.A.; Ruano-Ravina, A.; Figueiras, A. Exposure to residential radon and lung cancer in Spain: A
population-based case-control study. Am. J. Epidemiol. 2002, 156, 548–555. [CrossRef]
24. Dubois, G. An Overview of Radon Surveys in Europe; Report EUR 21892 EN; European Commission: Brussels, Belgium, 2005.
25. Barros-Dios, J.M.; Ruano-Raviña, A.; Gastelu-Iturri, J.; Figueiras, A. Factors underlying residential radon concentration: Results
from Galicia, Spain. Environ. Res. 2007, 103, 185–190. [CrossRef]
26. Cortina, D.; Durán, I.; Llerena, J.J. Measurements of indoor radon concentrations in the Santiago de Compostela area. J. Environ.
Rad. 2008, 99, 1583–1588. [CrossRef]
27. Quindós, L.S.; Fernández, P.L.; Sainz, C.; Fuente, I.; Nicolás, J.; Quindós, L.; Arteche, J. Indoor radon in a Spanish region with
different gamma exposure levels. J. Environ. Radioact. 2008, 99, 1544–1547. [CrossRef]
28. Martins, L.M.O.; Gomes, M.E.P.; Neves, L.J.P.F.; Pereira, A.J.S.C. The influence of geological factors on radon risk in groundwater
and dwellings in the region of Amarante (Northern Portugal). Environ. Earth Sci. 2013, 68, 733–740. [CrossRef]
29. Martins, L.M.O.; Gomes, M.E.P.; Teixeira, R.J.S.; Pereira, A.J.S.C.; Neves, L.J.P.F. Indoor radon risk associated to post-tectonic
biotite granites from Vila Pouca de Aguiar pluton, northern Portugal. Ecotoxicol. Environ. Saf. 2016, 133, 164–175. [CrossRef]
[PubMed]
30. Kim, S.H.; Park, J.M.; Kim, H. The prevalence of stroke according to indoor radon concentration in South Koreans: Nationwide
cross section study. Medicine 2020, 99, e18859. [CrossRef] [PubMed]
31. Linhares, D.P.S.; Garcia, P.V.; Silva, C.; Barroso, J.; Kazachkova, N.; Pereira, R.; Lima, M.; Camarinho, R.; Ferreira, T.; dos Santos
Rodrigues, A. DNA damage in oral epithelial cells of individuals chronically exposed to indoor radon (222Rn) in a hydrothermal
area. Environ. Geochem. Health 2018, 40, 1713–1724. [CrossRef]
32. Saïdou Modibo, O.B.; Joseph Emmanuel, N.N.I.; German, O.; Michaux, K.N.; Abba, H.Y. Indoor Radon Measurements Using
Radon Track Detectors and Electret Ionization Chambers in the Bauxite-Bearing Areas of Southern Adamawa, Cameroon. Int. J.
Environ. Res. Public Health 2020, 17, 6776. [CrossRef]
33. Žunić, Z.S.; Bossew, P.; Bochicchio, F.; Veselinovic, N.; Carpentieri, C.; Venoso, G.; Antignani, S.; Simovic, R.; Ćurguz, Z.;
Udovicic, V.; et al. The relation between radon in schools and in dwellings: A case study in a rural region of Southern Serbia. J.
Environ. Radioact. 2017, 167, 188–200. [CrossRef]
34. Kang, J.K.; Seo, S.; Jin, Y.W. Health Effects of Radon Exposure. Yonsei Med. J. 2019, 60, 597–603. [CrossRef]
35. Conde-Sampayo, A.; Lorenzo-González, M.; Fernández-Villar, A.; Barros-Dios, J.M.; Ruano-Ravina, A. Exposure to Residential
Radon and COPD: A Systematic Review. Int. J. Chron. Obstruct. Pulmon. Dis. 2020, 15, 939–948. [CrossRef]
36. Beck, T.R. Risks and radiation doses due to residential radon in Germany. Radiat. Prot. Dosim. 2017, 175, 466–472. [CrossRef]
[PubMed]
37. Turner, M.C.; Krewski, D.; Chen, Y.; Pope, C.A.; Gapstur, S.M.; Thun, M.J. Radon and COPD mortality in the American Cancer
Society Cohort. Eur. Respir. J. 2012, 39, 1113–1119.Int. J. Environ. Res. Public Health 2021, 18, 2885 11 of 11
38. Barbosa-Lorenzo, R.; Ruano-Ravina, A.; Ramis, R.; Aragonés, N.; Kelsey, K.T.; Carballeira-Roca, C.; Barros-Dios, J.M. Residential
radon and COPD. An ecological study in Galicia, Spain. Int. J. Radiat. Biol. 2016, 93, 222–230. [CrossRef] [PubMed]
39. Organization for Economic Cooperation and Development. Metrology and Monitoring of Radon, Thoron and Their Daughter Products;
OECD Publications: Paris, France, 1985; pp. 1–148.
40. National Council on Radiation Protection and Measurements. Measurement of Radon and Radon Daughters in Air, NRCP;
Report No. 97; Bethesda: Bethesda, MD, USA, 1988; pp. 1–174.
41. SSK. Leitfaden zur Messung von Radon, Thoron und Ihren Zerfallsprodukten; Veröffentlichungen der SSK Bd. 47; Urban & Fischer:
München, Germany, 2002.
42. United States Environmental Protection Agency. Indoor Radon and Radon Decay Product Measurement Device Protocols; 402-R-92-004;
USEPA Publication: Washington, DC, USA, 1992; Available online: http://www.radon.com/pubs/devprot1.html (accessed on
22 April 2019).
43. Instruction IS-33, of 21 December 2011, of the Nuclear Safety Council, on Radiological Criteria for Protection Against Exposure to Natural
Radiation; nº 22; State Official Newsletter; NSCS (Nuclear Safety Council): Madrid, Spain, 2011; pp. 6833–6838.You can also read


