Tactical Optimism and Pessimism for Deep Reinforcement Learning
←
→
Page content transcription
If your browser does not render page correctly, please read the page content below
Tactical Optimism and Pessimism for Deep
                                                            Reinforcement Learning

                                                            Ted Moskovitz                             Jack Parker-Holder
                                                           Gatsby Unit, UCL                           University of Oxford
                                                        ted@gatsby.ucl.ac.uk                       jackph@robots.ox.ac.uk
arXiv:2102.03765v3 [cs.LG] 31 May 2021

                                                            Aldo Pacchiano                                Michael Arbel
                                                    University of California, Berkeley                  Gatsby Unit, UCL
                                                      pacchiano@berkeley.edu                       michael.n.arbel@gmail.com

                                                                                 Michael I. Jordan
                                                                          University of California, Berkeley
                                                                            jordan@cs.berkeley.edu

                                                                                      Abstract

                                                  In recent years, deep off-policy actor-critic algorithms have become a dominant
                                                  approach to reinforcement learning for continuous control. One of the primary
                                                  drivers of this improved performance is the use of pessimistic value updates to
                                                  address function approximation errors, which previously led to disappointing
                                                  performance. However, a direct consequence of pessimism is reduced exploration,
                                                  running counter to theoretical support for the efficacy of optimism in the face of
                                                  uncertainty. So which approach is best? In this work, we show that the most
                                                  effective degree of optimism can vary both across tasks and over the course of
                                                  learning. Inspired by this insight, we introduce a novel deep actor-critic framework,
                                                  Tactical Optimistic and Pessimistic (TOP) estimation, which switches between
                                                  optimistic and pessimistic value learning online. This is achieved by formulating
                                                  the selection as a multi-arm bandit problem. We show in a series of continuous
                                                  control tasks that TOP outperforms existing methods which rely on a fixed degree
                                                  of optimism, setting a new state of the art in challenging pixel-based environments.
                                                  Since our changes are simple to implement, we believe these insights can easily be
                                                  incorporated into a multitude of off-policy algorithms.

                                         1   Introduction

                                         Reinforcement learning (RL) has begun to show significant empirical success in recent years, with
                                         value function approximation via deep neural networks playing a fundamental role in this suc-
                                         cess [Mnih et al., 2015, Silver et al., 2016, Badia et al., 2020]. However, this success has been
                                         achieved in a relatively narrow set of problem domains, and an emerging set of challenges arises
                                         when one considers placing RL systems in larger systems. In particular, the use of function approxi-
                                         mators can lead to a positive bias in value computation [Thrun and Schwartz, 1993], and therefore
                                         systems that surround the learner do not receive an honest assessment of that value. One can attempt
                                         to turn this vice into a virtue, by appealing to a general form of the optimism-under-uncertainty
                                         principle—overestimation of the expected reward can trigger exploration of states and actions that
                                         would otherwise not be explored. Such exploration can be dangerous, however, if there is not a clear
                                         understanding of the nature of the overestimation.

                                         Preprint. Under review.
This tension has not been resolved in the recent literature on RL approaches to continuous-control
problems. On the one hand, some authors seek to correct the overestimation, for example by using the
minimum of two value estimates as a form of approximate lower bound [Fujimoto et al., 2018]. This
approach can be seen as a form of pessimism with respect to the current value function. On the other
hand, Ciosek et al. [2019] have argued that the inherent optimism of approximate value estimates is
actually useful for encouraging exploration of the environment and/or action space. Interestingly,
both sides have used their respective positions to derive state-of-the-art algorithms. How can this be,
if their views are seemingly opposed? Our key hypothesis is the following:
The degree of estimation bias, and subsequent efficacy of an optimistic strategy, varies as a function
of the environment, the stage of optimization, and the overall context in which a learner is embedded.
This hypothesis motivates us to view optimism/pessimism as a spectrum and to investigate procedures
that actively move along that spectrum during the learning process. We operationalize this idea by
measuring two forms of uncertainty that arise during learning: aleatoric uncertainty and epistemic
uncertainty. These notions of uncertainty, and their measurement, are discussed in detail in Section 5.1.
We then further aim to control the effects of these two kinds of uncertainty, making the following
learning-theoretic assertion:
When the level of bias is unknown, an adaptive strategy can be highly effective.
In this work, we investigate these hypotheses via the development of a new framework for value
estimation in deep RL that we refer to as Tactical Optimism and Pessimism (TOP). This approach
acknowledges the inherent uncertainty in the level of estimation bias present, and rather than adopt a
blanket optimistic or pessimistic strategy, it estimates the optimal approach on the fly, by formulating
the optimism/pessimism dilemma as a multi-armed bandit problem. Furthermore, TOP explicitly
isolates the aleatoric and epistemic uncertainty by representing the environmental return using a
distributional critic and model uncertainty with an ensemble. The overall concept is summarized in
Figure 1.
We show in a series of experiments that not only does the efficacy of optimism indeed vary as we
suggest, but TOP is able to capture the best of both worlds, achieving a new state of the art for
challenging continuous control problems.
Our main contributions are as follows:

       • Our work shows that the efficacy of optimism for a fixed function approximator varies across
         environments and during training for reinforcement learning with function approximation.
       • We propose a novel framework for value estimation, Tactical Optimism and Pessimism
         (TOP), which learns to balance optimistic and pessimistic value estimation online. TOP
         frames the choice of the degree of optimism or pessimism as a multi-armed bandit problem.
       • Our experiments demonstrate that these insights, which require only simple changes to
         popular algorithms, lead to state-of-the-art results on both state- and pixel-based control.

2   Related Work                                                          Bandit
                                                                         Algorithm

Much of the recent success of off-policy actor-
critic algorithms build on DDPG [Lillicrap et al.,
2016], which extended the deterministic pol-                             Actor        Critics
icy gradient [Silver et al., 2016] approach to
off-policy learning with deep networks, using
insights from DQN [Mnih et al., 2015]. Like
D4PG [Barth-Maron et al., 2018], we combine
DPG with distributional value estimation. How-                Env
ever, unlike D4PG, we use two critics, a quantile                                  Replay
                                                                                   Buffer
representation rather than a categorical distribu-
tion [Bellemare et al., 2017], and, critically, we
actively manage the tradeoff between optimism Figure 1: Visualization of the TOP framework. Blue
and pessimism. We also note several other suc- arrows denote stochastic variables.
cess stories in the actor-critic vein, including

                                                   2
TD3, SAC, DrQ, and PI-SAC [Fujimoto et al., 2018, Haarnoja et al., 2018, Yarats et al., 2021, Lee
et al., 2020]; these represent the state-of-the-art for continuous control and will serve as a baseline for
our experiments.
The principle of optimism in the face of uncertainty [Audibert et al., 2007, Kocsis and Szepesvári,
2006, Zhang and Yao, 2019] provides a design tool for algorithms that trade off exploitation (maxi-
mization of the reward) against the need to explore state-action pairs with high epistemic uncertainty.
The theoretical tool for evaluating the success of such designs is the notion of regret, which captures
the loss incurred by failing to explore. Regret bounds have long been used in research on multi-armed
bandits, and they have begun to become more prominent in RL as well, both in the tabular setting
[Jaksch et al., 2010, Filippi et al., 2010, Fruit et al., 2018, Azar et al., 2017, Bartlett and Tewari, 2012,
Tossou et al., 2019], and in the setting of function approximation [Jin et al., 2020, Yang and Wang,
2020]. However, optimistic approaches have had limited empirical success when combined with deep
neural networks in RL [Ciosek et al., 2019]. To be successful, these approaches need to be optimistic
enough to upper bound the true value function while maintaining low estimation error [Pacchiano
et al., 2020a]. This becomes challenging when using function approximation, and the result is often
an uncontrolled, undesirable overestimation bias.
Recently, there has been increasing evidence in support of the efficacy of adaptive algorithms [Ball
et al., 2020, Schaul et al., 2019, Penedones et al., 2019, Parker-Holder et al., 2020]. An example
is Agent57 [Badia et al., 2020], the first agent to outperform the human baseline for all 57 games
in the Arcade Learning Environment [Bellemare et al., 2012]. Agent57 adaptively switches among
different exploration strategies. Our approach differs in that it aims to achieve a similar goal by
actively varying the level of optimism in its value estimates.
Finally, our work is also related to automated RL (AutoRL), as we can consider TOP to be an example
of an on-the-fly learning procedure [Co-Reyes et al., 2021, Oh et al., 2020]. An exciting area of future
work will be to consider the interplay between the degree of optimism and model hyperparameters
such as architecture and learning rate, and whether they can be adapted simultaneously.
3 Preliminaries
Reinforcement learning considers the problem of training an agent to interact with its environment
so as to maximize its cumulative reward. Typically, a task and environment are cast as a Markov
decision process (MDP), formally defined as a tuple (S, A, p, r, γ), where S is the state space, A is
the space of possible actions, p : S × A → P(S) is a transition kernel, r : S × A → R P is the reward
function, and γ ∈ [0, 1) is a discounting factor. For a given policy π, the return Z π = t γ t rt , is a
random variable representing the sum of discounted rewards observed along one trajectory of states
obtained from following π until some time horizon T , potentially infinite. Given a parameterization
of the set of policies, {πθ : θ ∈ Θ}, the goalP
is to update θ so as to maximize the expected return, or
discounted cumulative reward, J(θ) = Eπ [ t γ t rt ] = E[Z π ].
Actor-critic algorithms are a framework for solving this problem in which the policy π, here known
as the actor, is trained to maximize expected return, while making use of a critic that evaluates
the actions of the policy. Typically, the critic takes the form of a value function which predicts the
expected return under the current policy, Qπ (s, a) := Eπ [Zt |st = s, at = a]. When the state space is
large, Qπ may be parameterized by a model with parameters φ. The deterministic policy gradient
(DPG) theorem [Silver et al., 2014] shows that gradient ascent on J can be performed via
∇θ J(θ) = Eπ [∇a Qπ (s, a)|a=π(s) ∇θ πθ (s)]. (1)
The critic is updated separately, usually via Sarsa [Sutton and Barto, 2018], which, given a transition
st , at → rt+1 , st+1 , forms a learning signal via semi-gradient descent on the squared temporal
difference (TD) error, δt2 , where
δt := yt − Qπ (st , at ) = rt+1 + γQπ (st+1 , π(st+1 )) − Qπ (st , at ), (2)
and where yt is the Bellman target. Rather than simply predicting the mean of the return Z π under
the current policy, it can be advantageous to learn a full distribution of Z π given the current state
and action, Z π (st , at ) [Bellemare et al., 2017, Dabney et al., 2018b,a, Rowland et al., 2019]. In
this framework, the return distribution is typically parameterized via a set of K functionals of the
distribution (e.g., quantiles or expectiles) which are learned via minimization of an appropriate loss
3function. For example, the kth quantile of the distribution at state s and associated with action a,
qk (s, a), can be learned via gradient descent on the Huber loss [Huber, 1964] of the distributional
Bellman error, δk = Ẑ − qk (s, a), for Ẑ ∼ Z π (·|s, a). While Ẑ is formally defined as a sample from
PK
the return distribution, δk is typically computed in practice as K −1 j=1 r + γqj (s, a) − qk (s, a)
[Dabney et al., 2018b].
4 Optimism versus Pessimism
Reducing overestimation bias with pessimism It was observed by Thrun and Schwartz [1993]
that Q-learning [Watkins and Dayan, 1992] with function approximation is biased towards overestima-
tion. Noting that this overestimation bias can introduce instability in training, Fujimoto et al. [2018]
introduced the Twin Delayed Deep Deterministic (TD3) policy gradient algorithm to correct for the
bias. TD3 can be viewed as a pessimistic heuristic in which values are estimated via a SARSA-like
variant of double Q-learning [Hasselt, 2010] and the Bellman target is constructed by taking the
minimum of two critics:
yt = rt+1 + γ min Qπφi (s, πθ (s) + ). (3)
i∈{1,2}
Here ∼ clip(N (0, s2 ), −c, c) is drawn from a clipped Gaussian distribution (c is a constant). This
added noise is used for smoothing in order to prevent the actor from overfitting to narrow peaks in
the value function. Secondly, TD3 delays policy updates, updating value estimates several times
between each policy gradient step. By taking the minimum of two separate critics and increasing the
number of critic updates for each policy update, this approach takes a pessimistic view on the policy’s
value in order to reduce overestimation bias. These ideas have become ubiquitous in state-of-the-art
continuous control algorithms [Ball and Roberts, 2021], such as SAC, RAD, (PI)-SAC [Haarnoja
et al., 2018, Laskin et al., 2020a, Lee et al., 2020].
Optimism in the face of uncertainty While it is valuable to attempt to correct for overestimation
of the value function, it is also important to recall that overestimation can be viewed as a form of
optimism, and as such can provide a guide for exploration, a necessary ingredient in theoretical
treatments of RL in terms of regret [Jin et al., 2018, Jaksch et al., 2010, Azar et al., 2017]. In essence,
the effect of optimistic value estimation is to induce the agent to explore regions of the state space
with high epistemic uncertainty, encouraging further data collection in unexplored regions. Moreover,
Ciosek et al. [2019] found that reducing value estimates, as done in pessimistic algorithms, can lead
to pessimistic underexploration, in which actions that could lead to experience that gives the agent
a better long-term reward. To address this problem, Ciosek et al. [2019] introduced the Optimistic
Actor-Critic (OAC) algorithm, which trains an exploration policy using an optimistic upper bound on
the value function while constructing targets for learning using the lower bound of Fujimoto et al.
[2018]. OAC demonstrated improved performance compared to SAC, hinting at a complex interplay
between optimism and pessimism in deep RL algorithms.
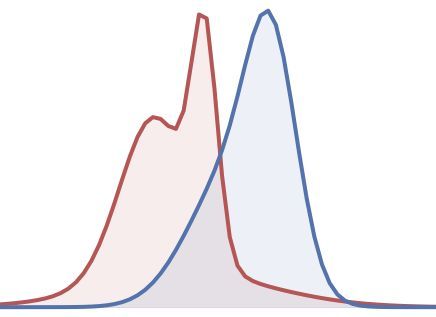
Trading off optimism and pes- HalfCheetah-v2 4000
Hopper-v2
12500
simism As we have discussed, there 3000
10000
are arguments for both optimism and
Reward
7500 2000
pessimism in RL. Optimism can aid 5000
exploration, but if there is significant 2500 Pessimistic 1000
Optimistic
estimation error, then a more pes-
0.0 0.2 0.4 0.6 0.8 1.0 0.0 0.2 0.4 0.6 0.8 1.0
simistic approach may be needed to Time steps (1e6) 1e6
Time steps (1e6) 1e6
stabilize learning. Moreover, both ap- Figure 2: Optimistic and Pessimistic algorithms averaged over 10
proaches have led to algorithms that seeds. Shading is one half std.
are supported by strong empirical ev-
idence. We aim to reconcile these seemingly contradictory perspectives by hypothesizing that the
relative contributions of these two ingredients can vary depending on the nature of the task, with
relatively simple settings revealing predominantly one aspect. As an illustrative example, we trained
“Optimistic” and “Pessimistic” versions of the same deep actor-critic algorithm (details in Section 6)
for two different tasks and compared their performance in Figure 2. As we can see, in the HalfCheetah
task, the Optimistic agent outperforms the Pessimistic agent, while in the Hopper task, the opposite is
true. This result suggests that the overall phenomenon is multi-faceted and active management of the
overall optimism-pessimism trade-off is necessary. Accordingly, in the current paper we propose the
4use of an adaptive approach in which the degree of optimism or pessimism is adjusted dynamically
during training. As a consequence of this approach, the optimal degree of optimism can vary across
tasks and over the course of a single training run as the model improves. Not only does this approach
reconcile the seemingly contradictory perspectives in the literature, but it also can outperform each
individual framework in a wider range of tasks.
5 Tactical Optimistic and Pessimistic Value Estimation
TOP is based on the idea of adaptive optimism in the face of uncertainty. We begin by discussing
how TOP represents uncertainty and then turn to a description of the mechanism by which TOP
dynamically adapts during learning.
5.1 Representing uncertainty in TOP estimation
TOP distinguishes between two types of uncertainty—aleatoric uncertainty and epistemic uncer-
tainty—and represents them using two separate mechanisms.
Aleatoric uncertainty reflects the noise that is inherent to the environment regardless of the agent’s
understanding of the task. Following Bellemare et al. [2017], Dabney et al. [2018b,a], Rowland et al.
[2019], TOP represents this uncertainty by learning the full return distribution, Z π (s, a), for a given
policy π and state-action pair (s, a) rather than only the expected return, Qπ (s, a) = E[Z π (s, a)].
Depending on the stochasticity of the environment, the distribution Z π (s, a) is more or less spread
out, thereby acting as a measure of aleatoric uncertainty.
Epistemic uncertainty reflects lack of knowledge about the environment and is expected to decrease
as the agent gains experience. TOP uses this uncertainty to quantify how much an optimistic belief
about the return differs from a pessimistic one. Following Ciosek et al. [2019], we model epistemic
uncertainty via a Gaussian distribution with mean Z̄(s, a) and standard deviation σ(s, a) as follows:
Z π (s, a) = Z̄(s, a) + σ(s, a), (4)
However, unlike in Ciosek et al. [2019], where the parameters of the Gaussian are deterministic, we
treat both Z̄(s, a) and σ(s, a) as random variables underlying a Bayesian representation of aleatoric
uncertainty. As we describe next, only Z π (s, a) is modeled (via a quantile representation), hence
Z̄(s, a) and σ(s, a) are unknown. Proposition 1 shows how to recover them from Z π (s, a) and is
proven in Appendix E.
Proposition 1. The quantile function qZ̄(s,a) of Z̄ is given by:
qZ̄(s,a) = E qZ π (s,a) , (5)
where qZ π (s,a) is the quantile function of Z π (s, a) knowing and σ(s, a) and E denotes the
expectation w.r.t. ∼ N (0, 1). Moreover, σ 2 (s, a) satisfies:
σ 2 (s, a) = E [kZ̄(s, a) − Z π k2 ]. (6)
Quantile approximation Following Dabney et al. [2018b], TOP represents the return distribution
Z π (s, a) using a quantile approximation, meaning that it forms K statistics, q (k) (s, a), to serve
as an approximation of the quantiles of Z π (s, a). The quantiles q (k) (s, a) can be learned as the
outputs of a parametric function—in our case, a deep neural network—with parameter vector φ. To
measure epistemic uncertainty, TOP stores two estimates, Z1π (s, a) and Z2π (s, a), with respective
(k) (k)
quantile functions q1 (s, a) and q2 (s, a) and parameters φ1 and φ2 . This representation allows
for straightforward estimation of the mean Z̄(s, a) and variance σ(s, a) in (4) using Proposition 1.
Indeed, applying (5) and (6) and treating Z1π (s, a) and Z2π (s, a) as exchangeable draws from (4), we
approximate the quantiles qZ̄(s,a) and qσ(s,a) of Z̄(s, a) and σ(s, a) as follows:
v
u 2 2
(k) 1
(k) (k)
(k)
uX (k)
q̄ (s, a) = q1 (s, a) + q2 (s, a) , σ (s, a) = t qi (s, a) − q̄ (k) (s, a) . (7)
2 i=1
Next, we will show these approximations can be used to define an exploration strategy for the agent.
55.2 An uncertainty-based strategy for exploration
We use the quantile estimates defined in (7) to construct a belief distribution Z̃ π (s, a) over the
expected return whose quantiles are defined by
qZ̃ π (s,a) = qZ̄(s,a) + βqσ(s,a) . (8)
This belief distribution Z̃ π (s, a) is said be optimistic when β ≥ 0 and pessimistic when β < 0. The
amplitude of optimism or pessimism is measured by σ(s, a), which quantifies epistemic uncertainty.
The degree of optimism depends on β and is adjusted dynamically during training, as we will see in
Section 5.3. Note that β replaces ∼ N (0, 1), making the belief distribution non-Gaussian.
Learning the critics. TOP uses the belief distribution in (8) to form a target for both estimates of the
distribution, Z1π (s, a) and Z2π (s, a). To achieve this, TOP computes an approximation of Z̃ π (s, a)
using K quantiles q̃ (k) = q̄ k + βσ (k) . The temporal difference error for each Ziπ (s, a) is given by
(j,k) (k)
δi := r + γ q̃ (j) − qi with i ∈ {1, 2} and where (j, k) ranges over all possible combinations of
quantiles. Finally, following the quantile regression approach in Dabney et al. [2018b], we minimize
(j,k)
the Huber loss LHuber evaluated at each distributional error δi , which provides a gradient signal
to learn the distributional critics as given by (9):
(j,k)
X
∆φi ∝ ∇φi LHuber (δi ). (9)
1≤k,j≤K
The overall process is summarized in Algorithm 2.
Learning the actor. The actor is trained to maximize the expected value Q̃(s, a) under the belief
distribution Z̃ π (s, a). Using the quantile approximation, Q̃(s, a) is simply given as an average over
1
PK (k)
q̃ (k) : Q̃(s, a) = K k=1 q̃ (s, a). The update of the actor follows via the DPG gradient:
∆θ ∝ ∇a Q̃(s, a)|a=πθ (s) ∇θ πθ (s). (10)
This process is summarized in Algorithm 3. To reduce variance and leverage past experience, the
critic and actor updates in (9) and (10) are both averaged over N transitions, (s, a, r, s0 )N
n=1 , sampled
from a replay buffer B [Lin, 1992].
√
In the special case of β = −1/ 2, the average of (8) reduces to mini Ziπ (s, a) and (10) recovers a
distributional version of TD3, a pessimistic algorithm. On the other hand, when β ≥ 0, the learning
target is optimistic with respect to the current value estimates, recovering a procedure that can be
viewed as a distributional version of the optimistic algorithm of Ciosek et al. [2019]. However, in
our case, when β ≥ 0 the learning target is also optimistic. Hence, (9) and (10) can be seen as a
generalization of the existing literature to a distributional framework that can recover both optimistic
and pessimistic value estimation depending on the sign of β. In the next section we propose a
principled way to adapt β during training to benefit from both the pessimistic and optimistic facets of
our approach.
5.3 Optimism and pessimism as a multi-arm bandit problem
As we have seen (see Figure 2), the optimal degree of optimism or pessimism for a given algorithm
may vary across environments. As we shall see, it can also be beneficial to be more or less optimistic
over the course of a single training run. It is therefore sensible for an agent to adapt its degree of
optimism dynamically in response to feedback from the environment. In our framework, the problem
can be cast in terms of the choice of β. Note that the evaluation of the effect of β is a form of bandit
feedback, where learning episodes tell us about the absolute level of performance associated with
a particular value of β, but do not tell us about relative levels. We accordingly frame the problem
as a multi-armed bandit problem, using the Exponentially Weighted Average Forecasting algorithm
[Cesa-Bianchi and Lugosi, 2006]. In our setting, each bandit arm represents a particular value of β,
and we consider D experts making recommendations from a discrete set of values {βd }D d=1 . After
sampling a decision dm ∈ {1, . . . , D} at episode m, we form a distribution pm ∈ ∆D of the form
pm (d) ∝ exp (wm (d)). The learner receives a feedback signal, fm ∈ R, based on this choice. The
parameter wm is updated as follows:
(
fm
wm (d) + η pm (d) if d = dm
wm+1 (d) = (11)
wm (d) otherwise,
6Algorithm 1: TOP-TD3
1: Initialize critic networks Qφ1 , Qφ2 and actor πθ
Initialize target networks φ01 ← φ1 , φ02 ← φ2 , θ0 ← θ
Initialize replay buffer and bandit probabilities B ← ∅, pβ1 ← U([0, 1]D )
2: for episode in m = 1, 2, . . . do
3: Initialize episode reward Rm ← 0
4: Sample optimism βm ∼ pβm
5: for time step t = 1, 2, . . . , T do
6: Select noisy action at = πθ (st ) + , ∼ N (0, s2 ), obtain rt+1 , st+1
7: Add to total reward Rm ← Rm + rt+1
8: Store transition B ← B ∪ {(st , at , rt+1 , st+1 )}
N
9: Sample N transitions T = (s, a, r, s0 )n=1 ∼ B.
0 0 0
10: UpdateCritics(T , βm , θ , φ1 , φ2 )
11: if t mod b then
12: UpdateActor(T , βm , θ, φ1 , φ2 )
13: Update φ0i : φ0i ← τ φi + (1 − τ )φ0i , i ∈ {1, 2}
14: Update θ0 : θ0 ← τ θ + (1 − τ )θ0
15: end for
16: Update bandit pβ weights using (11)
17: end for
for a step size parameter η > 0. Intuitively, if the feedback signal obtained is high and the current
probability of selecting a given arm is low, the likelihood of selecting that arm again will increase. For
the feedback signal fm , we use improvement in performance. Concretely, we set fm = Rm − Rm−1 ,
where Rm is the cumulative reward obtained in episode m. Henceforth, we denote by pβm the
exponential weights distribution over β values at episode m.
Our approach can be thought of as implementing a form of model selection similar to that of Pacchiano
et al. [2020d], where instead of maintaining distinct critics for each optimism choice, we simply
update the same pair of critics using the choice of β proposed by the bandit algorithm. For a more
thorough discussion of TOP’s connection to model selection, see Appendix D.
5.4 The TOP framework
The general TOP framework can be applied to any off-policy actor-critic architecture. As an example,
an integration of the procedure with TD3 (TOP-TD3) is shown in Algorithm 1, with key differences
from TD3 highlighted in purple. Like TD3, we apply target networks, which use slow-varying
averages of the current parameters, θ, φ1 , φ2 , to provide stable updates for the critic functions. The
target parameters θ0 , φ01 , φ02 are updated every b time steps along with the policy. We use two critics,
which has been shown to be sufficient for capturing epistemic uncertainty [Ciosek et al., 2019].
However, it is likely that the ensemble would be more effective with more value estimates, as
demonstrated in Osband et al. [2016].
6 Experiments
The key question we seek to address with our experiments is whether augmenting state-of-the-art
off-policy actor-critic methods with TOP can increase their performance on challenging continuous-
control benchmarks. We also test our assumption that the relative performance of optimistic and
pessimistic strategies should vary across environments and across training regimes. We perform abla-
tions to ascertain the relative contributions of different components of the framework to performance.
Our code is available at https://github.com/tedmoskovitz/TOP.
State-based control To address our first question, we augmented TD3 [Fujimoto et al., 2018] with
TOP (TOP-TD3) and evaluated its performance on seven state-based continuous-control tasks from
the MuJoCo framework [Todorov et al., 2012] via OpenAI Gym [Brockman et al., 2016]. As baselines,
we also trained standard TD3 [Fujimoto et al., 2018], SAC [Haarnoja et al., 2018], OAC [Ciosek et al.,
2019], as well as two ablations of TOP. The first, QR-TD3, is simply TD3 with distributional critics,
7and the second, non-distributional (ND) TOP-TD3, is our bandit framework applied to TD3 without
distributional value estimation. TD3, SAC, and OAC use their default hyperparameter settings, with
TOP and its ablations using the same settings as TD3. For tactical optimism, we set the possible
β values to be {−1, 0}, such that β = −1 corresponds to a pessimistic lower bound, and β = 0
corresponds to simply using the average of the critic. It’s important to note that β = 0 is an optimistic
setting, as the mean is biased towards optimism. We also tested the effects of different settings for β
(Appendix, Figure 6). Hyperparameters were kept constant across all environments. Further details
can be found in Appendix B. We trained all algorithms for one million time steps and repeated each
experiment with ten random seeds.
Table 1: Average reward over ten trials on Mujoco tasks, trained for 1M time steps. ± values denote one
standard deviation across trials. Values within one standard deviation of the highest performance are listed in
bold. ? indicates that gains over base TD3 are statistically significant (p < 0.05).
Task TOP-TD3 ND TOP-TD3 QR-TD3 TD3 OAC SAC
?
Humanoid 5899±142 5445 5003 5386 5349 5315
HalfCheetah 13144 ± 701? 12477 11170 9566 11723 10815
Hopper 3688 ± 33? 3458 3392 3390 2896 2237
Walker2d 5111 ± 220? 4832 4560 4412 4786 4984
Ant 6336 ± 181? 6096 5642 4242 4761 3421
InvDoublePend 9337 ± 20? 9330 9299 8582 9356 9348
Reacher −3.85 ± 0.96 −3.91 −3.95 −4.22 −4.15 −4.14
Our results, displayed in Figure 3 and Table 1, demonstrate that TOP-TD3 is able to outperform or
match baselines across all environments, with state-of-the-art performance in the 1M time step regime
for the challenging Humanoid task. In addition, we see that TOP-TD3 matches the best optimistic
and pessimistic performance for HalfCheetah and Hopper in Fig. 2. Without access to raw scores
for all environments we cannot make strong claims of statistical significance. However, it is worth
noting that the mean minus one standard deviation of TOP-RAD outperforms the mean performance
all baselines in five out of the seven environments considered.
HalfCheetah-v2 4000
Hopper-v2 Walker2d-v2 Humanoid-v2
6000
12500 5000
10000 3000 4000 4000
Reward
7500 2000 3000
5000 2000 2000
2500 1000
1000
0.0 0.5 1.0 0.0 0.5 1.0 0.0 0.5 1.0 0.0 0.5 1.0
1e6 1e6 1e6 1e6
Ant-v2 InvertedDoublePendulum-v2
10000
Reacher-v2 6000
Humanoid-v2 (zoom)
6000 -4
-8
Reward
4000
5000 -12
2000 -16 5000
-20
0.0 0.5 1.0 0.0 0.5 1.0 0.0 0.5 1.0 0.50 0.75 1.00
Time steps (1e6) 1e6 Time steps (1e6) 1e6 Time steps (1e6) 1e6 Time steps (1e6) 1e6
TD3 SAC OAC TOP-TD3
Figure 3: Reward curves for Mujoco tasks. The shaded region represents one half of a standard deviation over
ten runs. Curves are uniformly smoothed. The lower right plot zooms in on the second half of the learning curve
on Humanoid, omitting the shading for clarity.
81.0
HalfCheetah Cheetah, Run
0.6 Hopper 0.8 Finger, Spin
Optimism
Walker2d Walker, Walk
Humanoid 0.6 Cartpole, Swing
0.4 Ant Reacher, Easy
InvDoublePend 0.4 Cup, Catch
0.2 Reacher
0.0 0.2 0.4 0.6 0.8 1.0 0 200000 400000
Time steps (1e6) 1e6
Time steps
Figure 4: Mean optimism plotted across ten seeds. The shaded areas represent one half standard deviation.
Table 2: Final average reward over ten trials on DMControl tasks for 100k and 500k time steps. ± values
denote one standard deviation across trials. Values within one standard deviation of the highest performance are
listed in bold. ? indicates that gains over base RAD are statistically significant (p < 0.05).
Task (100k) TOP-RAD RAD DrQ PI-SAC CURL PlaNet Dreamer
?
Cheetah, Run 674 ± 31 499 344 460 299 307 235
Finger, Spin 873 ± 69 813 901 957 767 560 341
Walker, Walk 862 ± 43? 644 612 514 403 221 277
Cartpole, Swing 887 ± 13? 864 759 816 582 563 326
Reacher, Easy 991 ± 3? 772 601 758 538 82 314
Cup, Catch 970 ± 12? 950 913 933 769 710 246
Task (500k) TOP-RAD RAD DrQ PI-SAC CURL PlaNet Dreamer
?
Cheetah, Run 910 ± 4 774 660 801 518 568 570
Finger, Spin 928 ± 74 907 938 957∗ 926 718 796
Walker, Walk 988 ± 4? 917 921 946 902 478 897
Cartpole, Swing 890 ± 28? 858 868 816∗ 845 787 762
Reacher, Easy 993 ± 5? 930 942 950 929 588 793
Cup, Catch 972 ± 53? 970 963 933∗ 959? 939 879
Pixel-based control We next consider a suite of challenging pixel-based environments, to test the
scalability of TOP to high-dimensional regimes. We introduce TOP-RAD, a new algorithm that
dynamically switches between optimism and pessimism while using SAC with data augmentation (as
in Laskin et al. [2020a]). We evaluate TOP-RAD on both the 100k and 500k benchmarks on six tasks
from the DeepMind (DM) Control Suite [Tassa et al., 2018]. In addition to the original RAD, we also
report performance from DrQ [Yarats et al., 2021], PI-SAC [Lee et al., 2020], CURL [Laskin et al.,
2020b], PlaNet [Hafner et al., 2019] and Dreamer [Hafner et al., 2020], representing state-of-the-art
methods. All algorithms use their standard hyperparameter settings, with TOP using the same settings
as in the state-based tasks, with no further tuning. We report results for both settings averaged over
ten seeds (Table 2). We see that TOP-RAD sets a new state of the art in every task except one (Finger,
Spin), and in that case there is still significant improvement compared to standard RAD. Note that
this is a very simple method, requiring only the a few lines of change versus vanilla RAD—and yet
the gains over the baseline method are sizeable.
Does the efficacy of optimism vary across environments? To provide insight into how TOP’s
degree of optimism changes across tasks and over the course of learning, we plotted the average arm
choice made by the bandit algorithm over time for each environment in Figure 4. Optimistic choices
were given a value of 1 and and pessimistic selections were assigned 0. A mean of 0.5 indicates that
β = 0 (optimism) and β = −1 (pessimism) were equally likely. From the plot, we can see that in
some environments (e.g., Humanoid and Walker, Walk), TOP learned to be more optimistic over time,
while in others (e.g., Hopper and Finger, Spin), the agent became more pessimistic. Importantly, these
changes were not always monotonic. On Ant, for example, TOP becomes steadily more pessimistic
until around halfway through training, at which point it switches and grows more optimistic over
time. The key question, then, is whether this flexibility contributes to improved performance.
To investigate this, we compared TOP to two baselines, a “Pessimistic" version in which β = −1 for
every episode, and an “Optimistic" version in which β is fixed to 0. If TOP is able to accurately gauge
the degree of optimism that’s effective for a given task, then it should match the best performing
baseline in each task even if these vary. We tested this hypothesis in the HalfCheetah and Hopper
environments, and obtained the results shown in Figure 5. We see TOP matches the Optimistic
9performance for HalfCheetah and the Pessimistic performance in Hopper. This aligns with Figure 4,
where we see that TOP does indeed favor a more Optimistic strategy for HalfCheetah, with a more
Pessimistic one for Hopper. This result can be seen as connected to the bandit regret guarantees
referenced in Section 5.3, in which an adaptive algorithm is able to perform at least as well as the
best fixed optimism choice in hindsight.
7 Conclusion
We demonstrated empirically that dif- HalfCheetah-v2 4000
Hopper-v2
12500
fering levels of optimism are useful 3000
10000
across tasks and over the course of
Reward
7500 2000
learning. As previous deep actor-critic 5000 Pessimistic
algorithms rely on a fixed degree of 2500 Optimistic 1000
TOP-TD3
optimism, we introduce TOP, which is
0.0 0.2 0.4 0.6 0.8 1.0 0.0 0.2 0.4 0.6 0.8 1.0
able to dynamically adapt its value es- Time steps (1e6) 1e6
Time steps (1e6) 1e6
timation strategy, accounting for both Figure 5: Mean performance of Pessimistic, Optimistic, and TOP
aleatoric and epistemic uncertainty across ten seeds. Shaded regions are one half standard deviation.
to optimize performance. We then
demonstrate that TOP is able to outperform state-of-the-art approaches on challenging continu-
ous control tasks while appropriately modulating its degree of optimism.
One limitation of TOP is that the available settings for β are pre-specified. It would be interesting to
learn β, either through a meta-learning or Bayesian framework. Nevertheless, we believe that the
bandit framework provides a useful, simple-to-implement template for adaptive optimism that could be
easily be applied to other settings in RL. Other future avenues could involve adapting other parameters
online, such as regularization [Pacchiano et al., 2020c, Moskovitz et al., 2021], constructing the belief
distribution from more than two critics, and learning a weighting over quantiles rather than simply
taking the mean. This would induce a form of optimism and/or pessimism specifically with respect to
aleatoric uncertainty and has connections to risk-sensitive RL, as described by Dabney et al. [2018a],
Ma et al. [2019].
10References
A. Agarwal, H. Luo, B. Neyshabur, and R. E. Schapire. Corralling a band of bandit algorithms. In
Conference on Learning Theory, pages 12–38. PMLR, 2017.
J. Audibert, R. Munos, and C. Szepesvári. Tuning bandit algorithms in stochastic environments. In
Algorithmic Learning Theory, 18th International Conference, ALT 2007, Sendai, Japan, October
1-4, 2007, Proceedings, volume 4754 of Lecture Notes in Computer Science, pages 150–165.
Springer, 2007.
M. G. Azar, I. Osband, and R. Munos. Minimax regret bounds for reinforcement learning. In
Proceedings of the 34th International Conference on Machine Learning, ICML, volume 70 of
Proceedings of Machine Learning Research, pages 263–272, 2017.
A. P. Badia, B. Piot, S. Kapturowski, P. Sprechmann, A. Vitvitskyi, D. Guo, and C. Blundell. Agent57:
Outperforming the atari human benchmark. In Proceedings of the 37th International Conference
on Machine Learning. ICML, 2020.
P. Ball, J. Parker-Holder, A. Pacchiano, K. Choromanski, and S. Roberts. Ready policy one: World
building through active learning. In Proceedings of the 37th International Conference on Machine
Learning, volume 119, pages 591–601, 13–18 Jul 2020.
P. J. Ball and S. J. Roberts. Offcon3 : What is state of the art anyway?, 2021.
G. Barth-Maron, M. W. Hoffman, D. Budden, W. Dabney, D. Horgan, D. TB, A. Muldal, N. Heess,
and T. Lillicrap. Distributional policy gradients. In International Conference on Learning
Representations, 2018.
P. L. Bartlett and A. Tewari. REGAL: A regularization based algorithm for reinforcement learning in
weakly communicating MDPs. CoRR, abs/1205.2661, 2012.
M. G. Bellemare, Y. Naddaf, J. Veness, and M. Bowling. The arcade learning environment: An
evaluation platform for general agents. CoRR, abs/1207.4708, 2012. URL http://arxiv.org/
abs/1207.4708.
M. G. Bellemare, W. Dabney, and R. Munos. A distributional perspective on reinforcement learning.
In Proceedings of the 34th International Conference on Machine Learning - Volume 70, page
449–458. JMLR.org, 2017.
G. Brockman, V. Cheung, L. Pettersson, J. Schneider, J. Schulman, J. Tang, and W. Zaremba. Openai
gym. CoRR, 2016.
N. Cesa-Bianchi and G. Lugosi. Prediction, learning, and games. Cambridge University Press, 2006.
K. Ciosek, Q. Vuong, R. Loftin, and K. Hofmann. Better exploration with optimistic actor-critic. In
Advances in Neural Information Processing Systems. NeurIPS, 2019.
J. D. Co-Reyes, Y. Miao, D. Peng, Q. V. Le, S. Levine, H. Lee, and A. Faust. Evolving reinforcement
learning algorithms. In International Conference on Learning Representations, 2021.
W. Dabney, G. Ostrovski, D. Silver, and R. Munos. Implicit quantile networks for distributional
reinforcement learning. In J. Dy and A. Krause, editors, Proceedings of the 35th International
Conference on Machine Learning, volume 80 of Proceedings of Machine Learning Research,
pages 1096–1105, Stockholmsmässan, Stockholm Sweden, 10–15 Jul 2018a. PMLR. URL
http://proceedings.mlr.press/v80/dabney18a.html.
W. Dabney, M. Rowland, M. G. Bellemare, and R. Munos. Distributional reinforcement learning
with quantile regression. In AAAI. AAAI, 2018b.
S. Filippi, O. Cappé, and A. Garivier. Optimism in reinforcement learning and kullback-leibler
divergence. In 2010 48th Annual Allerton Conference on Communication, Control, and Computing
(Allerton), pages 115–122, 2010.
11R. Fruit, M. Pirotta, A. Lazaric, and R. Ortner. Efficient bias-span-constrained exploration-exploitation
in reinforcement learning. In Proceedings of the 35th International Conference on Machine
Learning, ICML, volume 80, pages 1573–1581, 2018.
S. Fujimoto, H. van Hoof, and D. Meger. Addressing function approximation error in actor-critic
methods. ICML, 2018.
T. Haarnoja, A. Zhou, P. Abbeel, and S. Levine. Soft actor-critic: Off-policy maximum entropy deep
reinforcement learning with a stochastic actor. CoRR, abs/1801.01290, 2018.
D. Hafner, T. Lillicrap, I. Fischer, R. Villegas, D. Ha, H. Lee, and J. Davidson. Learning latent
dynamics for planning from pixels. In K. Chaudhuri and R. Salakhutdinov, editors, Proceedings of
the 36th International Conference on Machine Learning, volume 97 of Proceedings of Machine
Learning Research, pages 2555–2565. PMLR, 09–15 Jun 2019. URL http://proceedings.
mlr.press/v97/hafner19a.html.
D. Hafner, T. Lillicrap, J. Ba, and M. Norouzi. Dream to control: Learning behaviors by latent
imagination. In International Conference on Learning Representations, 2020. URL https:
//openreview.net/forum?id=S1lOTC4tDS.
H. Hasselt. Double q-learning. In J. Lafferty, C. Williams, J. Shawe-Taylor, R. Zemel, and A. Culotta,
editors, Advances in Neural Information Processing Systems, volume 23, pages 2613–2621, 2010.
P. J. Huber. Robust estimation of a location parameter. Annals of Mathematical Statistics, 35(1):
73–101, 1964. ISSN 0003-4851.
T. Jaksch, R. Ortner, and P. Auer. Near-optimal regret bounds for reinforcement learning. J. Mach.
Learn. Res., 11:1563–1600, Aug. 2010. ISSN 1532-4435.
C. Jin, Z. Allen-Zhu, S. Bubeck, and M. I. Jordan. Is Q-learning provably efficient? In S. Vish-
wanathan, H. Wallach, S. Larochelle, K. Grauman, and N. Cesa-Bianchi, editors, Advances in
Neural Information Processing, volume 31. Curran Associates, 2018.
C. Jin, Z. Yang, Z. Wang, and M. I. Jordan. Provably efficient reinforcement learning with linear
function approximation. In Conference on Learning Theory, pages 2137–2143. PMLR, 2020.
L. Kocsis and C. Szepesvári. Bandit based Monte-Carlo planning. In Machine Learning: ECML
2006, 17th European Conference on Machine Learning, Berlin, Germany, September 18-22, 2006,
Proceedings, volume 4212 of Lecture Notes in Computer Science, pages 282–293. Springer, 2006.
M. Laskin, K. Lee, A. Stooke, L. Pinto, P. Abbeel, and A. Srinivas. Reinforcement learning
with augmented data. In H. Larochelle, M. Ranzato, R. Hadsell, M. F. Balcan, and H. Lin,
editors, Advances in Neural Information Processing Systems, volume 33, pages 19884–19895. Cur-
ran Associates, Inc., 2020a. URL https://proceedings.neurips.cc/paper/2020/file/
e615c82aba461681ade82da2da38004a-Paper.pdf.
M. Laskin, A. Srinivas, and P. Abbeel. Curl: Contrastive unsupervised representations for reinforce-
ment learning. Proceedings of the 37th International Conference on Machine Learning, Vienna,
Austria, PMLR 119, 2020b. arXiv:2004.04136.
K.-H. Lee, I. Fischer, A. Liu, Y. Guo, H. Lee, J. Canny, and S. Guadarrama. Predictive information
accelerates learning in rl. In H. Larochelle, M. Ranzato, R. Hadsell, M. F. Balcan, and H. Lin,
editors, Advances in Neural Information Processing Systems, volume 33, pages 11890–11901.
Curran Associates, Inc., 2020. URL https://proceedings.neurips.cc/paper/2020/file/
89b9e0a6f6d1505fe13dea0f18a2dcfa-Paper.pdf.
T. P. Lillicrap, J. J. Hunt, A. Pritzel, N. Heess, T. Erez, Y. Tassa, D. Silver, and D. Wierstra. Continuous
control with deep reinforcement learning. In ICLR, 2016.
L.-J. Lin. Self-improving reactive agents based on reinforcement learning, planning and teaching.
Mach. Learn., 8(3–4):293–321, May 1992. ISSN 0885-6125. doi: 10.1007/BF00992699. URL
https://doi.org/10.1007/BF00992699.
S. Ma, J. Y. Yu, and A. Satir. A scheme for dynamic risk-sensitive sequential decision making, 2019.
12V. Mnih, K. Kavukcuoglu, D. Silver, A. A. Rusu, J. Veness, M. G. Bellemare, A. Graves, M. Ried-
miller, A. K. Fidjeland, G. Ostrovski, S. Petersen, C. Beattie, A. Sadik, I. Antonoglou, H. King,
D. Kumaran, D. Wierstra, S. Legg, and D. Hassabis. Human-level control through deep reinforce-
ment learning. Nature, 518(7540):529–533, Feb. 2015. ISSN 00280836.
T. Moskovitz, M. Arbel, F. Huszar, and A. Gretton. Efficient wasserstein natural gradients for
reinforcement learning. In International Conference on Learning Representations. ICLR, 2021.
J. Oh, M. Hessel, W. M. Czarnecki, Z. Xu, H. van Hasselt, S. Singh, and D. Silver. Discovering
reinforcement learning algorithms. In Advances in Neural Information Processing Systems 33.
NeurIPS, 2020.
I. Osband, C. Blundell, A. Pritzel, and B. Van Roy. Deep exploration via bootstrapped dqn. In D. Lee,
M. Sugiyama, U. Luxburg, I. Guyon, and R. Garnett, editors, Advances in Neural Information
Processing Systems, volume 29, pages 4026–4034, 2016.
A. Pacchiano, P. Ball, J. Parker-Holder, K. Choromanski, and S. Roberts. On optimism in model-based
reinforcement learning. CoRR, 2020a.
A. Pacchiano, C. Dann, C. Gentile, and P. Bartlett. Regret bound balancing and elimination for model
selection in bandits and rl. arXiv preprint arXiv:2012.13045, 2020b.
A. Pacchiano, J. Parker-Holder, Y. Tang, K. Choromanski, A. Choromanska, and M. Jordan. Learning
to score behaviors for guided policy optimization. In Proceedings of the 37th International
Conference on Machine Learning, volume 119, pages 7445–7454, 13–18 Jul 2020c.
A. Pacchiano, M. Phan, Y. Abbasi-Yadkori, A. Rao, J. Zimmert, T. Lattimore, and C. Szepesvari.
Model selection in contextual stochastic bandit problems. arXiv preprint arXiv:2003.01704, 2020d.
J. Parker-Holder, A. Pacchiano, K. Choromanski, and S. Roberts. Effective diversity in population-
based reinforcement learning. In Advances in Neural Information Processing Systems 34. NeurIPS,
2020.
H. Penedones, C. Riquelme, D. Vincent, H. Maennel, T. A. Mann, A. Barreto, S. Gelly, and G. Neu.
Adaptive temporal-difference learning for policy evaluation with per-state uncertainty estimates.
In Advances in Neural Information Processing Systems. NeurIPS, 2019.
M. Rowland, R. Dadashi, S. Kumar, R. Munos, M. G. Bellemare, and W. Dabney. Statistics and
samples in distributional reinforcement learning, 2019.
T. Schaul, D. Borsa, D. Ding, D. Szepesvari, G. Ostrovski, W. Dabney, and S. Osindero. Adapting
behaviour for learning progress. CoRR, abs/1912.06910, 2019.
D. Silver, G. Lever, N. Heess, T. Degris, D. Wierstra, and M. Riedmiller. Deterministic policy
gradient algorithms. In Proceedings of the 31st International Conference on Machine Learning,
pages 387–395, 2014.
D. Silver, A. Huang, C. J. Maddison, A. Guez, L. Sifre, G. van den Driessche, J. Schrittwieser,
I. Antonoglou, V. Panneershelvam, M. Lanctot, S. Dieleman, D. Grewe, J. Nham, N. Kalchbrenner,
I. Sutskever, T. Lillicrap, M. Leach, K. Kavukcuoglu, T. Graepel, and D. Hassabis. Mastering the
game of Go with deep neural networks and tree search. Nature, 529(7587):484–489, 2016. ISSN
0028-0836.
R. S. Sutton and A. G. Barto. Reinforcement Learning: An Introduction. The MIT Press, second
edition, 2018.
Y. Tassa, Y. Doron, A. Muldal, T. Erez, Y. Li, D. de Las Casas, D. Budden, A. Abdolmaleki, J. Merel,
A. Lefrancq, T. Lillicrap, and M. Riedmiller. Deepmind control suite, 2018.
S. Thrun and A. Schwartz. Issues in using function approximation for reinforcement learning. In In
Proceedings of the Fourth Connectionist Models Summer School. Erlbaum, 1993.
E. Todorov, T. Erez, and Y. Tassa. Mujoco: A physics engine for model-based control. In IROS,
pages 5026–5033. IEEE, 2012.
13A. C. Y. Tossou, D. Basu, and C. Dimitrakakis. Near-optimal optimistic reinforcement learning using
empirical bernstein inequalities. CoRR, abs/1905.12425, 2019.
C. J. C. H. Watkins and P. Dayan. Q-learning. Machine Learning, 8:279–292, 1992.
L. Yang and M. Wang. Reinforcement learning in feature space: Matrix bandit, kernels, and regret
bound. In International Conference on Machine Learning, pages 10746–10756. PMLR, 2020.
D. Yarats, I. Kostrikov, and R. Fergus. Image augmentation is all you need: Regularizing deep
reinforcement learning from pixels. In International Conference on Learning Representations,
2021. URL https://openreview.net/forum?id=GY6-6sTvGaf.
S. Zhang and H. Yao. Quota: The quantile option architecture for reinforcement learning. Proceedings
of the AAAI Conference on Artificial Intelligence, 33(01):5797–5804, 2019. doi: 10.1609/aaai.
v33i01.33015797. URL https://ojs.aaai.org/index.php/AAAI/article/view/4527.
14A Additional Experimental Results
The results for different settings of β for TOP-TD3 on Hopper and HalfCheetah are presented in
Figure 6.
HalfCheetah-v2 4000
Hopper-v2 arm settings
(-1.0, -0.5)
12500 (-1.0, 0.0)
10000 3000 (-1.0, 0.5)
(-0.5, 0.0)
Reward
7500 2000 (-0.5, 0.5)
5000 (0.0, 0.5)
2500 1000 (-1.0, -0.5, 0.0)
(-1.0, -0.5, 0.5)
(-1.0, 0.0, 0.5)
0.00 0.25 0.50 0.75 1.00 0.00 0.25 0.50 0.75 1.00 (-0.5, 0.0, 0.5)
Time steps (1e6) 1e6
Time steps (1e6) 1e6
(-1.0, -0.5, 0.0, 0.5)
Figure 6: Results across 10 seeds for different sets of possible optimism settings. Shaded regions
denote one half standard deviation.
Reward curves for TOP-RAD and RAD on pixel-based tasks from the DM Control Suite are shown
in Figure 7.
Cheetah, Run Finger, Spin Walker, Walk
1000 1000
800 800 800
600 600 600
400 400 400
RAD
200 TOP-RAD 200 200
0 200000 400000 0 200000 400000 0 200000 400000
Cartpole, Swing Reacher, Easy Cup, Catch
1000 1000
800 750
600 750
500 500
400
200 250 250
0 200000 400000 0 200000 400000 0 200000 400000
Figure 7: Results across 10 seeds for DM Control tasks. Shaded regions denote one half std.
B Further Experimental Details
All experiments were run on an internal cluster containing a mixture of GeForce GTX 1080, GeForce
2080, and Quadro P5000 GPUs. Each individual run was performed on a single GPU and lasted
between 3 and 18 hours, depending on the task and GPU model. The Mujoco OpenAI Gym tasks
licensing information is given at https://github.com/openai/gym/blob/master/LICENSE.
md, and the DM control tasks are licensed under Apache License 2.0.
Our baseline implementations for TD3 and SAC are the same as those from Ball and Roberts [2021].
They can be found at https://github.com/fiorenza2/TD3_PyTorch and https://github.
com/fiorenza2/SAC_PyTorch. We use the same base hyperparameters across all experiments,
displayed in Table 3.
15Table 3: Mujoco hyperparameters, used for all experiments.
Hyperparameter TOP TD3 SAC
Collection Steps 1000 1000 1000
Random Action Steps 10000 10000 10000
Network Hidden Layers 256:256 256:256 256:256
Learning Rate 3 × 10⁻⁴ 3 × 10⁻⁴ 3 × 10⁻⁴
Optimizer Adam Adam Adam
Replay Buffer Size 1 × 10⁶ 1 × 10⁶ 1 × 10⁶
Action Limit [−1, 1] [−1, 1] [−1, 1]
Exponential Moving Avg. Parameters 5 × 10⁻³ 5 × 10⁻³ 5 × 10⁻³
(Critic Update:Environment Step) Ratio 1 1 1
(Policy Update:Environment Step) Ratio 2 2 1
Has Target Policy? Yes Yes No
Expected Entropy Target N/A N/A −dim(A)
Policy Log-Variance Limits N/A N/A [−20, 2]
Target Policy σ 0.2 0.2 N/A
Target Policy Clip Range [−0.5, 0.5] [−0.5, 0.5] N/A
Rollout Policy σ 0.1 0.1 N/A
Number of Quantiles 50 N/A N/A
Huber parameter κ 1.0 N/A N/A
Bandit Learning Rate 0.1 N/A N/A
β Options {−1, 0} N/A N/A
C Further Algorithm Details
The procedures for updating the critics and the actor for TOP-TD3 are described in detail in Algo-
rithm 2 and Algorithm 3.
Algorithm 2: UpdateCritics
1: Input: Transitions (s, a, r, s0 )N
optimism parameter β, policy parameters θ, critic parameters
n=1 ,
φ1 and φ2 .
2: Set smoothed target action (see (3))
ã = πθ0 (s0 ) + , ∼ clip(N (0, s2 ), −c, c)
3: Compute quantiles q̄ (k) (s0 , ã) and σ (k) (s0 , ã) using (7).
4: Belief distribution: q̃ (k) ← q̄ (k) + βσ (k)
5: Target y (k) ← r + γ q̃ (k)
6: Update critics using ∆φi from (9).
Algorithm 3: UpdateActor
1: Input: Transitions (s, a, r, s0 )N optimism parameter β, critic parameters φ1 , φ2 , actor param-
n=1 ,
eters θ.
2: Compute quantiles q̄ (k) (s, a) and σ (k) (s, a) using (7).
3: Belief distributions: q̃ (k) ← q̄ (k) + βσ (k)
PK
4: Compute values: Q(s, a) ← K −1 k=1 q̃ (k)
5: Update θ: X
∆θ ∝ N −1 ∇a Q(s, a) a=π (s) ∇θ πθ (s).
θ
16Table 4: DM Control hyperparameters for RAD and TOP-RAD; TOP-specific settings are in purple.
Hyperparameter Value
Augmentation Crop - walker, walk; Translate - otherwise
Observation rendering (100, 100)
Observation down/upsampling (84, 84) (crop); (108, 108) (translate)
Replay buffer size 100000
Initial steps 1000
Stacked frames 3
Action repeat 2 finger, spin; walker, walk
8 cartpole, swingup
4 otherwise
Hidden units (MLP) 1024
Evaluation episodes 10
Optimizer Adam
(β1 , β2 ) → (fθ , πψ , Qφ ) (0.9, 0.999
(β1 , β2 ) → (α) (0.5, 0.999
Learning rate (fθ , πψ , Qφ ) 2e-4 cheetah, run
1e-3 otherwise
Learning rate (α) 1e-4
Batch size 128
Q function EMA τ 0.01
Critic target update freq 2
Convolutional layers 4
Number of filters 32
Nonlinearity ReLu
Encoder EMA τ 0.05
Latent dimension 50
Discount γ 0.99
Initial Temperature 0.1
Number of Quantiles 50
Huber parameter κ 1.0
Bandit Learning Rate 0.1
β Options {−1, 0}
D Connection to Model Selection
In order to enable adaptation, we make use of an approach inspired by recent results in the model
selection for contextual bandits literature. As opposed to the traditional setting of Multi-Armed
Bandit problems, the ”arm” choices in the model selection setting are not stationary arms, but
learning algorithms. The objective is to choose in an online manner, the best algorithm for the task
at hand.The setting of model selection for contextual bandits is a much more challenging setting
than selecting among rewards generated from a set of arms with fixed means. Algorithms such
as CORRAL [Agarwal et al., 2017, Pacchiano et al., 2020d] or regret balancing [Pacchiano et al.,
2020b] can be used to select among a collection of bandit algorithms designed to solve a particular
bandit instance, while guaranteeing to incur a regret that scales with the best choice among them.
Unfortunately, most of these techniques, perhaps as a result of their recent nature, have not been used
in real deep learning systems and particularly not in deep RL.
While it may be impossible to show a precise theoretical result for our setting due to the function
approximation regime we are working in, we do note that our approach is based on a framework that
under the right settings can provide a meaningful regret bound. In figure 5 we show that our approach
is able to adapt and compete against the best fixed optimistic choice in hindsight. These are precisely
the types of guarantees that can be found in theoretical model selection works such as Agarwal et al.
[2017], Pacchiano et al. [2020d,b]. What is more, beyond being able to compete against the best fixed
choice, this flexibility may result in the algorithm outperforming any of these. In figure 5, Ant-v2 we
show this to be the case.
17E Proofs
Proof of Proposition 1. Let qZ π be the quantile function of Z π (s, a) knowing and σ and qZ̄ be the
quantile function of Z̄. Since and σ are known, the quantile qZ π is given by:
qZ π (u) = qZ̄ (u) + σ(s, a).
Therefore, recalling that has 0 means and is independent from σ, it follows that
qZ̄ (u) = E [qZ π (u)]
The second identity follows directly by definition of Z π (s, a):
Z π (s, a) = Z̄(s, a) + σ(s, a).
18You can also read