COVID-19 - IMPACT ON THE FISHERIES SECTOR IN THE NORTH ATLANTIC - North Atlantic Fisheries Intelligence Group
←
→
Page content transcription
If your browser does not render page correctly, please read the page content below
COVID-19

IMPACT ON THE FISHERIES SECTOR IN THE NORTH ATLANTIC
Executive Summary

  The report highlights key changes in the fisheries sector in the North Atlantic region as a
  consequence of and in response to the COVID-19 pandemic.

        Key Changes:
   •   The collapse of the hotel, restaurant and catering sector leading to the collapse of the
       market high value ‘restaurant species’, such as lobster, shrimp, halibut and turbot.

   •   There are difficulties in maintaining exports because of reduction in demand and logistical
       problems. This caused either a diversion of product into domestic markets or pressure on
       cold store facilities.

   •   There has been a significant increase in home consumption of fish, but with a preference
       for prepacked, packaged, canned and frozen products. Demand for fresh/chilled fish has
       declined.

   •   There has been a marked increase in direct business to customer sales using e-commerce
       and social media. This change is likely to become permanent. Direct boat to consumer sales
       has the potential to cause compliance issues.

   •   Although the demand for processed and packaged fish products has increased, social
       distancing and logistical issues have increased production costs.

   •   The lack of demand in the Far East for farmed Atlantic salmon has been offset by increased
       demand for processed products using salmon in Europe.

                    This report was collated by Emma Attwood and Nick Branigan, July 2020

                                                   1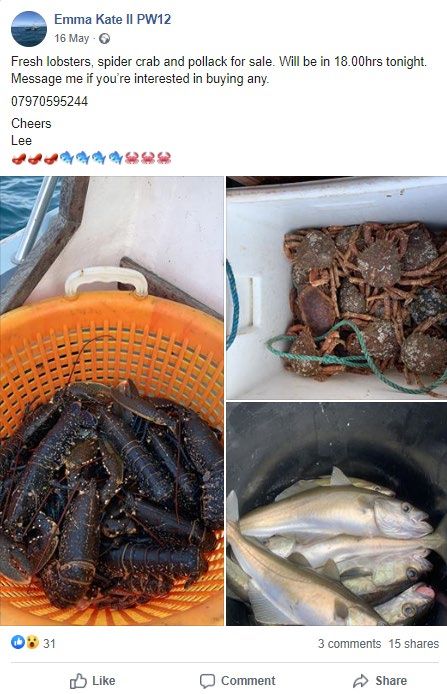
2

Introduction

The world has faced a severe public health emergency due to the novel coronavirus (COVID-19) that
emerged in Wuhan, China in December 2019. Leaping across borders, the virus spread globally and
rapidly, resulting in the declaration of a global pandemic by the World Health Organisation (WHO) on
11 March 2020.

In addition to the health impacts, the pandemic has resulted in the introduction of mandatory
restrictive (“lockdown”) measures by many countries in an attempt to reduce the spread of the virus,
which has had profound impacts on the world economy.

The international nature of fisheries combined with complex supply chains makes the sector
particularly vulnerable. This report aims to illustrate changes in the fisheries sector in the North
Atlantic region as a consequence of and in response to the COVID-19 pandemic, highlighting any
potential new compliance risks. The basis of this report is information supplied by the members of the
North Atlantic Fisheries Intelligence Group, a multiagency international group that aims to combat
economic crime in the fisheries sector.

                                                3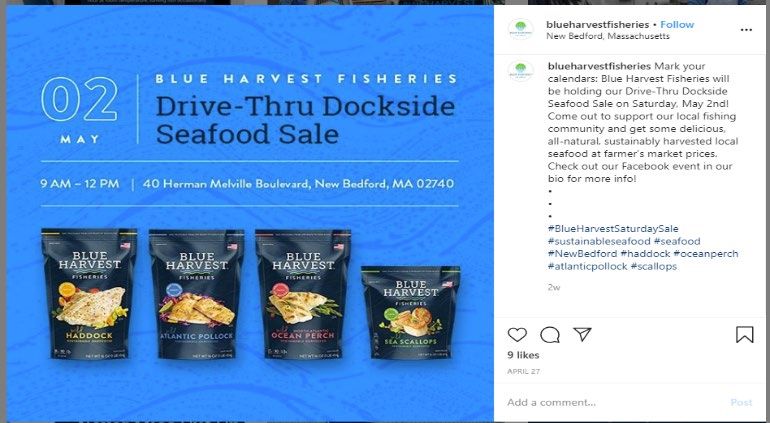
NA-FIG member findings

9 NA-FIG member countries: Canada, Denmark, Greenland, Iceland, Ireland, Norway, Sweden, USA
and the UK were asked to provide findings on any shifts identified in the fisheries sector as a result of
the pandemic. Their responses are summarised below.

CANADA                                                                                             DFO, Canada

The COVID-19 pandemic has seen the following impacts Canada’s fish and seafood sector:

    1. Impact on supply chains

•   An accumulation of perishable inventory due to reduced demand has disproportionately affected
    the supply chain for live and fresh product typically marketed to the food-service industry.

•   A diversion of product normally sold fresh to processing plants has led to increasing concern about
    processing capacity and cold storage. Capacity limitations are caused by physical plant
    infrastructure and physical distancing requirements of staff.

•   Potential delaying of the start of fisheries seasons to avoid accumulation of inventory and allow
    time to implement health and safety measures especially amid concern over worker health and
    safety.

•   A disruption in the logistics of making international shipments and/or greatly increased shipping
    costs. The industry is strained across the US, Europe, Japan and India and this has led to an inability
    to ship key products.

•   Potential long-term disruption to the aquaculture industry. For example, the inability to harvest
    and rotate product may result in long term implications on future harvests.

    2. Impact on value chains

Factors contributing to problems in the value chain:

•   Much of the product traded is highly perishable
•   A high dependence upon export markets: (Canada’s seafood exports made up 80% of its total
    landed quantity in recent years)
•   Significant dependence upon food service sector as the end market

                                                  4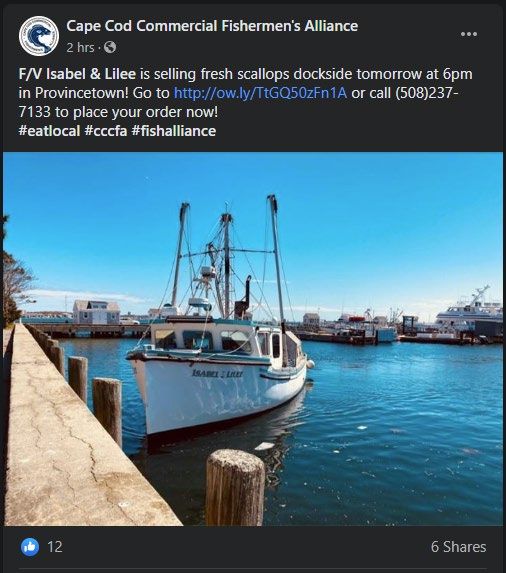
These problems have resulted in other notable shifts in the value chain. For example, foodservice is
now confined to takeout and delivery which has not been an easy shift for all sectors and resulted in
production bottlenecks. In addition, consumers are turning to the web to shop. E-sales of fresh
produce have risen 25% since the virus became severe and online takeaway orders have doubled.

    3. Impact on commodity prices

The vulnerability of Canada’s high-end seafood to global economic downturns was highlighted by the
impacts of the 2008 recession (total fish and exports dropped 6% between 2008 and 2009 and
shellfish, lobster and crab prices all dropped by at least 10%). Closure of restaurants across the US and
uncertainty about the short/medium term impacts of COVID-19 appears to have perturbed the
seafood markets. However, official data is not yet available to allow an analysis of landings prices for
2020.

    4. Workforce Impacts

There are growing concerns over several issues in relation to the fishing industry workforce. These
include crew availability, difficulties with physical distancing and PPE use aboard fishing vessels and
the older demographic in rural fishing communities.

    5. Economic Impacts

•   Economic activity in Canada’s fish and seafood sector is highly seasonal with the peak activity in
    spring/early summer. There is a lack of comprehensive statistics on landings which means it is not
    yet possible to analyse the impact on economic activity in the seafood sector.

•   There may be significant socio-economic impacts on recreational fishing due to US/Canada border
    closures.

•   There are concerns that continuations of lockdown measures into late June and July may make it
    unprofitable for fisheries to resume operations.

    6. Other Impacts

•   Cancellation of major events/conferences.

•   A small number of fisheries opening delays have been announced by the DFO but the Minister has
    asserted that no outright closures are being considered at this time.

                                                 5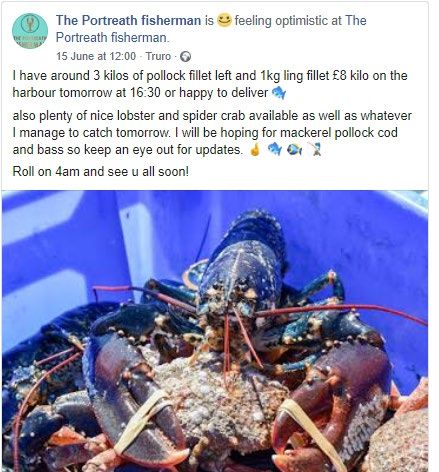
DENMARK                                                                                               Danish customs

The COVID-19 crisis and lockdown has had limited impact on the Danish marine capture sector, with
a normal pattern of landings.

The facilities for processing Norwegian lobster ceased operations due to the lack of demand due to
the closure of restaurants across Europe. Vessels targeting Norwegian lobster have therefore
remained in port.

From a tax and VAT perspective and as part of the financial aid packages introduced in Denmark as a
response to the crisis, the deadline for the filing of tax returns and VAT declarations has been deferred
to autumn 2020.

The absence of returns means that the tax authority doesn’t currently have enough data to carry out
a proper analysis, and therefore is not yet in a position to determine the financial impact of COVID-19
on the fisheries sector in Denmark.

GREENLAND                                                                         Fisheries Authorities, Greenland

The COVID-19 crisis appears to have had little impact on the Greenland fisheries sector.

The requirement to land catches of Greenland Halibut in Greenland has been reviewed as sales of
fillets (25% of the catch) was almost wholly to the restaurant/catering trade which has collapsed
whereas sales of whole halibut is more marketable if landed outside Greenland.

Naalakkersuisut decided to reduce the landing obligation for Greenland Halibut by 50 % subject to
review every 3 months.

                                                 6
ICELAND                                                                                                                                         Fisheries Iceland

Like most countries, Iceland has been dealing with the effects of COVID-19. At first, it appeared to not
be having much effect on the fisheries sector. For example, figures showing the quantity of landed cod
for period January through April 2020 were not too different from the amounts landed in 2018 and
2019. (See Figure 1 below)

                                                           QUANTITY OF LANED COD (kg) January - April
        2017                                                                                         69,308
        2018                                                                                                                        93,540
 Year

        2019                                                                                                                        93,561
        2020                                                                                                                       91,878

               0                     10,000       20,000   30,000   40,000     50,000      60,000           70,000        80,000     90,000   100,000
                                                                      Quantity landed (kg)
Figure 1: Quantity of landed cod (kg) Jan – April for years 2017 – 2020.

However, as can be seen in Figure 2 below, according to bureau of statistics in Iceland, export values
have plummeted since the onset of COVID-19. Through weeks 13 to 17 exports are around 6 billion
ISK (EUR 40 million) lower than in 2019. This amounts to a circa 25% decrease in export values.

                                                                    FISH EXPORTS (bn ISK)
                                                                          2019           2020
                     Billion (ISK)

                                              1    2   3    4   5   6   7     8      9   10     11     12     13     14   15   16    17
                                                                        Week Number

                   Figure 2: Icelandic fish exports (bn ISK) 2019 and 2020.

                                                                                 7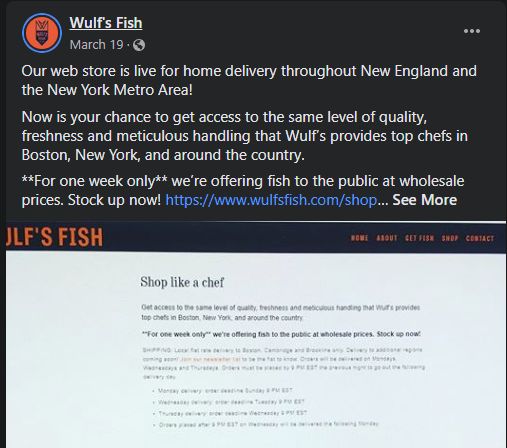
Effect on seafood market
According to Fisheries Iceland (the manufacturers and ship-owners association) the impact on the
fisheries sector has been extensive. Most markets have tightened while others have almost
completely shut down, especially European markets for fresh fish and in some cases markets for
farmed salmon.

There has been a decline in prices for seafood, cancellation of orders and deferred payments. Many
manufacturers have responded by producing more frozen products and so have been able to put more
into cold storage. Furthermore, there has been increase in production of salted products/salt-fish
which can be stored for longer.

The transport of goods hasn’t been much affected, and airfreight has not shut down although
passenger flights have mostly been cancelled due to the COVID-19 pandemic. The biggest problem
noted by Fisheries Iceland during this period has been the transport of goods within Europe.

        Effect on surveillance effort
The Icelandic Directorate of Fisheries surveillance effort was, and still is in many ways, affected by the
COVID-19 outbreak, both at sea and on land. In accordance with directions given by the Ministry of
Health, inspections were not carried out at fish processing plants from mid-March to mid-June.
Likewise, inspections at-sea were not carried out due to risk of infection on board.

The reaction to circumstances has been to focus more on electronic surveillance, data
inspection/comparison and surveillance whilst “keeping a safe distance”. With decline in COVID-19
cases, surveillance activities mostly returning to normal. However, some vessels are reluctant to take
an inspector on board, and most production facilities are taking precautionary measures to ensure
safety among workers.

                                                  8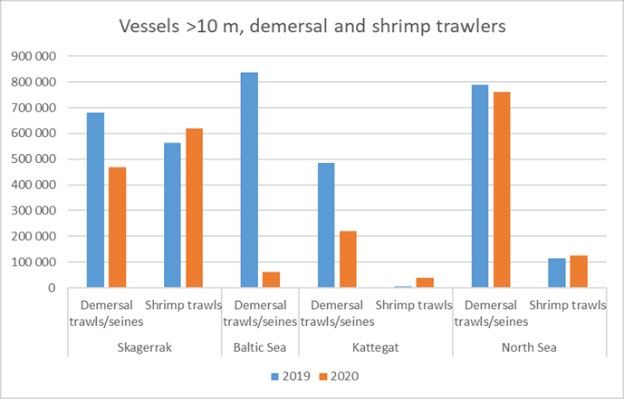
IRELAND                                                                                        SFPA, Ireland

        Irish Government Response
The Irish Government announced a series of significant restrictive measures to try to contain the
spread of COVID-19 in March 2020. Specifically, on the 27th March the Government announced
restriction of travel to and from work with the exception of designated essential services. The role of
the fishing industry and the SFPA was designated as an essential service due to its role in the provision
and maintenance of the food chain.
There were also a series of economic measures to assist companies remain in business and retain their
staff. These measures included employment related payments to supplement unemployment
stemming from the economic effects of COVID-19, tax changes to help business and automatic
extension of residency permits. A tie-up scheme for fishing vessels has recently been launched by a
Government agency BIM. Further details on this scheme can be found below.
There were also specific procedures with regard to foreign vessel landings into Irish ports (see
Information Notice Harbours in Appendix A) and Marine Notice 6 of 2020 from the Department of
Transport, Tourism and Sport’s website. This notice sets out procedures for the notification of possible
cases of COVID-19 and safe landing procedures for crew and local communities.

        Fishery related activity, late March – Mid May 2020

During the initial weeks of the pandemic’s impact, in Ireland and Europe there was a considerable
downturn in the demand for fish and related fish processing activity. This was most evident in demand
from the HORECA1 sector. This had a particular impact on the fish being targeted by vessels in that
fish normally with a ready market for restaurant use, disappeared completely. Landings were lower
during this time (see Figure 3) when fishers were unsure if they would cover their costs as markets
were so uncertain.

About 70 % of the fish processing side of the food chain remained open during the early weeks of the
impact and some of these operating at significantly reduced capacity. There was an interest by fishers
to supply the retail trade / consumer directly and advice on the regulations was provided for such
situations.

    1HORECA   = HOtel, REstaurant & CAtering

                                                 9
TRENDS IN (IRISH FLEET > 12m) LANDINGS INTO IRELAND, 2019 AND 2020
Number of trips per week
Figure 3: Electronic landings data for Irish fleet, 2019 vs 2020.
Compliance
• Food business inspections were more difficult to carry out throughout the crisis due to safety
concerns of both the operator and staff.
• Inspections on landing continued in the lockdown period but with restrictive measures in place
such as social distancing. At sea inspection capability was reduced and in the later stages of the
lockdown, resources were reassigned.
• Throughout the crisis, suspected non compliances in landing inspections were more difficult to
identify.
• Courts have remained opened throughout the lockdown period, although interviews under
caution with skippers were more difficult.
Introduction of the Irish Government Tie-up scheme:
The Irish Government Tie-Up scheme is being coordinated by BIM on behalf of the Minister of
Agriculture, Food and the Marine. The purpose of the scheme is to reduce the volume of seafood
entering the market which has been depressed by the COVID-19 Pandemic, while at the same time
keeping an adequate number of vessels fishing to maintain a food supply. The scheme is designed to
support fixed costs incurred by owners of vessels while tied up. The Scheme will be reviewed at the
end of each month and the Minister for Agriculture, Food and the Marine reserves the right to
terminate the Scheme at any time.
A maximum of two thirds (66%) of the number of vessels in each of eight vessel length categories will
be approved for support for any particular one-month period, ensuring that some vessels are always
available to fish and continue to supply the market. The grant-aid is available to owners of Irish-sea
fishing boats that meet certain eligibility criteria. More on the scheme can be found in Appendix A.
10NORWAY Norwegian Customs / Norwegian Coastguard
For the first time since September 2018, there has been a fall in the value of seafood exports from
Norway. In April 2020, there was a decrease in value of 8%, compared with April 2019, despite a
marked weakening of the Norwegian krone (NOK). Volumes were also down 7% compared to April
2019.
Restrictions due to COVID-19 pandemic were introduced in mid-March. Therefore, export data from
the periods of week 2-11 and 12-18 2020 have been compared. Key findings are summarised below:
General Trends
• A fall in demand for salmon and whitefish caused by the decline of the restaurant sector and
increased air freight costs for the transportation of fresh products to overseas markets.
• A growth in exports to processing markets due to an increase in demand for prepackaged, frozen
and processed products for home consumption in several markets.
• Falling export prices, measured in foreign currencies like US dollars and Euros. Value growth in
April 2020 for some species, measured in Norwegian kroner, is mainly caused by a weaker
Norwegian kroner.
• Reduced airfreight and ferry capacity from Norway has impacted seafood exports.
Transport
• Approximately 87% of Norwegian seafood is exported (46% by road and 41% by ship).
• A comparison of export data pre and post introduction of restrictions show the average weekly
volume of frozen mackerel and herring carried in reefers was reduced by 59%.
• Similarly, the volume of fresh trout and salmon exports by road was down 7% in the same period,
and average airfreight volumes of fresh cod, trout and salmon were down 9%.
11Changes in Exports of most important species
Figure 4 below compares fish exports pre-and-post- the introductions of restrictive measures in
Norway. Findings show a decrease in weekly export volumes post restrictions for all species other than
frozen salmon fillets which increased 26%. On the other hand, price value variations were species-
dependant. As previously mentioned, these could be result of the decrease in value of the Norwegian
kroner.
CHANGES IN EXPORT VOLUME & PRICE BY SPECIES
Average weekly export VOLUME difference (weeks 2-11 vs 12-18)
Average weekly VALUE (NOK) difference (weeks 2-11 vs 12-18)
SALMON TROUT COD SAITHE HERRING MACKREL KING CRAG
26% F R O Z E N F I L L E T S
FROZEN FILLETS
FROZEN WHOLE
WHOLE FROZEN
DRIED/SALTED
DRIED/SALTED
FRESH WHOLE
FRESH WHOLE
FROZEN
FROZEN
FRESH
LIVE
21%
13%
12%
10%
6%
6%
6%
4%
0%
-7%
-7%
-9%
-12%
-12%
-17%
-18%
-23%
-33%
-50%
-51%
-51%
-66%
-83%
Figure 4: Summary of changes in average weekly export volumes and average weekly prices of different species of fish. Compares export data from weeks 2-11 vs
12-18 of 2020.
Consequences
• A reduction in exports may result in increasing pressure on cold store and storage facilities whilst
exporters seek new markets.
• Domestic consumption within Norway cannot absorb the volume reduction in exports.
• Lower export prices and stress on storage facilities may result in increased smuggling and
misreporting.
12Compliance Activity
Compliance activity by the Norwegian coast guard stopped on the 12th of March in response to the
COVID-19 pandemic. Visits and inspections were stopped but the coast guard remained on patrol and
were available to contact via phone/radio if help was required by vessels.
• The pause period lasted 3 weeks during which there were no inspections at sea and no controls
or inspections of fish landings. One trend was that the coast guard received more tip offs than
normal reporting illegal fishing activities (e.g. nets, transshipments between vessels, discards of
fish).
• Normally a change in behavior is observed when the coast guard diverted are away from
compliance activities, and in this instance an increase in discarding events (by both aircraft &
patrol vessels) was noted.
• The first inspection since compliance activity paused took place on 1 April following a strict COVID-
19 risk assessment. The coast guard successfully arrested a Russian trawler for discarding cod and
haddock with new safety measures being followed.
• Compliance activities are slowly returning to normal, although vessels can now refuse to be
inspected and new COVID-19 risk procedures are in place.
Norwegian Seafood Council Report2
The Norwegian Seafood council published a report 6th July 2020 on seafood exports in the first half of
2020. The report found that the export value of Norwegian seafood reached an all-time high for the
first half of the year, with an increase in value of 3.5 per cent measured against the first half of 2019.
A weak Norwegian krone is the main factor driving growth, but increased quotas for mackerel,
increased production of trout and a turn towards more consumption of salmon fillet have also helped
to raise the export value.
The report observes that despite the overall picture showing growth in value for Norwegian seafood
exports in the first half of the year, several species and product types have experienced a decline in
value, such as fresh cod, prawn and king crab. The three factors in particular contributing to this: are
an almost global shutdown of the hotel and restaurant segment, fewer flights due to severe travel
restrictions, and very bad weather in the main season for fresh cod which resulted in reduced catches.
Salted fish, scallops and codfish were also hit hard in the first half of the year. This is caused by,
amongst other factors, major challenges associated with the corona virus in traditionally large markets
such as Brazil and Italy. There was also a decline in the export price for some products, which indicates
a fall in demand. Reduced purchasing power, the risk of the COVID-19 virus flaring up again and
uncertainty in the value chain are factors that make future prospects uncertain.
2https://en.seafood.no/news-and-media/news-archive/weak-norwegian-kroner-leads-to-best-ever-first-half-year-for-
seafood-exports/
13SWEDEN Swedish Agency for Marine and Water management
Fishery related activities January – June 2020 compared to 2019
Swedish fisheries control, both at sea and on land, continued as usual during the COVID-19 crisis, but
with safety restrictions for both inspectors and fishermen including a pause in controls on small-scale
coastal fishermen in vulnerable age groups. Patrols were made up of the same people in order to
reduce the number of social contacts.
COVID-19 has to some extent affected all Swedish fisheries, with the largest impact on coastal
demersal fishing using vessels >10 meters in length. In the Skagerrak and Kattegat, fishing has
decreased by 26%. An exception is the shrimp fishery, which has increased by 15%. In this fishery, the
number of controls to ensure compliance with landing obligations increased from 56 to 87.
Cod fishing in the Baltic Sea has decreased drastically (by 80%) but this was unrelated to the COVID-
19 pandemic. The critical state of cod stocks in the Baltic Sea has resulted in a ban on fishing for cod
in subareas 25 and 26, and in subarea 24 outside 6 Nm from the baseline.
The large-scale pelagic fishing has decreased by about 16%, and there has also been a change in fishing
patterns in several of the sea areas compared with 2019. Industrial fishing in the Baltic Sea, which
normally occurs in January to March has shown a large decrease (40%) compared with the same period
in 2019. This change cannot be attributed to the COVID-19 pandemic as the COVID-19 restrictions
were put in place in mid-March. Instead the focus shifted, with fishing in the North Sea for sandeel
and mackerel increasing dramatically by 120% and 300% respectively.
Small-scale fishing with vesselsVESSELS >10m, EXC. DEMERSAL AND SHRIMP TRAWLERS VESSELS >10m, DEMERSAL AND SHRIMP TRAWLERS
Figure 6: Vessels > 10 m, exclusive demersal and shrimp trawlers Figure 7: Vessels > 10 m, demersal and shrimp fisheries, trawler/seines
Figure 8: Fishing area, pelagic trawler/seines
Salmon fishery and controls in the Baltic Sea
Early in the spring there was a COVID-19 related travel ban in Sweden which affected the possibility
of carrying out landing controls in the northern part of Sweden (Baltic sea) as there are no permanent
inspectors in that area of the country. Therefore, the control plan for the Salmon fishery was to not
conduct any landing controls at all and instead extend administrative controls on the fishermen’s trade
in salmon in the autumn of 2020. At short notice, the travel ban was lifted, and a smaller force of
inspectors went to the areas around the Gulf of Bothnia. So far, the landing controls have been
effective and about twenty controls have been conducted. There is a high level of compliance from
the fishermen, but there are difficulties in controlling certain priority subjects since the landing places
in the archipelago are inaccessible due to lack of boats.
New rules introduced for this fishing season, including the requirement to indicate the position of the
fishing gear before fishing begins, have not been satisfactorily complied with. The reasons why the
level of compliance is low will be analysed at a later point. Another new requirement is the mandatory
pre-notification of landings from freshwater areas bordering the Baltic Sea, which seems to have a
high compliance rate. This requirement gives us more information about who is fishing and when this
fishing takes place, which will help us to differentiate between quota and non-quota salmon at the
trading stage.
15Due to the dioxin problems with the salmon from the Baltic Sea, EU regulations do not allow this
salmon to be placed on the market without sampling, to ensure that it is within the legal/safe levels.
Sweden, Finland and Latvia have exceptions from the regulations, as these countries provide
consumers with information on how often this fish can be used for human consumption. Before the
fishing began, in mid-June, there was a risk that the border to Finland would remain closed, which
would have made sales to Finland difficult. When fishing began, it was possible to transport the fish
and sell it to/in Finland. Trade with Finland has increased this year and the presumed reason is that
the price received from Swedish first-buyers has fallen considerably. However, sales from the vessels
in the local market along the northern Baltic coast are still high in relation to other fisheries in Sweden.
As a result of the COVID-19 pandemic, collaboration between the Swedish Marine and Water
Management Agency and the Swedish Food Agency has been expanded and the more locally stationed
food inspectors have obtained information from first buyers that will be useful in the administrative
controls to take place later in 2020.
Impact on imports
Swedish imports of fishery products were compared by taking the total number of consignments
imported per country from January to April 2020 and comparing the values with the same period last
year (2019). The data was compared for the five largest importing countries (Norway (~ 90 %), China,
Thailand, Canada and Iceland).
The percentage changes in number of imports of consignments for April 2019 vs 2020 are
summarised in figures 9 to 18. For each importing country, this figure is then compared against
general import data trends as observed over the past 5 years.
Norwegian imports
NORWEIGAN IMPORTS APRIL 19 VS
APRIL 20 NORWEGIAN IMPORTS 2014 - 2019
16000
5,300
Number of consignments
Number of consignments
15500
5,250 15000
5,200 14500
14000
5,150 13500
5,100 13000
5,050 12500
04-2019 04-2020 2014 2015 2016 2017 2018 2019
Year Year
Figure 9: No. of consignment imports from Norway April 2019 vs 2020. Figure 10: No. of consignment imports from Norway 2014 – 2019.
The decrease in number of consignment imports from Norway in April 2019 vs 2020 reflects a similar
pattern observed over the last 3 years.
16Thai imports
THAI IMPORTS APRIL 19 VS APRIL
THAI IMPORTS 2014 - 2019
20
300
Number of consignments
Number of consignments
80
250
60
200
40 150
100
20
50
0 0
04-2019 04-2020 2014 2015 2016 2017 2018 2019
Year Year
Figure 11: No. of consignment imports from Thailand April 2019 vs 2020. Figure 12: No. of consignment imports from Thailand 2014 – 2019.
There were no consignment imports from Thailand in April 2019 compared with 60+ consignments
imported in April 2020. Generally, the number of imports from Thailand decreased from 2018 to 2019.
Canadian imports
CANADIAN IMPORTS APRIL 19 VS CANADIAN IMPORTS 2014 - 2019
APRIL 20
300
Number of consignments
Number of consignments
50
48
200
46 100
44 0
04-2019 04-2020 2014 2015 2016 2017 2018 2019
Year Year
Figure 13: No. of consignment imports from Canada April 2019 vs 2020. Figure 14: No. of consignment imports from Canada 2014 – 2019.
The changes in numbers of consignments imported from Canada 2019 vs 2020 are too similar to draw
any relevant comparisons or conclusions.
Chinese imports
CHINESE IMPORTS APRIL 19 VS CHINESE IMPORTS 2014 - 2019
APRIL 20
800
Number of consignments
Number of consignments
250
200 600
150 400
100
200
50
0
0
2014 2015 2016 2017 2018 2019
04-2019 04-2020
Year Year
Figure 15: No. of consignment imports from China April 2019 vs 2020. Figure 16: No. of consignment imports from China April 2014 – 2019.
17The number of consignment imports from China have declined 33% when comparing April 2019 and
April 2020. This is despite an average increase of 9% per year in all consignments from China since
2014. This could possibly be an effect of the COVID-19 crisis.
Icelandic imports
ICELANDIC IMPORTS APRIL 19 VS ICELANDIC IMPORTS 2014 - 2019
APRIL 20
250
100
Number of consignments
Number of consignments
200
150
50
100
50
0 0
04-2019 04-2020 2014 2015 2016 2017 2018 2019
Year Year
Figure 17: No. of consignment imports from Iceland April 2019 vs 2020. Figure 18: No. of consignment imports from Iceland 2014 – 2019.
The figures show an increased number of consignment imports from Iceland in April 2020. This seems
to match the general trend from 2017 to 2019.
Direct landings from third country vessels
So far, in the first months of 2020 compared to the first months of last year, there has been an increase
in the number of Norwegian direct landings in Sweden (42 %) and an increase in the number of fishing
vessels landing their catches (from three to six). Norwegian landings of shrimps have increased by
almost 90 %, from 35 to 66 tons.
There have been no direct landings from other third countries other than Norway.
18USA NOAA Fisheries Office of Law Enforcement
Along with many other industries, the commercial fishing and seafood industries had to adapt quickly
for dealing with the COVID-19 pandemic. Three adaptations that continue to influence these industries
in the Northeast United States are: reduced fishing effort, the waiver of observer coverage and a shift
from a multi-layered supply chain model. This shift has occurred in both direct sales from boat to
consumer (pop-up sales) and from wholesalers direct to the consumer.
1. Reduced fishing effort
An analysis of VMS (Vessel Monitoring System) data in the North East region shows there has been
an overall decrease in fishing activity. Prices have dropped, markets closed, seasons ended, and new
ones began. Overall, the number of trips reduced by about 21% in March and April in 2020 as
compared to 2019 according to VMS data as per Figure 19 below. Figure 20 shows a further analysis
of the difference in number of trips in April 2019 vs April 2020 by reference to targeted species.
VMS TRIP COUNT IN THE NORTH
EAST REGION
3184
2536
2400
1869
2019 2020 2019 2020
MARCH APRIL
Figure 19: VMS trip count in the North East region - March and April
comparison
VMS TRIP COUNT PERCENTAGE DIFFERENCE APRIL
2019 VS APRIL 2020
143%
31%
27%
7%
-11%
D O F P O T -21%
D O F D R E D G E -21%
-23%
-24%
M O N K F I S H -32%
D O F T R A W L -37%
-38%
GENERAL…
SURF CLAM &
LIMITED ACCESS
COMMON POOL
MULTISPECIES
MACKEREL
DOF GILLNET
HERRING
SCALLOP
MULTISPECIES
SQUID &
QUAHOG
SECTOR
SCALLOP
Figure 20: VMS strip count % difference by species April 2019 vs 2020
19TO NOTE: This analysis only includes fleets/vessels required to operate VMS. In new England and
mid-Atlantic region this is circa 1,000 vessels. It is very difficult to gauge how the pandemic has
affected the activity of vessels without VMS
Further notes on important species
Scallop: This fishery has a product with a high unit value so it can operate at low volumes whilst
remaining profitable. The season opened 1 April. There is a general observed reduction in activity.
Bluefin tuna: The season starts on 1 June 2020. It is unclear how this species will be affected yet as
it’s a high-value product with both domestic and international markets. The direct to consumer model
is not an option and there is the risk that with more people unemployed there will be more
opportunity to fish but with no avenue for legal sales. NOAA recognises the need to conduct more
outreach and compliance assistance on reporting requirements.
Northeast Multispecies/Ground Fish: There was an initial observed reduction in trip numbers because
of uncertainty over restaurant sector demand etc. There was an observed shift to direct sales to
consumer markets and online sales. Trip numbers then were relatively steady or slightly increased.
One possibility for this could be the cessation of observer deployments. The absence of observers may
be incentivising the fleet to harvest as much fish as they can now, so they do not have to pay for
observer coverage later and to avoid the scrutiny provided by observers.
2. Impact on supply chains
Traditionally, large wholesale dealers buy northeast fishery products and distribute them to
restaurants, box stores, and other markets. The ongoing pandemic has caused a direct to consumer
market to develop which has resulted in an increase in new fish dealers (with an increase in dealer
permits issued in the New England and mid-Atlantic region). New dealers leveraged their permits to
start direct to consumer ‘pop-up’ style sale operations, advertising online on the internet and social
media platforms with some offering home delivery. Examples of such advertisements can be found in
Appendix B of this report.
With the increased number of dealers and the direct sales to consumers, the potential for increased
misreporting and/or under-reporting is of concern. Officers and agents are providing outreach and
compliance assistance to help these new operators be aware of reporting requirements. Social media
monitoring will become a useful tool to identify sales for further investigation if needed.
3. Observer waivers
In the Northeast, observer and at-sea monitor coverage has been waived. Some of the concerns with
this waiver include less visibility on fisheries like groundfish, where discards are highly regulated, shifts
in industry behaviour, and potential observer safety concerns when they return to work. Some vessels
have to pay for observers so going forward, vessel owners may be reluctant to incur these costs and
may attempt to circumvent the rules.
20UK Marine Scotland / HM Revenue & Customs
General update
The Scottish fleets have been severely curtailed with lack of markets both in the far East and across
Europe. In Scotland the Industry has been supported by a hardship fund set up by the government.
This is made up of 2 funds; 1 for vessels below 12m (mostly shellfish vessels) and the second for over
12m vessels (many of which are small trawlers targeting Nephrops). Similar financial support
packages have been introduced in the other countries of the UK.
Notable changes by species
Pelagic: The bulk of the Scottish Winter Mackerel fishery was finished before Covid-19 impacted so
the catching season had almost finished (apart from Blue whiting which mainly goes for fish meal).
There were reports of Faroese, Russian and Icelandic vessels encroaching into UK waters whilst
targeting Blue Whiting. A Marine Protection Vessel was tasked to the area, but no incursions were
detected.
Demersal : Markets across Europe were badly affected initially, especially in France where the French
industry demanded only French caught fish be sold in France. This has now been resolved and markets
are slowly beginning to pick up. The Scottish Demersal fleet has asked for help and all have accepted
an 8 day tie up scheme to try and stagger the landings from vessels across the month. There has been
an international fishery active at Rockall and into NAFO waters (mainly Haddock) but there have been
good reports of other species throughout the fishery.
Nephrop: This fishery was severely restricted for a period with markets almost drying up completely
and still remains severely restricted.
Shellfish: There have been no changes with regard to crab and lobster as markets are only just
beginning to open up albeit slowly.
Shift in supply chain
One area where markets have bucked the trend has been with vessels fishing to the community and
using social media to alert people of what they have to offer either from the quay side or delivered to
people’s doors. It will be interesting to see if this trend continues going forward.
There is a trend in vessels avoiding land declarations by selling directly to public – often neither party
is registered as buyers/sellers. There are limits on what they can do before they are committing a
criminal offence.
21Compliance
Enforcement throughout the lockdown period was drastically curtailed with many compliance staff
assisting with the COVID-19 effort; be that delivering medicine to some outlying areas or just
supporting the local community any way possible. As restrictions ease, Marine Scotland look towards
how to enforce the industry going forward.
CUSTOMS DATA ANALYSIS
UK Customs data comparing fish products imported/exported in weeks 11-19 of 2019 vs the same
period of 2020 was analysed. For reference, full ‘lockdown’ restrictive measures were introduced in
the UK in week 14. The below information highlights some key trends observed.
TO NOTE: Data is only available for imports/exports to non-EU countries. Movements to and from
the UK from other Member States cannot be directly monitored.
Export Trends
• A decrease in the total net mass of all fish exports (23%) as well as a decrease in the total customs
value of all exports (35%) was observed.
• The 3 species that made up 80+% of all exports (by weight) in 2019 were: Salmon (63%) Mackerel
(13%) and Whelks (5%). Figure 21 below compares changes in net mass exports for these 3 species
from the 2019 period to 2020. The graph also compares in the average value (price per kg) of each
species. This suggest that the overall net mass decrease of 23% could be wholly attributable to
reduction in salmon exports.
EXPORT CHANGES - TOP 3 SPECIES
Net VOLUME % change Average VALUE (£/kg) % change
WHELKS MACKEREL SALMON
17%
5%
4%
1%
-6%
-34%
Figure 21: Volume and value comparison of exports of Salmon, Mackerel & Whelks from
weeks 11-19 2019 vs the same period 2020.
22Further analysis of the changes in export volume and price by species and ‘state’ was carried out and
is summarised in Figure 22.
CHANGES IN FISH EXPORTS BY SPECIES AND STATE - 2019 VS 2020
Net VOLUME % change Average VALUE (£/kg) % change
COD HADDOCK HERRING LOBSTER MACKREL SALMON TROUT
PREPARED
PREPARED
PREPARED
PREPARED
PREPARED
FROZEN
FROZEN
FROZEN
FROZEN
FROZEN
FROZEN
FROZEN
FRESH
FRESH
FRESH
FRESH
FRESH
FRESH
129%
98%
71%
49%
46%
47%
48%
40%
9%29%
26%
16%
15%
13%
6%
2%
-7%
-49% -8%
-25%
-25%
-31%
-34%
-38%
-53%
-61%
-98%-66%
-69%
-74%
-79%
-82%
-94%
Figure 22: Volume and value comparison of exports of species by ‘state’ from weeks 11-19 2019 vs the same period 2020.
General trends from Figure 22
• Certain species saw huge increases in mass exports of frozen fish products which suggests increase
in demand for longer life/frozen goods. For example, total mass exports of frozen cod, haddock,
herring & salmon all saw increases in 2020 compared with the same period last year. Notably,
frozen herring exports increased 743%. Further analysis showed that this was largely down to
increased exports in 2020 of ‘whole frozen herring’ to Nigeria and The Ivory Coast.
• Massive decrease in exports for species such as lobster (both fresh and frozen). This is attributable
to the reduced demand from the HORECA sector.
• Across all species, the average value (price per kg) has increased for prepared fish (most notably
for species such as haddock, herring & salmon).
23Salmon exports
As salmon exports make up the majority of the UK’s fish exports (by volume), further analysis was
carried out on this species. As shown in Figure 23 the changes in volumes of exports of Salmon
products from 2019 to 2020 varied depending on country.
CHANGE IN VOLUME OF SAMON
PRODUCT EXPORTS BY COUNTRY 2019 VS
2020
VIETNAM PHILIPPINES
137% CHINA USA TAIWAN
47%
-34%
-51%
-66%
Figure 23: Comparison of change in Salmon product exports weeks 11 - 19 2019 vs
same period 2020.
The increase in salmon exports to Vietnam is marked, however this is skewed by a single 1000 tonne
export of frozen salmon heads in May 2020. This will need to be looked at in further detail.
SALMON EXPORTS BREAKDOWN
Net VOLUME % change Average VALUE (£/kg) % change
FILLETS FILLETS
FILLETS FROZEN MINCED FRESH FROZEN SMOKED
807%
521%
123%
42%
10%
8%
-4%
-7%
-93%
-90%
-59%
-41%
Figure 24: Volume and value comparison of Salmon product exports weeks 11 - 19 2019 vs same period
2020. Breakdown by ‘state’.
If we look at salmon exports by type (Figure 24 above), frozen fillets exports are skewed by 2
consignments of Pacific salmon to Hong Kong. The Customs values for these two consignments look
high, so could be misdescribed. If we ignore these two consignments, then the average price increase
is 27%. Again, if we look at the exports of minced fillets, 75% of the consignments were to Lebanon at
30 times 2019 prices. The reason for this is unclear. However, it does mean that we need to exercise
caution when looking at import/export data trends due to potential misreporting.
24Import trends
• An increase in the total net mass of all fish imports (2%), but a decrease in the total customs value
of all imports (4%) was observed. Figure 25 breaks down the changes in imports of different
species of 2019 vs 2020.
• There has been little change in proportion of species imported by weight of value. The main
imported species are cod, shrimp, tuna, salmon, haddock and pollock (80% of all imports in 2019
and 2020).
CHANGES IN IMPORTED SPECIES BY VOLUME AND AVERAGE
PRICE 2019 VS 2020
Net VOLUME % change Average VALUE (£/kg) % change
COD HADDOCK POLLOCK SALMON SHRIMP
DRIED/SALTED
DRIED/SALTED
SMOKED
SMOKED
FROZEN
FROZEN
FROZEN
FROZEN
FROZEN
FRESH
FRESH
166% F R E S H
FRESH
LIVE
122%
54%
37%
32%
24%
18%
17%
17%
7%
7%
6%
1%
0%
-3%
-3%
-4%
-4%
-14%
-22%
-23%
-27%
-29%
-32%
-35%
-45%
-67%
-63%
Figure 25: Volume and value comparison of change in UK Imports weeks 11 - 19 2019 vs same period 2020. Imports are broken down by
species and their state.
Other Import observations
It is not immediately clear why imports of cod from Faroes increased whereas the supplies from the
main importing countries (Iceland and Russia) decreased (as shown in Figure 26). It should be noted
that much of the imports of cod from the Faroes may be for customers in the rest of Europe. As seen
in Figure 27, there has been a significant increase in salmon imports from Norway. Most salmon
imports are fresh/chilled.
CHANGE IN NET VOLUME OF CHANGE IN NET VOLUME OF
IMPORTS OF COD BY COUNTRY IMPORTS OF SALMON BY COUNTRY
FAROES NORWAY CHINA RUSSIA ICELAND NORWAY CHINA ICELAND USA FAROES
84%
29%
27%
3%
19%
-2%
-24%
-36%
-17%
-26%
Figure 26: Change in net volume of UK Imports of cod by country. Weeks 11- Figure 27: Change in net volume of UK Imports of salmon by country. Weeks
19 2019 vs same period of 2020 compared. 11-19 2019 vs same period of 2020 compared.
25Summary of findings
This section summarises the reports of NA FIG members in combination with information provided by
the European Market Observatory for Fisheries and Aquaculture.3
The collapse of the HORECA sector leading to significant decrease in the demand for high value
products. This has had significant impact on the market for products such as lobster, shellfish, shrimp,
turbot and halibut. Bluefin tuna exports were further impacted by the closure of markets in the Far
East. The European shrimp market was further impacted by a decline in imports from India and
Ecuador. Shrimp imports into the EU dropped 80% by volume in week 17 and the market price reduced
by 7% from the corresponding period in 2019.
Difficulties in maintaining exports because of reduction in demand and logistical problems. Norwegian
exports of pelagics were reduced due to the lack of reefers. Certain European countries (e.g. France
and Italy) created market-driven protectionist policies to protect domestic fisheries which had further
impact on exports to those countries.
Labour supply issues impacted on harvesting and processing in the aquaculture sector combined with
a downturn in the HORECA sector. For instance, in week 18, EU farmed mussel sales had reduced by
80% since the beginning of the crisis.
There has been a temporary increased demand for cold storage. This is particularly evident in
countries such as Canada where the reduction in exports was combined with a reduction in processing
capacity.
There appears to have been a diversion, where capacity permits, to alternative markets. Norwegian
exports of salmon to Polish processing facilities increased due to increased consumer demand in
Germany. Imports of fresh salmon into the UK is not matched by a significant increase in exports to
non-EU countries, confirming press reports that UK processors were able to shift product normally
exported to the Far East to the EU. Home consumption of salmon in Spain, France and the UK
increased by 12%, 21% and 18% respectively in weeks 9 to 12. Similarly, home frozen cod fillet
consumption in France grew by 48% together with increased sales of ready to eat salmon and cod
products. In Germany, in the first quarter of 2020, fish consumption increased by 11%, with a 25%
increase in sales of canned fish and a 14.2% increase in sales of frozen. In Spain, retail sales of fish
increased by 20% in week 17 compared with the same period in 2019. In the UK, one major
supermarket chain has reported a 60% increase in the sales of domestically-sourced fish by selling pre-
packed but fresh fish and the home delivery of fish boxes.
An increase in sales direct to consumers using e-commerce methods including social media. Across
the EU, online sales increased by 25% and online takeaway home deliveries increased by 100%. This
shift to direct sales to consumers is marked and may become permanent. A number of countries (USA,
Ireland, Scotland) implemented outreach measures to ensure that the regulations were being adhered
to. The establishment of permanent boat to consumer sales is likely to require changes to fisheries
control mechanisms.
3European Market Observatory for Fisheries and Aquaculture (EMOFA) reports can be found here: https://www.eumofa.eu/covid-19
26These new methods of direct sales appear to have arisen in countries with domestic consumer
capacity. In predominantly fish exporting countries such as Iceland and Norway consumer capacity is
likely to be already maximised and so there is no ability to increase domestic consumption. Therefore,
any production not exported needs to be stored.
Panic buying by consumers in the early stages of the crisis may result in market distortion as durable
goods have been stockpiled leading to reduced demand for the rest of 2020. Increased demand for
durable goods with long shelf-life resulted in a 41% by volume increase in Norwegian exports of
salted/dried cod to Portugal in the first quarter of 2020 compared to the same period 2019. In Spain,
canned fish purchases increased by 80% at the start of lockdown but thereafter only increased by 21%
compared to the same periods in 2019.
There has been a shift of product into processing due to increased demand but this shift has been
mitigated due to workforce issues and social distancing requirements. The effect of this is that
although volume production may have increased, the unit cost of production and transport has also
increased and so, although turnover may increase, profitability may decrease. Confirmation of these
trends will have to await the publication of business results. The increase in processing was due to an
increased consumer demand for frozen and/or prepacked products for home consumption. This
demand in the EU resulted in increased imports of Alaskan Pollack and groundfish from China and a
reliance on frozen imports from outside the EU. These changes meant that movements of fresh and
chilled fish was significantly reduced, with increased demand for frozen, canned and smoked fish.
There appears to have been some variation on the impact of COVID-19 on marine capture fishing
operations. Certain fisheries appear to have been significantly impacted with governments having to
introduce support packages. Inshore fisheries and local fish markets were initially the most impacted.
In Ireland, the price drop for a range of popular species was 50-70% in weeks 19 to 21. Other countries
report minimal impact (Iceland, Denmark & Greenland) or temporary pauses in operations. There have
been delays in opening fisheries. Where fishing operations have resumed, increased supply combined
with limited consumer demand has resulted in market price drops. Continued price instability is likely
until supply and demand balances are re-established.
Compliance Risks
The reduction in enforcement activities such as use of onboard observers, at sea inspections etc, gives
risk to an increased risk of illegal activities at sea such as discarding. Any illegal fishing will result in
sales of black fish into unstable markets may result in increased price instability. One possible
mechanism to dispose of excess fish is to increase direct sales to consumers, thereby bypassing
reporting mechanisms. The immediate compliance response has been the initiation of proactive
outreach programmes in USA, Ireland and the UK (Scotland) to make those involved in this activity
aware of reporting requirements. However, there remains a clear risk of under-and misreporting and
tax evasion.
Supply chain disruption may result in the increased likelihood of mislabelling in prepacked products.
Temporary shortages of specific raw materials may result in a heightened risk of substitution. Pre-
printed labels may not correspond to the actual content of the package.
27Recommendations
COVID-19 government support programmes have, in a number of instances, included deferred
reporting deadlines which means that there is a lack of data available to properly quantify the impact
of the COVID-19 crisis. We therefore propose that a further survey is conducted in early 2021 so that
the full impact of the crisis on the fisheries sector can be determined and to ascertain whether the
detected shifts in value chains were temporary or permanent. If, for example, direct sales to
consumers becomes prevalent then this may require changes to risk assessments and to fisheries
control processes.
28Appendices
Appendix A
Further details on the Irish government Response to the COVID-19 crisis
Details on the tie up scheme can be found here: http://www.bim.ie/schemes/covid-19-temporary-
fleet-tie-up-scheme/
Example of Information Notice for Landings:
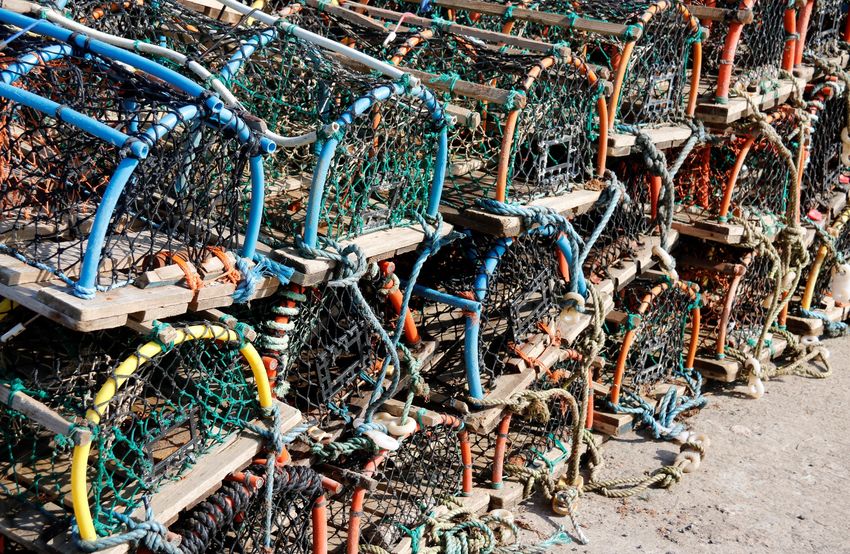
29Appendix B
Examples of ‘pop-up’ style online advertisements, as seen in the USA (Instagram & Facebook
advertisements)
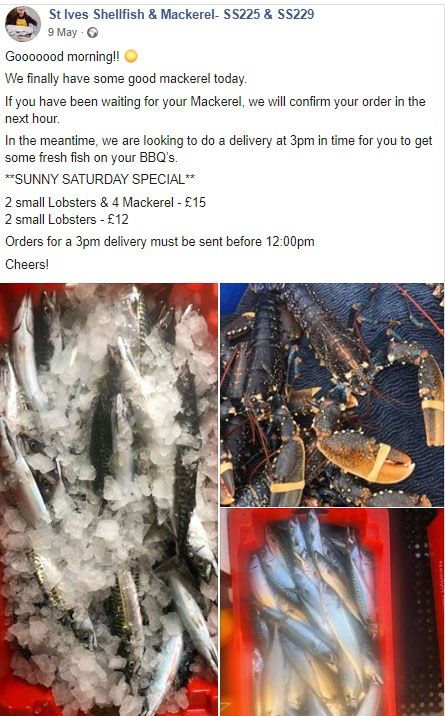
30Appendix C
Examples of ‘pop-up’ style online advertisements, as seen in Cornwall, UK (Facebook advertisements).
These Facebook pages were created April 2020.
31You can also read