Disintegration of Long-period Comet C/2019 Y4 (ATLAS). I. Hubble Space Telescope Observations
←
→
Page content transcription
If your browser does not render page correctly, please read the page content below
The Astronomical Journal, 162:70 (13pp), 2021 August                                                               https://doi.org/10.3847/1538-3881/abfec3
© 2021. The American Astronomical Society. All rights reserved.

 Disintegration of Long-period Comet C/2019 Y4 (ATLAS). I. Hubble Space Telescope
                                   Observations
         Quanzhi Ye (叶泉志)1 , David Jewitt2,3, Man-To Hui (许文韬)4,5 , Qicheng Zhang6 , Jessica Agarwal7 ,
   Michael S. P. Kelley1 , Yoonyoung Kim7 , Jing Li (李京)2, Tim Lister8 , Max Mutchler9 , and Harold A. Weaver10
                                      1
                                     Department of Astronomy, University of Maryland, College Park, MD 20742, USA; qye@umd.edu
                                          2
                                       Department of Earth, Planetary and Space Sciences, UCLA, Los Angeles, CA 90095-1567, USA
                                           3
                                             Department of Physics and Astronomy, UCLA, Los Angeles, CA 90095-1547, USA
              4
                State Key Laboratory of Lunar and Planetary Science, Macau University of Science and Technology, Macau, Peopleʼs Republic of China
                                                 5
                                                   Institute for Astronomy, University of Hawaii, Honolulu, HI 96822, USA
                              6
                                Division of Geological and Planetary Sciences, California Institute of Technology, Pasadena, CA 91125, USA
                      7
                        Institut für Geophysik und extraterrestrische Physik, Technische Universität Braunschweig, 38106 Braunschweig, Germany
                                             8
                                               Las Cumbres Observatory, 6740 Cortona Drive, Suite 102, Goleta, CA 93117, USA
                                                       9
                                                         Space Telescope Science Institute, Baltimore, MD 21218, USA
                                             10
                                                Johns Hopkins University Applied Physics Laboratory, Laurel, MD 20723, USA
                                        Received 2021 March 1; revised 2021 May 4; accepted 2021 May 5; published 2021 July 21

                                                                          Abstract
              The near-Sun comet C/2019 Y4 (ATLAS) is the first member of a long-period comet group observed to
              disintegrate well before perihelion. Here we present our investigation into this disintegration event using images
              obtained in a three-day Hubble Space Telescope campaign. We identify two fragment clusters produced by the
              initial disintegration event, corresponding to fragments C/2019 Y4-A and C/2019 Y4-B identified in ground-
              based data. These two clusters started with similar integrated brightness but exhibit different evolutionary behavior.
              C/2019 Y4-A was much shorter-lived compared to C/2019 Y4-B and showed signs of significant mass loss and
              changes in size distribution throughout the three-day campaign. The cause of the initial fragmentation is
              undetermined by the limited evidence but crudely compatible with either the spin-up disruption of the nucleus or
              runaway sublimation of subsurface supervolatile ices, either of which would lead to the release of a large amount of
              gas as inferred from the significant bluing of the comet observed shortly before its disintegration. Gas can only be
              produced by the sublimation of volatile ices, which must have survived at least one perihelion passage at a
              perihelion distance of q = 0.25 au. We speculate that Comet ATLAS is derived from the ice-rich interior of a
              nonuniform, kilometer-wide progenitor that split during its previous perihelion. This suggests that comets down to
              a few kilometers in diameter can still possess complex, nonuniform interiors that can protect ices against intense
              solar heating.
              Unified Astronomy Thesaurus concepts: Comet nuclei (2160); Comet interiors (272); Comets (280); Long period
              comets (933)

                                    1. Introduction                                program on 2019 December 28 and was immediately noted by M.
   Catastrophic disintegration is a common end state for comets                    Meyer for an orbit that closely resembles another LPC, C/1844
(see Hughes 1990; Chen & Jewitt 1994). While the disintegra-                       Y1 (Great Comet).11 Further investigation by Hui & Ye (2020)
tion of smaller, sub-kilometer-sized comets usually results in                     supports the idea that the two are the products of a larger comet
                                                                                   that likely split during its last perihelion passage ∼5 kyr ago.
the comet turning into a cloud of dust that effectively marks its
                                                                                   The comet pair shares a perihelion distance of q = 0.25 au and
end of life, the disintegration of multi-kilometer-sized comets
                                                                                   an inclination of i = 45°.
can produce multiple active fragments that remain observable                          Comet ATLAS brightened rapidly from 2020 February to
as distinct comets over extended periods. These fragments have                     March, and then faded slowly, despite still being ∼2 months
orbits resembling their progenitor’s orbit and are collectively                    from perihelion. Clear signs of disintegration were first noted in
known as a comet group or comet family.                                            early 2020 April (e.g., Guido et al. 2020; Lin et al. 2020;
   Although comet splitting and disintegration are common,
                                                                                   Venkataramani et al. 2020; Ye & Zhang 2020). Additional
only a handful of comet groups/families have been identified,
                                                                                   follow-up observations showed continued fragmentation into
with most being Jupiter-family comets (Boehnhardt 2004;
                                                                                   2020 May as the comet was moving toward perihelion and into
Fernández 2009). Only two long-period-comet (LPC) families
                                                                                   solar conjunction, and the fragment swarm was still visible in
have been unambiguously identified: the well-known Kreutz
                                                                                   early June as it transited through the Solar Terrestrial Relations
sungrazing comet family, which contains over 4000 known
                                                                                   Observatoryʼs (STEREOʼs) Heliospheric Imager (Knight &
fragments (Marsden 1967, 1989; Sekanina & Chodas 2004;
                                                                                   Battams 2020), a space-based instrument that monitors the sky
Knight et al. 2010; Battams & Knight 2017), and the Liller–
                                                                                   near the Sun.
Tabur–SWAN group that includes at least C/1988 A1 (Liller),
C/1996 Q1 (Tabur), and C/2015 F3 (SWAN; e.g., Sekanina
1997; Sekanina & Kracht 2016).                                                     11
                                                                                     See M. Meyer, https://groups.io/g/comets-ml/topic/69345078; as well as
   Comet C/2019 Y4 (ATLAS) was discovered by the Asteroid                          Minor Planet Electronic Circular 2020-A112, https://minorplanetcenter.net/
Terrestrial-impact Last Alert System (ATLAS; Tonry et al. 2018)                    mpec/K20/K20AB2.html.

                                                                               1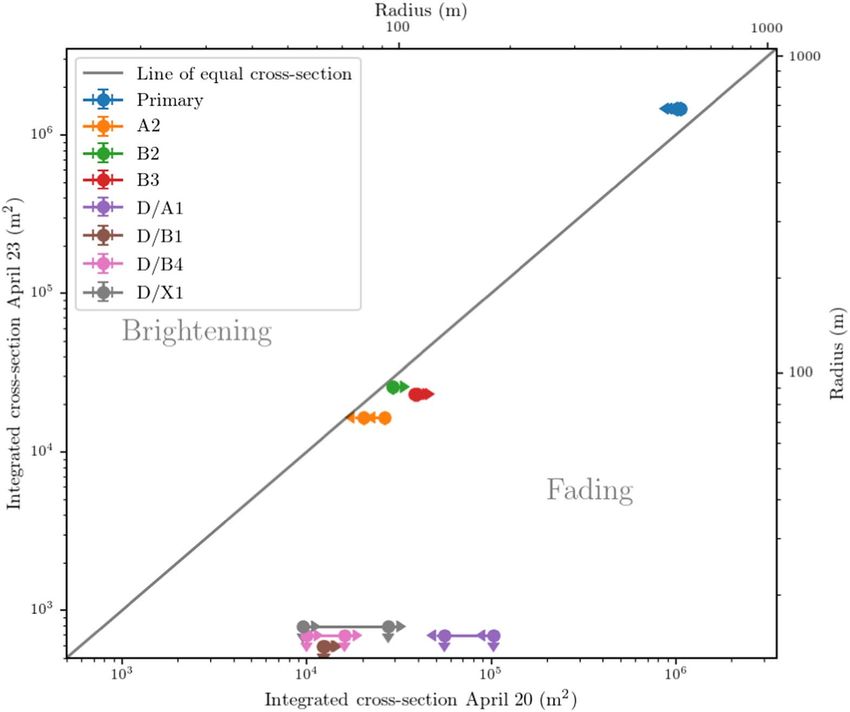
The Astronomical Journal, 162:70 (13pp), 2021 August Ye et al.
Table 1
Summary of the HST Observations
Date and time (UTC) Program ID Filter rH (au) Δ (au) α Exposure
2020 Apr 20 10:14–10:51 16089 F350LP 1.102 0.978 57°. 4 5 × 6.4 minutes
2020 Apr 20 13:31–14:07 16111 F350LP 1.099 0.977 57°. 5 5 × 6.6 minutes
2020 Apr 23 09:48–10:23 16111 F350LP 1.041 0.964 60°. 1 5 × 6.6 minutes
Note. Listed are the date, time, program IDs, filters of the observations, heliocentric distance rH, geocentric distance Δ, phase angle α of the comet, and the exposure
strategy.
Members of comet groups, being products of a disintegrated solution. The error of the updated solution is within 0 02, or
parent, are also prone to disintegrate. For instance, many half of one WFC3 pixel.
Kreutz comets disintegrate shortly before their extreme We then median-combined exposures from the same orbit
perihelion at 0.005 au. Before Comet ATLAS, no fragmented into a composite image using Montage (Jacob et al. 2010),
LPC members have ever been observed to disintegrate well shown in Figure 1. However, we soon realized that the relative
(1 au) before perihelion. This is not surprising given that motion between fragments was so high as to be readily visible
surviving fragments should preferentially contain the most within an orbit. We estimate that relative motions between
resilient constituents that have already experienced intense fragments were up to 0 6 hr−1, or ∼10 pixels in one orbit
heating at perihelion at least once before. It would appear (∼50 minutes of usable time). Mitigation of this effect will be
unlikely that one would disrupt without being exposed to at discussed in the following section.
least a comparable level of heating. The case of Comet ATLAS
is thus particularly interesting, as it is the very first fragmented
3. Analysis
LPC member to disintegrate long before perihelion. Why and
how did it happen, and what sets Comet ATLAS apart from 3.1. Fragment Identification and Measurement
other LPCs?
Using ∼1000 ground-based measurements submitted by
observers worldwide, the Minor Planet Center (MPC) identified
2. Observations four fragments of Comet ATLAS, designated as C/2019 Y4-A
We secured three orbits of the Hubble Space Telescope through D.12 The MPC identification shows that these
(HST) through General Observer programs 16089 and 16111. fragments became separated from the common parent around
Images of Comet ATLAS were obtained using the Wide Field 2020 March 23 (fragment A), March 31 (B), April 6 (C), and
Camera 3 (WFC3) on 2020 April 20 and 23 (Table 1). The first April 9 (D) and were tracked until April 19 (A), May 10 (B),
two orbits were scheduled on 2020 April 20, separated by May 2 (C), and April 17 (D). Figure 2 shows the ephemeris
about three hours; the third orbit was scheduled on 2020 April positions of these fragments, as well as the correspondence for
23. In each orbit we obtained five exposures ranging from 385 fragments A and B. The identification of fragments A and B in
to 397 s. All observations were made with the telescope the images is straightforward and robust, as they are the
tracking at the comet’s telescope-centric motion rate, resulting brightest components in the system and are unambiguously
in trailed and slightly curved background stars. Exposures were close to the ephemeris nominal of the respective fragment.
dithered in order to help minimize the impact of bad pixels and Fragments C and D, on the other hand, do not have a clear
detector gaps. For maximum sensitivity, all exposures were correspondence in the images. Fragment D was last observed
obtained through the ultrabroad F350LP filter, which has a about three days before the HST observation, and its absence
central wavelength at ∼580 nm and an FWHM of ∼490 nm. may simply indicate a complete disruption. The case of
Due to programmatic issues, the comet was positioned on the fragment C is more puzzling, as it was reportedly tracked from
UVIS1 detector in 16,089 exposures and the UVIS2 detector in the ground until early May. Interestingly, if we convolve the
16,111 exposures, causing the 16,111 exposures to cover only HST images to 2″ FWHM, comparable to typical ground
up to ~1¢ tailward of the nucleus, compared to ~2.5 ¢ in the seeing, a blob-like artifact appears near the ephemeris position
16,089 exposures. Nearly all (except one) of the fragments are of fragment C on the April 20 image (Figure 3). We also note
within 1¢ of the nucleus, hence the impact of this programmatic that the true ephemeris error of the nearby bright fragment B
difference is minimal. (∼1″–2″ as estimated from Figure 2) is almost as large as the
Images were cleaned against cosmic rays and hot pixels sky-plane distance between B and C. These observations
using an optimized version of the L.A. Cosmic algorithm support the idea that ground-based fragment C is a data artifact
(van Dokkum 2001; see also C. McCully, https://github.com/ and highlight the importance of angular resolution on highly
cmccully/lacosmicx). Astrometric solutions were recomputed structured targets.
using field stars in order to enable precise astrometry of the The images show that fragments A and B consist of clusters
fragments. The update of the astrometric solution is necessary of fragments moving at distinguishably different directions and
because the released data only includes crude solution speeds. Many of these fragments are embedded in the coma and
computed from the guide stars, which contains errors up to a are too faint and/or too close to each other to be resolved from
few 0 1, or tens of WFC3 pixels. (HSTʼs data pipeline can the ground, adding additional challenges to fragment
compute astrometric solutions using field stars, but this
12
capability does not extend to images with trailed field stars.) See Minor Planet Electronic Circular (MPEC) 2020-H28 (https://
We measure the ends of the star trails, match them to the Gaia minorplanetcenter.net/mpec/K20/K20H28.html). An additional fragment E
was assigned in MPEC 2020-J16 (https://www.minorplanetcenter.net/mpec/
Data Release 2 (Gaia–DR2) catalog (Gaia Collaboration et al. K20/K20J16.html) but was eventually linked to fragment B (MPEC 2020-
2018) using SCAMP (Bertin 2010), and rederive the astrometric K131, https://minorplanetcenter.net/mpec/K20/K20KD1.html).
2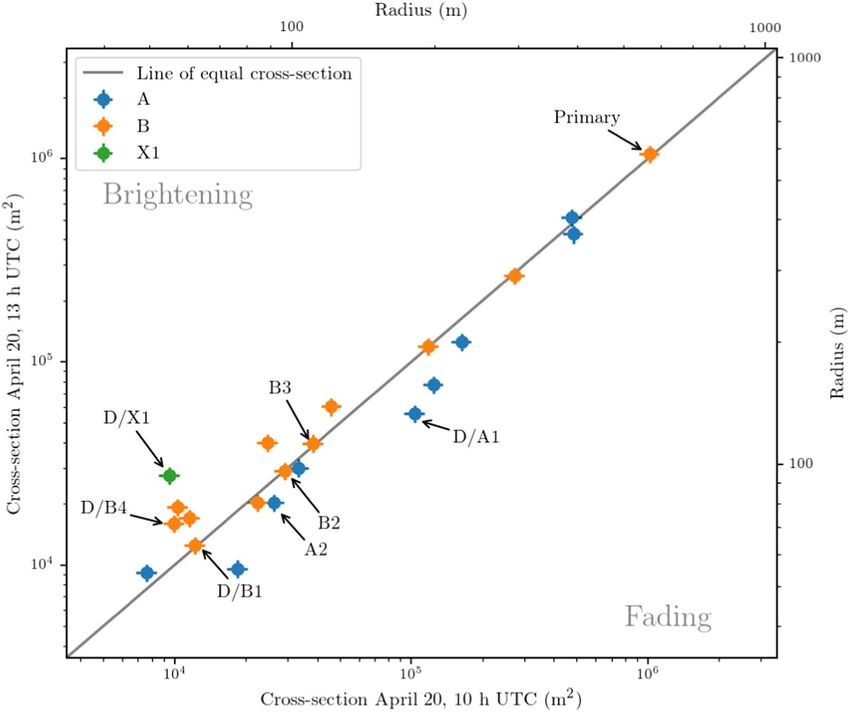
The Astronomical Journal, 162:70 (13pp), 2021 August Ye et al.
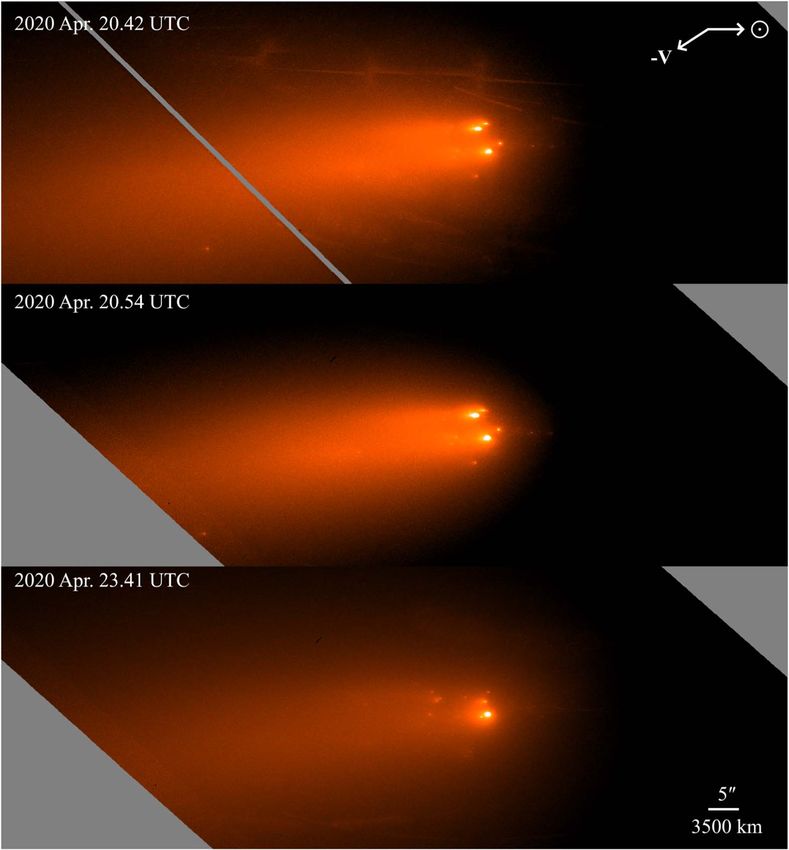
Figure 1. Median-combined HST images from all three orbits. The arrows mark the comet–Sun vector (arrow to e) and negative velocity vector (arrow to −V); the
change of these vectors across the epochs is negligible. The diagonal streak in the upper panel is the chip gap between the two UVIS detectors. Other fainter streaks in
the images are trailed background stars.
identification and tracking. Hence, we take the following steps 3. We used Photutils (Bradley et al. 2020) to extract
to identify and measure the fragments: sources from the composite images. Sources were
extracted using an aperture of 5 pixel radius and an
1. We first blinked the exposures to identify groups of
empirical sigma level of 10σ. To exclude image artifacts,
fragments that move with similar directions and speeds
we inspected the original frames and noted detections that
(i.e., the fragments would not trail after combining all
correspond to prominent sources seen only in one frame,
frames from an orbit). Four groups are identified: clusters
and removed them from the detection list. In this way, we
of fragments A and B, and two isolated fragments toward
identified 23, 23, and 21 sources in the images from each
the tail side. For each fragment group, we median-
orbit.
combined the exposures in each set using the co-motion
of the group, resulting in four composite images per orbit. We then derived the astrometry and photometry of each
Hence, each composite image is “appropriate” for one identified source. The absolute astrometry of each source was
fragment group, as it is generated using the motion rate derived based on the recomputed astrometric solutions
optimized for this group. Identification and measurement described in Section 2. The photometry of each source was
of fragments in a group were only done using the measured using a 1.5 pixel (0 06) radius aperture and was
corresponding image of this group. then corrected for aperture losses, estimated using the
2. We smoothed each composite image using a simple standard point source function (PSF) model generated for
15 × 15 pixel boxcar function then subtracted this from WFC3/F350LP by TinyTim (Krist et al. 2011). This
the original in order to suppress large-scale variations approach minimizes the contamination from the coma and
across the image (Figure 4). We chose an FWHM of nearby sources. The local background estimated using a
15 pixels based on the typical apparent size of the sigma-clipped median within an annulus with an inner and
fragments (estimated to be 5–10 pixels). outer radius of 10 and 20 pixels (0 4 − 0 8). By looking at
3
The Astronomical Journal, 162:70 (13pp), 2021 August                                                                                              Ye et al.

Figure 2. Predicted positions and 3σ uncertainty ellipses of the four published fragments of Comet ATLAS superimposed on the composite HST images. The
predictions are based on the ephemeris derived from JPL orbital solutions #6 (for fragment A) and #7 (for fragments B through D). Arrows mark the ephemeris
ellipse and the corresponding fragments on actual images where applicable (see the discussion in the main text).

Figure 3. The HST images convolved to a 2″ FWHM similar to ground-based data (left column) and the original images (right column) showing the illusion that
fragment C consists of several faint fragments.

the scatter of the points from individual exposures, we                                                3.2. Fragment Tracking
estimated an uncertainty of ∼1 pixel (0 04) for astrometry                         Our next step was to link the sources between the orbits into
and ∼0.1 mag (10%) for photometry.                                               unique tracklets. We first focused on the April 20 image pair

                                                                            4
The Astronomical Journal, 162:70 (13pp), 2021 August Ye et al.
Figure 4. Demonstration of coma removal process: (a) the original, median-combined composite image, (b) the modeled coma generated by smoothing the image
using a 15 × 15 pixel boxcar function, and (c) the subtracted, coma-free image showing the fragments. All panels are scaled using the IRAF z-scale algorithm.
Figure 5. Fragment tracks (vectors) on the first April 20 image. The vectors are enlarged by a factor of 10 for clarity. Note that there are some apparent sources on the
image not marked by vectors (for example, a source just below X1): these are not detected following the procedure outlined in the main text and are likely image
artifacts. The primary component used as a point of reference is marked by a star symbol. Also marked are the approximate boundaries of Complexes A and B (the
fragment clusters corresponding to fragments A and B identified in ground-based data; see the discussion in the main text). X1 and X2 are two isolated fragments with
no apparent association with any MPC-identified fragments.
Figure 6 shows the extrapolated locations of the fragments on
and attempted to identify the same sources detected in the two
the April 23 image as well as the actual detections. Besides the
orbits. Each orbit has 23 sources all successfully linked, as
primary component, which is used as the point of reference, none
shown in Figure 5. Most (21 out of 23) of the fragments were of the sources can be uniquely matched. The simplest explanation
located near MPC-identified fragments A and B. We hereafter is that most of the fragments detected on April 20 have either split
refer to these two clusters as Complex A and Complex B. Two or completely disrupted in the intervening three days. An
additional isolated fragments appear in the tailward direction of alternative scenario is that the fragments are pushed beyond the
the main components, which we label as X1 and X2. These two predicted circle by strong nongravitational acceleration; such
fragments are not associated with any of the MPC-identified acceleration would need to be a ∼ 2s/t2 ≈ 1 × 10⁻⁶ au days−2,
fragments and are too faint (V ∼ 23) to be detected by most comparable to the value observed in disrupting comets (e.g., Hui
ground-based telescopes. et al. 2015), again implying catastrophic disruption.
We then extend these short tracks to the image epoch on April Although no unique identification can be made, we note that
23 to match the sources detected on the latter date. The three pairs of fragments each can be grossly matched to a
extrapolation is based on the sky-plane motion of the fragments prediction circle, while four ex-fragments have apparently
assuming unaccelerated motion relative to the primary (the disappeared, as shown in the bottom panel of Figure 6. Each
brightest component in the system). The change of viewing fragment pair or defunct fragment is labeled by a letter denoting
geometry from April 20 to 23 is minimal (the phase angle, or the complex it belongs to plus a sequence number, such as A1.
Sun–Comet–Earth angle, only increased by 2°. 7) and is therefore (Hereafter we use disappeared and defunct as synonyms.) To ease
ignored. The uncertainty range is derived assuming a measure- our discussion, a prefix of “D/” is added to the defunct fragments.
ment error of 1 pixel as previously estimated in Section 3.1, which
translates to an extrapolation error of 48 pixels (1 92) in radius on 4. Discussion
April 23. The Keplerian shear due to the ejection velocities is
approximately 103 km or 1 5, estimated using the vis–viva 4.1. Fragment Size Distribution
equation taking the relative fragment speed of ∼10 m s−1 (as will The photometry provides a measure of the scattering cross
be shown later in Section 4.2.1). section, Ce, of each component. The scattering cross section is
5The Astronomical Journal, 162:70 (13pp), 2021 August Ye et al.
Figure 6. A cropped version of Figure 5 (panel (a)), compared to the locations of the fragments on the 2020 April 23 image as predicted by a simple extrapolation
based on their on-sky motions and Keplerian divergence (circles, with sizes representing the uncertainty ranges), as well as the actual detections on the image
(diamonds), as in panels (b)–(c). Fragment X2 is outside the image and is not shown. The primary component being used as the point of reference is marked by a star
symbol. Panel (b) is overlaid with the coma-subtracted composite image; the dashed line in the upper panel marks the crude boundary between Complexes A and B.
Panel (c) labels the identified trackable fragment clusters.
dominated by dust and hence provides only an upper limit to Here pλ = 0.04 is the typical geometric albedo of cometary
the sizes of the fragments. The radius of an equal-area circle, re, nuclei (Lamy et al. 2004), f(α) is the Schleicher–Marcus (also
can be calculated by called Halley–Marcus) phase function at phase angle α
re = ⎛ e ⎞
(Schleicher et al. 1998; Marcus 2007), mλ is the measured
⎝p⎠
1 2
C magnitude for the specific band λ, and me,λ = −26.8 is the
, (1 )
apparent brightness of the Sun in F350LP (Willmer 2018).13
Given a ∼±0.1 mag error in the photometry (Section 3.1), the
where the cross section Ce is given by derived Ce are accurate to ±10%, although systematic errors
prH2 D2
Ce = 10-0.4(ml - m , l)
. (2 )
pl (1 au)2 f (a) 13
See also http://mips.as.arizona.edu/~cnaw/sun.html.
6The Astronomical Journal, 162:70 (13pp), 2021 August Ye et al.
Figure 7. Cumulative distributions of the cross section of the fragments at different epochs. The top three panels show the distribution of Complex A, while the bottom
three panels show that of Complex B. The gradients of the power-law indices 1 − g (assuming the differential distribution of the cross section is written as
N (Ce ) µ Ce-g ) are given in each panel for reference. The differential size index s = 2g − 1 for each panel derived by the Clauset et al. (2009) power-law fitting
algorithm is also shown.
(e.g., due to the unknown dust albedo and color) may be distribution, s, can be calculated by s = 2g − 1, where g is
substantially larger. the differential index of the distribution of the cross
The fragment cross-section distribution shown in Figure 7 section that can be expressed as N (Ce ) µ Ce-g . We derive
reveals two interesting results: g by fitting the cumulative distribution of each complex
observed in each orbit using the algorithm described by
1. At re < 50−100 m or V 24–25, the distribution is flat.
Clauset et al. (2009), who provide us with the cumulative
The HST/WFC3 Exposure Time Calculator14 suggests index, 1 − g. Complex A has s ≈ 2.0 ± 0.4 on April 20
that the images should reach a signal-to-noise ratio of 10 and s = 4.4 ± 1.4 on April 23, showing a 1.3σ difference.
(a rather conservative threshold for source detection) for a The size distribution of Complex B remains largely
V = 27.3 (re = 20 m) solar-spectrum object, seemingly constant (s ≈ 2.5 ± 0.5) from April 20 to 23. The size
indicating a paucity of small, faint fragments. However, distribution of Complex A on April 20 and Complex B is
the strong coma can make faint fragments invisible, generally shallower than the numbers measured on other
effectively introducing a bias against smaller fragments. fragmenting comets, such as 73P/Schwassmann–Wach-
A quick examination shows that the coma region in the mann 3 (s = 3.34 ± 0.05; Ishiguro et al. 2009), 332P/
April 20 image has a limiting magnitude of V ≈ 25. The Ikeya–Murakami (s = 3.6 ± 0.6; Jewitt et al. 2016), and
coma had faded considerably by April 23, coinciding the decameter fragments in the Kreutz family (s = 3.2;
with the increasing detections of fainter fragments, Knight et al. 2010), while that of Complex A on April 23
supporting the idea that the absence of small fragments appears steeper (but not statistically significant). In this
is an observational bias. regard, we note that fragment kinematics (to be discussed
2. Complex A appears to be rapidly evolving, although the in Section 4.2.1) also shows that Complex A appears to
interpretation is somewhat undermined by the small be much shorter-lived compared to Complex B, despite
number statistics. The differential index of the size the two having a similar integrated brightness at the
beginning (see Section 4.2.2). This suggests that Com-
14
http://etc.stsci.edu/etc/input/wfc3uvis/imaging plex A is the product of a small, short-lived, and much
7The Astronomical Journal, 162:70 (13pp), 2021 August Ye et al.
Figure 8. Fragment sizes, sky-plane speed,s and the projected distances of the fragments measured from the 2020 April 20 image pair. The speeds and distances are
measured with respect to different points of origin: panel (a) assumes multiple origins of the fragments: the ones in Complex A with respect to the primary in Complex
A, the ones in Complex B with respect to the primary in Complex B, and X1, X2 with respect to Complex A, while panel (b) assumes a single origin for all fragments,
the primary component in Complex B. The primaries are defined as the brightest component in the respective complex. Uncertainties are too small to show on this
plot. Fragment sizes are inferred from the mean brightness (with the change in brightness neglected). Solid, dashed, and dashed–dotted lines are the lapsed times since
ejection assuming unaccelerated fragments.
more active fragment compared to Complex B. The re of of tens of m s−1 is very high compared to separation speeds of
the largest piece in Complex A is ∼500 m. Considering most fragmenting comets (only a few m s−1 or less; see
all the uncertainties, the entire prefragmentation nucleus Sekanina 1982). Although scenario (a) also implies high
of Comet ATLAS is likely not much larger than a few ejection speed, the speeds in scenario (b) are ∼5 times higher
102 m in radius. and require 52 = 25 times more energy to attain, making the
scenario less likely. Additionally, ground observations made a
few days preceding the HST observations revealed fragments
4.2. Size and Dynamical Evolution of the Fragments resembling Complex A, hence the age of Complex A could not
have been younger than a few days. All these evidence favor
4.2.1. Evolution over 3 hr on 2020 April 20
scenario (a), which implies that the members in Complex A
Assuming that the fragments do not accelerate, the time of were tertiary products of the fragmentation.
flight, t, can be derived from t = l/v, where l is the projected However, even with scenario (a), the relative speeds between
distance between the fragments and v is the relative sky-plane fragments are still larger than the typical value observed in
speed. Fragments ejected simultaneously will form a straight many other fragmenting comets, which is puzzling. Scenarios
line on the speed–distance plot. Figure 8 shows the relation that could produce fast fragments include self-propelled
between fragment sizes, relative sky-plane speeds, and acceleration and explosion on the nucleus (Stevenson et al.
distances between the fragments as measured with the 2020 2010). Figure 5 shows that most fragments traveled in the Sun–
April 20 image pair. The impact caused by the change in comet direction, which is consistent with sublimation-driven
observing geometry is negligible over 3 hr. acceleration. The force produced by noncentral sublimation can
The large scatter in the data suggests that the fragments were
be written as
released over a range of times, arguing against an impulsive
origin of the fragments. Regardless of where the fragments
originated, Complex A appears to be very young, with most F ~ k R fs prN2 vth , (3 )
members 3 days in age, suggesting that this part of the system
was evolving rapidly. Complex B and possibly fragment X2 where kR ≈ 0.5 is the dimensionless momentum transfer
appear to be older, with an age of ∼2 weeks. This age is in line coefficient (see Crifo 1987; Attree et al. 2019; Jewitt et al.
with the first reports of the fragmentation, which were made 2020), fs is the specific sublimation rate at the surface, rN is the
2 weeks before the HST observation (Steele et al. 2020; Ye & effective radius of the fragment, and vth ∼ 103 m s−1 is the
Hui 2020), suggesting that these are likely the first-generation typical gas outflow speed. The value of fs was calculated using
fragments produced during the initial fragmentation. the model described by Cowan & A’Hearn (1979),15 in which
The origin-dependent plots provide insights into the we obtain fs ∼ 1 × 10⁻⁴ kg m−2 s−1 assuming H2O as the
fragmentation history of the system: Figure 8(a) assumes all
dominating species. Given that acceleration a = F/m. where m
fragments in A, X1, and X2 were ejected from A and those in B
were ejected from B, whereas Figure 8(b) assumes all
fragments were ejected from B. Scenario (b) reveals an
extremely high ejection speed of ∼30–80 m s−1 and a very 15
A web-based tool can be found at https://pds-smallbodies.astro.umd.edu/
young age of Complex A (less than a day). An ejection speed tools/ma-evap/index.shtml.
8The Astronomical Journal, 162:70 (13pp), 2021 August Ye et al.
Figure 9. Changes of cross-section areas (a proxy of brightness) of Complexes A, B, and X1 between the two orbits on April 20. The diagonal line is the line of equal
cross-section area that separates the “brightening” regime (upper-left corner) and “fading” regime (lower-right corner). We estimate a 10% uncertainty of the data
points following the discussion in Section 3.1. Also labeled are the fragments trackable to April 23 (see Section 3.2).
is the fragment mass, we have disrupting cometary nucleus, that its brightness can fluctuate
greatly due to the rapid release and dissipation of dust and gas.
3k R fs vth
a= , (4 )
4rr N
4.2.2. Three-day Evolution from 2020 April 20 to 23
where ρ = 500 kg m−3 is the assumed bulk density of the
comet. Because the fragments traveled ∼104 km in ∼2 weeks Figure 10 shows the change of cross-section areas (bright-
(estimated from Figure 8), the acceleration would be ness) of the seven traceable fragments from April 20 to 23. In
a = 2s/t2 = 10−5 m s−2, implying a maximum initial fragment addition to the fact that the most strongly fluctuating fragments
diameter of rN = 8 m. (We note that this does not contradict the have all disappeared, the plot also shows a lack of correlation
between fragment survivability and the initial brightness: for
detection limit of re ∼ 50 m established in Section 4.1, as re is
example, D/A1 is the second-brightest fragment in the list but
derived from the dust-contaminated cross section and is only an has disappeared, while some fainter fragments have survived.
upper limit to the sizes of the fragments.) This derived However, as noted above, fragment brightness is not a direct
acceleration is also grossly consistent with the value estimated measure of the physical size of the fragment due to the
in Section 3.2. Such fragment size is possible given the contamination of near-nucleus dust. The actual size of A1
contamination of dust within the photometry aperture. Hence, could be much smaller than B3, but only appear as bright
the self-propulsion of fragments by asymmetric outgassing because it was more actively releasing dust.
forces could explain the observed high speeds of the fragments. Another interesting phenomenon is that the surviving
We will come back to this issue again in Section 4.3. fragments all appear to have split into doubles, as shown in
Figure 9 shows the changes of the cross section of the Figure 6. Split comets will gain more cross-section area, as the
fragments between the two orbits on April 20. The impact of cross-section area decreases more slowly than the volume. If
the change in observing geometry (∼1%) is smaller than the we split a spherical comet with a radius of r into N equal
uncertainty and is therefore negligible. The seven fragments spherical pieces, the total cross-section area obeys ∝ N1/3.
“traceable” to April 23 (including the disappeared ones) show Hence, comet split will increase the total cross-section areas by
an interesting tendency: the three fragments that survived to 26% assuming spherical fragments and ignoring dust contam-
April 23 tend to have near-constant brightness, while the ones ination. However, Figure 10 shows that the total brightness of
that disappear tend to have fluctuating brightness (?10% hr−1) these fragments has instead shrunk by up to 40%, implying
except for D/B1. Further interpretation is limited by the small either a significant loss of material (30%–70% in mass) or a
statistics, but this is in line with the general understanding of a reduced activity after the split.
9The Astronomical Journal, 162:70 (13pp), 2021 August Ye et al.
Figure 10. Changes of cross-section areas (a proxy of brightness) of Complexes A, B and X1 from 2020 April 20 to 23. Arrows along the X-axis indicate the direction
of the change measured on the April 20 data (brightening or fading). The diagonal line is the line of equal cross-section that separates the “brightening” regime (upper-
left corner) and “fading” regime (lower-right corner). The 10% uncertainty of the data points (see Section 3.1) is too small to be shown. The detection limit of the April
23 image is ∼700 m2, but the nondetections (the data points with Y values below 103 m2) are offset slightly for clarity.
Assuming the classic rH-4 law (as implied by Equation (2)), centripetal limit. Following the discussion in Jewitt et al. (2016,
Comet ATLAS as a whole should have brightened by 0.3 mag Section 3), the characteristic timescale for a cometary nucleus
from April 20 to 23, but in reality, it has faded by about to become rotationally excited is
0.2 mag, corresponding to a secular fading rate of ∼0.2 mag/
day. The fading is primarily caused by the fading of Complex rrN2
ts = , (5 )
A, which has faded by 40%. The brightness of Complex B is vth k T fA fs P
largely constant, though this is largely due to the brightening of
the primary component making up for the fading of other where ρ, vth, and rN follow the definitions given above;
fragments (which collectively faded by 50%). This implies that kT ≈ 0.005 is the dimensionless moment arm (Belton et al.
all these fragments except for the primary fragment would 2011); fA is the active fraction of the nucleus; fs is the specific
disappear in a few days, consistent with subsequent ground sublimation rate at the surface; and P is the rotation period of
observations. the nucleus, all in International System of Units where
applicable. The active fraction fA varies greatly among comets,
4.3. Fragmentation Mechanism with a general lower limit of ∼1% (Ye et al. 2016) but can
approach 100% for very active comets (such as the ones in
Cometary fragmentation can be caused by a number of fragmentation). The value of fs is solved using the model
processes, such as tidal stress, rotational instability, explosion described by Cowan & A’Hearn (1979), from which we obtain
due to internal gas pressure, and external impacts (see
fs ∼ 1 × 10⁻⁴ kg m−2 s−1 depending on the mode of the
Boehnhardt 2004). For the case of Comet ATLAS, the orbital
configuration argues against tidal stress as a possible cause, sublimation (subsolar or isothermal) assuming H2O as the
because the comet has q = 0.25 au (well outside the Roche dominating species. Assuming P = 6 hr (see Samarasinha et al.
limit of the Sun) and an inclination i = 45° (which keeps it 2004), Equation (5) can be further simplified to
away from major planets). The dispersion in the fragment time ts » (0.0001 - 0.05) rN2 (days). (6)
of flight (as shown in Figure 8) also argues against an
impulsive origin of the fragmentation. The two remaining For fragments at rN = 50 m, τs = 0.3–100 days. In particular,
possibilities are rotational instability and explosion through a larger fA (as can be expected for a fragmenting nucleus)
intense gas pressure. would result in a smaller τs of around the order of a day, in line
Rotational instability arises from asymmetric outgassing of with the observed lifetime of small fragments. For the primary
the comets, which can cause them to spin up and exceed the fragment (rN = 1000 m), τs ranges from a few months to
10The Astronomical Journal, 162:70 (13pp), 2021 August Ye et al. several decades. Interestingly, our unsuccessful post-perihelion H2O production rate derived by Jorda et al. (2008). Taking a recovery attempts (to be reported in a separate paper) indicate near-peak brightness of V ∼ 2 mag (reported by J. Robinson on that the primary component only survived for another 1–2 1844 December 23) and active surface fraction of >10% months, also consistent with the derived τs. (appropriate for a near-Sun comet), we derive a nucleus Rotational disruption appears to be able to explain the diameter of
The Astronomical Journal, 162:70 (13pp), 2021 August                                                                                                      Ye et al.

                                                                               Table 2
                                          Measured and Derived Properties of C/1999 S4 (LINEAR) and C/2019 Y4 (ATLAS)
Property                                                             C/1999 S4 (LINEAR)                                             C/2019 Y4 (ATLAS)

Orbit class                                                           Dynamically newa                                               Dynamically oldb
q                                                                           0.77 aua                                                      0.25 aub
Pre-disintegration diameter                                              0.2–0.5 kmc,d                                                 A few 0.1 km
First major disruption                                       ∼20 days pre-perihelion, at rH = 0.9 au                       ∼60 days pre-perihelion, at rH = 1.4 au
Complete disintegration                                          rH = 0.7 au (near perihelion)                                 rH = 0.5 au (before perihelion)
s                                                                             3.7d                                                Variable, from 2.0 to 4.4
Polarization mode                                                      High maximume                                                  High maximumg
Disrupted due to tidal stress?                                             Unlikelyh                                                      Unlikelyi
Disrupted due to rotational instability                                        ?                                                           Maybei
Disrupted due to gas pressure?                                              Maybej                                                         Maybei
Disrupted due to external impact?                                          Unlikelyh                                                      Unlikelyh
                                                                    Low CO abundancek,l                                     Bluing shortly before fragmentationm

Notes.
a
  JPL solution #99.
b
  JPL solution #13.
c
  Weaver et al. (2001).
d
  Mäkinen et al. (2001).
e
  Kidger (2002).
f
  Hadamcik & Levasseur-Regourd (2003).
g
  Zubko et al. (2020).
h
  These possibilities are not formally discussed in any published works, but we believe that they are unlikely given the high inclination of the two comets.
i
  This work.
j
  Samarasinha (2001).
k
  Bockelée-Morvan et al. (2001).
l
  Mumma (2001).
m
   Hui & Ye (2020).

that the disintegration of Comet LINEAR was caused by                                        from April 20 to 23. The size distribution of Complex A
internal explosion due to the sublimation of subsurface                                      also changed by 1.3σ during this period, indicative of the
supervolatiles such as CO. They showed that this was                                         rapid evolution of the system, while that of Complex B
theoretically possible even with the extremely low CO                                        stayed largely the same. Fragment kinematics suggested
abundance reported by ultraviolet and mid-infrared observa-                                  that Complex A was only a few days old while Complex
tions (Mumma 2001; Weaver et al. 2001). However, it would                                    B was ∼2 weeks old. We speculate that Complex A was
appear unusual for this mechanism to operate on Comet                                        produced by a small (likely 100 m class) and rapidly
LINEAR while comets with much higher CO abundances do                                        disrupting fragment.
not disrupt like this. Additionally, Mumma (2001) showed that                           3.   The fragments moved at on-sky speeds of ∼10 m s−1,
Comet LINEAR is deficient in other supervolatile species. As                                  much higher than typical fragmenting comets. This could
for Comet ATLAS, no direct CO measurement has been                                           be explained either by self-propelled fragments ejected by
reported as of this writing. The significant bluing observed by                               centripetal disruption or an explosive blow-off due to
Hui & Ye (2020) is in line with a rapid increase in gas
                                                                                             internal gas pressure. The destruction of smaller frag-
production, but broadband photometry does not permit
                                                                                             ments occurred within a timescale of a few days,
distinguishing the contribution of different species, hence no
strong conclusion can be made.                                                               consistent with the spin-up disruption of small cometary
                                                                                             nuclei at such sizes.
                                                                                        4.   The significant bluing of the comet observed shortly
                                5. Summary
                                                                                             before the main fragmentation event (Hui & Ye 2020)
   We presented high-resolution HST observations of disinte-                                 indicates a release of a large amount of gas, which hints at
gration of dynamically old near-Sun comet C/2019 Y4                                          a fast and large-scale sublimation of volatile ices.
(ATLAS) between 2020 April 20 and 23. The data fortuitously                             5.   Comparison with the disintegrated dynamically new
covered a critical event: the demise of one of the two main                                  comet C/1999 S4 (LINEAR) shows that the bulk strength
fragment complexes. Our findings are as follows:                                              of Comet ATLAS is likely to be significantly weaker than
   1. Our observations showed that fragments C/2019 Y4-A                                     Comet LINEAR, contrary to population statistics.
      and C/2019 Y4-B, originally identified as two single                               6.   We speculate that Comet ATLAS was derived from the
      fragments in ground-based data, were actually two                                      ice-rich interior of a nonuniform progenitor that broke
      fragment clusters. Each fragment cluster consists of a                                 apart ∼5 kyr ago. The breakup may have occurred at
      few dozen fragments down to ∼10 m size.                                                rH ? 1.5 au in the outbound leg in order to shield the
   2. Complex A was clearly in the process of a complete                                     interior ice from the intense solar heat at q = 0.25 au. The
      disintegration, while Complex B stayed largely intact,                                 other major fragment produced by the breakup, C/1844
      despite the fact that they had a similar initial brightness.                           Y1, appeared to have survived its perihelion passage and
      Photometry showed that Complex A lost ∼70% mass                                        could represent the “drier” part of the progenitor, though

                                                                                12
The Astronomical Journal, 162:70 (13pp), 2021 August Ye et al.
this explanation is undermined by the limited amount Chen, J., & Jewitt, D. 1994, Icar, 108, 265
of data. Clauset, A., Shalizi, C. R., & Newman, M. E. 2009, SIAMR, 51, 661
Cowan, J. J., & A’Hearn, M. F. 1979, M&P, 21, 155
Crifo, J. F. 1987, A&A, 187, 438
We thank two anonymous referees for their review, as well as Farnham, T. L., Schleicher, D. G., Woodney, L. M., et al. 2001, Sci, 292, 1348
Matthew Knight for helpful discussion and comments. This Fernández, Y. R. 2009, P&SS, 57, 1218
research is based on observations made with the NASA/ESA Gaia Collaboration, Brown, A. G. A., Vallenari, A., et al. 2018, A&A, 616, A1
Hubble Space Telescope obtained from the Space Telescope Guido, E, et al. 2020, CBET 4751 : 20200413 : COMET C/2019 Y4 (ATLAS)
Hadamcik, E., & Levasseur-Regourd, A.-C. 2003, Icar, 166, 188
Science Institute, which is operated by the Association of Hughes, D. W. 1990, QJRAS, 31, 69
Universities for Research in Astronomy, Inc., under NASA Hui, M.-T., & Ye, Q.-Z. 2020, AJ, 160, 91
contract NAS 5-26555. Support for this work was provided by Hui, M.-T., Ye, Q.-Z., Knight, M., Battams, K., & Clark, D. 2015, ApJ,
NASA through grant Nos. HST-GO-16089 and 16111 from the 813, 73
Space Telescope Science Institute. J.A. and Y.K. acknowledge Ishiguro, M., Usui, F., Sarugaku, Y., & Ueno, M. 2009, Icar, 203, 560
Jacob, J. C., Katz, D. S., Berriman, G. B., et al. 2010, Astrophysics Source
funding by the Volkswagen Foundation. J.A.’s contribution was Code Library, ascl:1010.036
made in the context of ERC Starting Grant 757390 CAstRA. Jewitt, D., Kim, Y., Mutchler, M., et al. 2020, ApJL, 896, L39
This research made use of Montage and Photutils. Jewitt, D., Mutchler, M., Weaver, H., et al. 2016, ApJL, 829, L8
Montage is funded by the National Science Foundation under Jorda, L., Crovisier, J., & Green, D. 2008, Asteroids, Comets, Meteors,
1405, 8046
grant No. ACI-1440620 and was previously funded by the Kidger, M. R. 2002, EM&P, 90, 157
National Aeronautics and Space Administration’s Earth Knight, M., & Battams, K. 2020, ATel, 13813, 1
Science Technology Office, Computation Technologies Pro- Knight, M. M., A’Hearn, M. F., Biesecker, D. A., et al. 2010, AJ, 139, 926
ject, under Cooperative Agreement Number NCC5-626 Krist, J. E., Hook, R. N., & Stoehr, F. 2011, Proc. SPIE, 8127, 81270J
Kronk, G. W. 2003, Cometography: A Catalog of Comets, Vol. 2: 1800–1899
between NASA and the California Institute of Technology.
(Cambridge: Cambridge Univ. Press)
Photutils is an Astropy affiliate package for the detection Kuehrt, E., & Keller, H. U. 1994, Icar, 109, 121
and photometry of astronomical sources. Lamy, P. L., Toth, I., Fernandez, Y. R., & Weaver, H. A. 2004, in Comets II,
Facilities: HST(WFC3). ed. M. C. Festou, H. U. Keller, & H. A. Weaver (Tucson, AZ: Univ.
Software: L.A. Cosmic (van Dokkum 2001), Montage Arizona Press), 223
Lin, Z.-Y., Hsia, C.-H., & Ip, W.-H. 2020, ATel, 13629, 1
(Jacob et al. 2010), Photutils (Bradley et al. 2020), SCAMP Mäkinen, J. T. T., Bertaux, J.-L., Combi, M. R., & Quémerais, E. 2001, Sci,
(Bertin 2010), TinyTim (Krist et al. 2011). 292, 1326
Marcus, J. N. 2007, ICQ, 29, 39
ORCID iDs Marsden, B. G. 1967, AJ, 72, 1170
Marsden, B. G. 1989, AJ, 98, 2306
Quanzhi Ye (叶泉志) https://orcid.org/0000-0002-4838-7676 Mumma, M. J., Dello Russo, N., DiSanti, M. A., et al. 2001, Sci, 292, 1334
Man-To Hui (许文韬) https://orcid.org/0000-0001- Samarasinha, N. H. 2001, Icar, 154, 540
Samarasinha, N. H., Mueller, B. E. A., Belton, M. J. S., & Jorda, L. 2004, in
9067-7477 Comets II, 281 ed. M. C. Festou, H. U. Keller, & H. A. Weaver (Tucson,
Qicheng Zhang https://orcid.org/0000-0002-6702-191X AZ: Univ. Arizona Press)
Jessica Agarwal https://orcid.org/0000-0001-6608-1489 Schleicher, D. G., Millis, R. L., & Birch, P. V. 1998, Icar, 132, 397
Michael S. P. Kelley https://orcid.org/0000-0002- Sekanina, Z. 1982, in IAU Coll. 61, Comet Discoveries, Statistics, and
Observational Selection, ed. L. L. Wilkening (Tucson, AZ: Univ. Arizona
6702-7676 Press), 251
Yoonyoung Kim https://orcid.org/0000-0002-4676-2196 Sekanina, Z. 1997, A&A, 318, L5
Tim Lister https://orcid.org/0000-0002-3818-7769 Sekanina, Z. 2007, ApJ, 663, 657
Max Mutchler https://orcid.org/0000-0002-0088-3021 Sekanina, Z., & Chodas, P. W. 2004, ApJ, 607, 620
Harold A. Weaver https://orcid.org/0000-0003-0951-7762 Sekanina, Z., & Kracht, R. 2016, ApJ, 823, 2
Steele, I. A., Smith, R. J., & Marchant, J. 2020, ATel, 13622, 1
Stevenson, R., Kleyna, J., & Jewitt, D. 2010, AJ, 139, 2230
References Tonry, J. L., Denneau, L., Heinze, A. N., et al. 2018, PASP, 130, 064505
van Dokkum, P. G. 2001, PASP, 113, 1420
Attree, N., Jorda, L., Groussin, O., et al. 2019, A&A, 630, A18 Venkataramani, K., Xing, Z., Bonamente, E., & Bodewits, D. 2020, ATel,
Battams, K., & Knight, M. M. 2017, RSPTA, 375, 20160257 13634, 1
Belton, M. J. S., Meech, K. J., Chesley, S., et al. 2011, Icar, 213, 345 Weaver, H. A., Sekanina, Z., Toth, I., et al. 2001, Sci, 292, 1329
Bertin, E. 2010, Astrophysics Source Code Library, ascl:1010.1063 Willmer, C. N. A. 2018, ApJS, 236, 47
Bockelée-Morvan, D., Biver, N., Moreno, R., et al. 2001, Sci, 292, 1339 Ye, Q., & Hui, M.-T. 2020, ATel, 13651, 1
Boehnhardt, H. 2004, in Comets II, ed. M. C. Festou, H. U. Keller, & Ye, Q., & Zhang, Q. 2020, ATel, 13620, 1
H. A. Weaver (Tucson, AZ: Univ. Arizona Press), 301 Ye, Q.-Z., Hui, M.-T., Brown, P. G., et al. 2016, Icar, 264, 48
Bradley, L., Sipőcz, B., Robitaille, T., et al. 2020, astropy/photutils: 1.0.0, Ye, Q.-Z., Hui, M.-T., Kracht, R., & Wiegert, P. A. 2014, ApJ, 796, 83
Zenodo, doi:10.5281/zenodo.4044744 Zubko, E., Zheltobryukhov, M., Chornaya, E., et al. 2020, MNRAS, 497, 1536
13You can also read