Tailoring basemaps for color vision impaired people - AGILE ...
←
→
Page content transcription
If your browser does not render page correctly, please read the page content below
AGILE: GIScience Series, 2, 37, 2021. https://doi.org/10.5194/agile-giss-2-37-2021
Proceedings of the 24th AGILE Conference on Geographic Information Science, 2021.
Editors: Panagiotis Partsinevelos, Phaedon Kyriakidis, and Marinos Kavouras.
This contribution underwent peer review based on a full paper submission.
© Author(s) 2021. This work is distributed under the Creative Commons Attribution 4.0 License.

Tailoring basemaps for color vision impaired people

J. M. Misiukasa, V. van Duijnhovena , R. A. Klöppinga, G. Porras Cantonsa
jennifer.misiukas@gmail.com, vincent@vanduijnhoven.xyz, rick.klopping@outlook.com, gerardporras@gmail.com
a
    Master Geo-Information Science, Wageningen University & Research, Wageningen, The Netherlands

                                                                                  elements such as hatches or specific symbology that
Abstract. Widely used basemaps are not particularly
                                                                                  would make them more readable for color vision
inclusive when it comes to color vision impaired users.
                                                                                  impaired users. On average, 8% of men and 0,5% of
The use of colors, even though perfect for the
                                                                                  women experience a type of color vision impairment
representation of features, does not always account for
                                                                                  (Colblindor, 2010). There are various types of color
color vision impairments. Certain combinations of
                                                                                  vision impairment, which can be divided into three
colors in basemaps are indistinguishable for colorblind
                                                                                  categories namely: Monochromatism (total color
people. With the awareness that those disabilities
                                                                                  blindness in which the vision is reduced to seeing
should be considered when designing a basemap, Esri
                                                                                  black, white, and grey), Dichromatism (blindness for
Nederland and Kadaster instigated the research on the
                                                                                  one color), or Anomalous Trichromatism (a weakness
topic, aiming to create a methodology on how to
                                                                                  for a certain color). Monochromatism can be further
optimize the basemaps for color vision impaired users.
                                                                                  specified into Achromatopsia (rod-monochromatism),
The methodology developed was applied in the
                                                                                  which means that the vision is deeply or entirely
assessment of six basemaps and improvements were
                                                                                  impaired, being decreased to seeing just the intensity of
performed in the two most commonly used basemaps
                                                                                  light emanating from an object. Dichromatism and
in the Netherlands, the Esri World Topographic Map,
                                                                                  Trichromatism can be further divided into blindness or
and the BRT Achtergrondkaart Standaard. Suitable
                                                                                  weakness for either the color red (protanopia and
shades were selected to replace the problematic ones in
                                                                                  protanomaly), green (deuteranopia and deuteranomaly),
the original basemaps, and the target group evaluated
                                                                                  or blue (tritanopia and tritanomaly) (Wong, 2011). The
the improvements through surveys. The results showed
                                                                                  red and green color vision impairments are the most
that the commonly used basemaps are able to well
                                                                                  common, while the blue impairment and the full color
represent the features in a colorblind-friendly way.
                                                                                  blindness are rare. The red and green color vision
However, there is room for improvements in order to
                                                                                  impairments are remarkably similar as can be seen in
achieve more suitable and inclusive basemaps.
                                                                                  the simulation represented in Figure 1. The figure
Keywords: Basemaps, Color vision impairment,                                      shows how a color scheme can be optimized for color
Vector tiles, Topographic maps                                                    vision impaired people.
                                                                                  In collaboration with Esri Nederland and Kadaster,
                                                                                  research was conducted into how to optimize the
1 Introduction
                                                                                  basemaps for color vision impaired people. Based on
Topographic maps are two-dimensional representations                              previous research on the optimization of maps, simply
of natural and artificial features found on the planet                            avoiding certain combinations of colors is not enough
(Kadaster, 2020). Topographic elements help to                                    to create a colorblind-friendly design (Harrower &
identify the main area’s characteristics, so they are                             Brewer, 2013). Currently, there are available tools that
often used as basemaps. The majority of these maps                                support the creation of optimized maps, beside the
however are created with little or no consideration to                            possibility of using specific palettes or increasing the
the color vision impaired users (Hobbins, 2019). A                                contrast between certain features on the map. However,
problem for color vision impaired people is that they                             basemaps depend on a well-developed order for their
see the colors differently. As a result, map features in                          features, and adding a new set of rules for colorblind
basemaps can be harder to distinguish. Basemaps are                               optimization can be somewhat discouraging (Skinner,
purposely muted background maps that are used as a                                2020). The goal was, therefore, to create a
foundation for the information that will be represented.                          methodology that could be applied on basemaps in
Therefore, they do not allow for the use of strategic                             order to optimize them for color vision impairments,

                                                                                                                                      1 of 7
Figure 1. Suggestion for a colorblind-safe palette. The first column indicates the original color, and the next three
  columns indicate simulations for each type of color vision impairment (adapted from (Okabe & Ito, 2002)).

                                                                        The second step of the CSA was to check the
solving the question of How can the accessibility of                    distinguishability of different topographic features. The
basemaps for colorblind people be improved? By                          use of certain colors to represent those features might
optimizing their basemaps, Esri Nederland and                           cause them to become unrecognizable by color
Kadaster can, as geodata providers, make maps more                      impaired users of the basemaps.
accessible to colorblind users.
                                                                        Table 1. Assessment plan developed to evaluate the
                                                                        selected    basemaps        where:      P=protanopia,
2 Methods                                                               D=deuteranopia, T=tritanopia, and A=achromatopsia.

The following methodology was created to optimize
basemaps for color vision impairments.
Current state assessment
The purpose of the current state assessment (CSA) was
to analyze how suitable current basemaps are for color
vision impaired people and where there is room for
improvement. The CSA consisted of two steps which
were applied to a selection of the most common
basemaps     used    in    the Netherlands      (BRT
achtergrondkaart Standaard, BRT achtergrondkaart
Grijs, Esri World Topographic Map, Esri Light Gray
Canvas, Google Maps, and OpenStreetMap).
First, all the colors visibly used in a basemap were
extracted using an eyedropper tool. Next, these colors
                                                                        The information observed with the colorblind simulator
were combined based on color combinations that are
                                                                        was combined into an assessment plan (Table 1). Using
known to be a problem for people with color vision
                                                                        a rating system, points were assigned to the selected
impairments. The literature study provided the
                                                                        features, and that resulted in a final percentage that
following problematic color combinations (Colblindor,
                                                                        indicated how suitable a map currently is for users with
2009): green & red, green & brown, blue & purple,
                                                                        color vision impairments. The rating system classified
green & blue, light green & yellow, red, & yellow,
                                                                        each feature from -2 to 2 indicating suitability (or lack
green & gray, and green & black. At last, using the tool
                                                                        of thereof). The rate of 2 indicates a distinguishable
Color Oracle (Color Oracle, 2018), the different types
                                                                        feature, while a -2 suggests that many features are
of color vision impairments were simulated. This
                                                                        indistinguishable. For the symbology use, a 2 indicates
demonstrated if two colors were conflicting or if the
                                                                        that either the use of dashed lines or texture was made
colors were still distinguishable enough when next to
                                                                        to enhance distinguishability where needed. The
each other.

AGILE: GIScience Series, 2, 37, 2021 | https://doi.org/10.5194/agile-giss-2-37-2021                                        2 of 7
assessment also provided an overview of elements that                   was then used for the second round of improvements
were believed to be challenging for color vision                        which was verified again by the target group (n=19).
impaired people.                                                        The improved basemaps were also checked by non-
                                                                        colorblind people (n=3) to check whether the
Surveys among color vision impaired users
                                                                        improvements on the basemaps were appreciated or if
As described, the method was performed by the authors                   the current basemaps are preferred.
(non-color vision impaired people). Using surveys, the
outcomes of the CSA were verified among a group of                      2.1 Case study
color vision impaired people. Two surveys were
developed in May/June of 2020 and had the                               The depicted method was tested on two basemaps,
participation of 27 color vision impaired users in the                  namely the World Topographic Map by Esri and the
initial survey that included the CSA and preliminary                    BRT Achtergrondkaart Standaard by Kadaster. The
improvements and 19 participants in a survey with the                   basemap by Esri was already available as a vector tile,
second round of improvements.                                           but the vector data map from Kadaster had to be first
                                                                        created from the raw topographic data.
Improvement of the basemaps
                                                                        As a final step, an example map was made where data
Based on the CSA and feedback from the users with                       was overlayed on the optimized basemaps. The overlay
color vision impairments, the basemaps could be                         data was also optimized for color vision impairments to
improved. To make quick style variations on the                         test the color interaction and distinguishability of
basemaps, the vector tile technology was applied (Esri,                 overlay data with the basemaps. This map was also
2015). Color vision impairments for red or green are                    evaluated by the user group in the survey performed
quite similar to each other and often, a single style can               after the second round of improvements.
be made to cover both forms of color vision
impairments. Because a color vision impairment for                      2.2 Software and Data Availability
blue is significantly different from the others, a
different map style is often needed. After some style                   For this research, several software, tools, and services
variations were made, these were checked by a group                     were used. To simulate color vision impairment, the
of color vision impaired people (n=27). The feedback                    freely available tool Color Oracle (Color Oracle, 2018)

Figure 2. Color palettes collected from the assessed basemaps using an eyedropper tool.

Table 2. Current state assessment of basemap features (P=protanopia, D=deuteranopia, T=tritanopia, A=achromatopsia).

AGILE: GIScience Series, 2, 37, 2021 | https://doi.org/10.5194/agile-giss-2-37-2021                                       3 of 7
was used. For the surveys, a combination of Survey123 checked for every type of color vision impairment.
and ArcGIS StoryMaps was used. The vector tiles were Following that, the CSA table was filled in for all six
hosted on ArcGIS Online and, the style variations were basemaps (Table 2) with the information obtained with
made in the online vector tile editor from ArcGIS (Esri, the accessement performed using the colorblind
n.d.), which is available via ArcGIS Online. The vector simulator. Both the grayscale basemaps, the Esri Light
tile version of the Esri World Topographic Map is Gray Canvas and the BRT Achtergrondkaart Grijs,
available by default in the editor, while the raw data for presented high scores as well as the Esri World
the BRT Achtergrondkaart Standaard was hosted on Topographic Map. The other basemaps showed notable
ArcGIS online and could be downloaded. The style room for improvement in multiple areas.
sheet, however, was provided by Kadaster and cannot
A group of color vision impaired people was asked for
be shared.
feedback on the Esri World Topographic Map and
BRT Achtergrondkaart Standaard. The feedback
3 Results revealed that red and green color vision impaired
people had the most trouble distinguishing the features
The created methodology was applied to the selection
on the basemap due to the color and contrast used for
of basemaps. For the CSA, the six most commonly
their representation. This was also because blue color
used basemaps in the Netherlands have been assessed
vision impairment is rare and thus it was
(Fig. 2 and Table 2). Fig 2 shows the different colors
underrepresented in the survey. The respondents
present in each map, from which pairs of colors could
mainly commented on some specific features that were
be created. The distinguishability of each pair has been
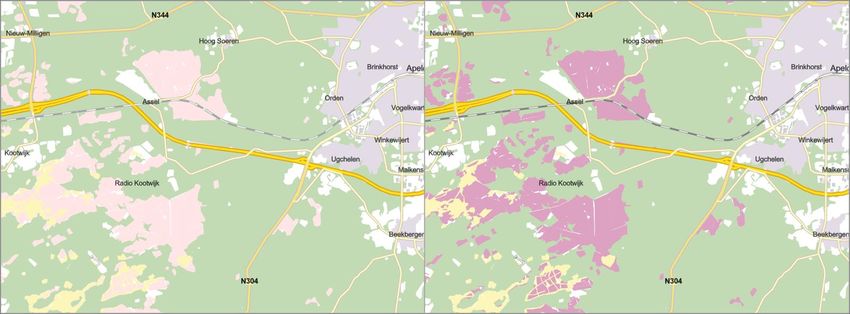
Figure 3. BRT Achtergrondkaart Standaard and improved version made for red, green, and blue color vision impairments.
Figure 3. BRT Achtergrondkaart Standaard and second version of the improvement made for red, green, and blue color
vision impairments.
AGILE: GIScience Series, 2, 37, 2021 | https://doi.org/10.5194/agile-giss-2-37-2021 4 of 7Figure 5. Esri world Topographic Map and improved version made for blue color vision impairment.
Figure 5. Esri world Topographic Map and improved version made for red and green color vision impairments.
not distinguishable from each other. In general, the generalized into one feature to limit the number of
BRT Achtergrondkaart Standaard was a better option colors that had to be used.
for color vision impaired people than the Esri World
Color vision impaired people who participated in the
Topographic Map.
survey responded that the improvements made
Those two basemaps were further improved based on increased the distinguishability of the basemap
the initial feedback and the comments given after the features. However, for some users, the contrast
first round of improvements. This led to the maps as between the different colors was still insufficient.
illustrated in Fig. 3 to 6. For the BRT Achtergrondkaart Generally, the non-colorblind people preferred the
Standaard (Fig 3 and 4), the improvements made for original BRT Achtergrondkaart Standaard but
two different versions were minor and mostly focused appreciated the darker railroads on the improved
on changing the color for heather, forests, railways, and basemap. For the Esri World Topographic Map, the
buildings. This significantly improved the basemaps non-colorblind people preferred the improved basemap
for all three types of color vision impairments. For the over the original.
Esri World Topographic Map, two variations were
created (Fig. 5 and 6), one for the blue type of color 4 Discussion
vision impairment and one for red and green color
vision impairments. In both variations, the adjustments The methods developed to evaluate the use of colors on
focused on changing the color for nature, roads, and the basemaps showed promising results. The evaluation
urban areas. For nature, some features had to be performed using the colorblind simulator offered a
good indication of problematic areas on the basemaps.
AGILE: GIScience Series, 2, 37, 2021 | https://doi.org/10.5194/agile-giss-2-37-2021 5 of 7The findings could be confirmed with the survey 5 Conclusion
performed with color vision impaired people.
However, assessing and editing complex maps with the It can be concluded that research has already been done
eyedropper tool can be challenging due to the on the topic of optimizing the color use for color vision
transparency added to some of the overlapping layers. impaired people. These research though, have not been
extensively applied to basemaps.
The evaluation of the BRT Achtergrondkaart Standard
and the Esri World Topographic Map showed that for The main research question was answered by creating a
both basemaps some features were difficult to be method for improving basemaps for color vision
distinguished due to the similarity of their colors. This impaired people. The method encompassed two main
result shows similarities to a study performed by steps. In the first step, the current basemaps were
(Kvitle, Pedersen, & Nussbaum, 2016) with Norwegian assessed. The use of color was checked, and
maps which indicated that the quality of a map lies in problematic color combinations were identified. The
the ability of the user to extract its features. The color distinguishability of different map features was also
selection needs to be chosen in a way that allows for assessed. The evaluation was finalized by checking the
the correct perception of those features. The perception potentially problematic elements with actual color
of certain elements was a major issue because some of vision impaired people.
the features on the selected basemaps used the same
The next step was improving the basemaps in multiple
lightness of color which leads to a reduction of
iterations where each iteration ended with a survey
contrast. This issue was better represented in the Esri
among color vision impaired people. The responses of
World Topographic Map and could be adjusted by
the survey indicated that the proposed method indeed
offering sufficient contrast between the colors, which
led to significant improvements, even though further
according to (Peterson, 2015) is the solution to avoid
improvements are still required.
problems for color vision impaired people, and can also
be achieved by applying differences in brightness Based on the study, all basemaps could make use of a
among the used colors. more colorblind-friendly version where it is advised the
application the vector tile technology. Further research
The adjustment of colors performed in the BRT
is advised into the effect of the optimized basemaps on
Achtergrondkaart Standard and the Esri World
the interpretation of overlay data. Additionally, the user
Topographic Map corresponds to the conclusions
research needs to be scaled up to create a more
obtained by the work of (Jenny & Vaughn Kelso,
representative group of color vision impaired people.
2007). Their work suggests that colors with strong
contrast should be used to avoid problematic
combinations for color vision impaired people, and this Acknowledgements
corresponds to the approach used in the enhancements
made in both basemaps. This study was an initiative from Esri Nederland (Niels
After the improvements, the participants on the surveys van der Vaart) and Kadaster (Vincent van Altena) as a
offered valuable input of some of the colors chosen for collaboration with the ACT project of the Geo-
certain features and the intensity with which they were Information Science master program at Wageningen
represented. The inputs on the first improvements were University and Research. A StoryMap with more
essential for the follow-up round of enhancements in details of the project can be accessed at Tailoring
both basemaps. For the final optimization of the BRT basemaps for color vision impaired people (arcgis.com)
Achtergrondkaart Standard and the Esri World
Topographic Map, some colors were made darker, and
others were softened in comparison to the initial References
adjustments. The administrative boundaries and the
color of certain buildings were also adjusted on the Esri
Colblindor. (2009, 03 15). Color Blind: Which Are
World Topographic Map to allow better identification
Your Blind Colors? Retrieved 03 20, 2021,
of those features.
from Colblindors: https://www.color-
blindness.com/2009/03/15/color-blind-which-
are-your-blind-colors/
AGILE: GIScience Series, 2, 37, 2021 | https://doi.org/10.5194/agile-giss-2-37-2021 6 of 7Colblindor. (2010). Color blind essentials. Retrieved atlas/mapping/towards-an-accessible-
03 20, 2021, from https://www.color- basemap/
blindness.com/2010/02/23/color-blind-
Wong, B. (2011, 05 27). Points of view: Color
essentials/
blindness. Nature Methods.
Color Oracle. (2018, 05). Color Oracle: Design for the doi:10.1038/nmeth.1618
Color Impaired. (B. Jenny, Editor) Retrieved
03 20, 2021, from https://colororacle.org/
Esri. (2015, 10 27). Vector Basemaps. Retrieved 03 31,
2021, from
https://www.arcgis.com/home/overview
Esri. (n.d.). Vector tile style editor. Retrieved from
https://developers.arcgis.com/vector-tile-style-
editor/
Harrower, M., & Brewer, C. A. (2013, 07 08).
ColorBrewer.org: An Online Tool for
Selecting Colour Schemes for Maps. The
Cartographic Journal, 27-37.
doi:10.1179/000870403235002042
Hobbins, D. (2019). Map Design for the Color Vision
Deficient. In Handbook of the Changing
World Language Map (pp. 1-13). Springer.
doi:https://doi.org/10.1007/978-3-319-73400-
2_46-1
Jenny, B., & Vaughn Kelso, N. (2007, 01). Designing
Maps for the Colour-Vision Impaired. SoC
BULLETIN Vol 41, 9 -12.
doi:10.14714/CP58.270
Kadaster. (2020). Topographic map 1: 10,000.
Retrieved 03 20, 2021, from Kadaster:
https://www.kadaster.nl/producten/kaarten-en-
luchtfoto-s/actueel/topografische-kaarten
Kvitle, A., Pedersen, M., & Nussbaum, P. (2016, 02).
Quality of color coding in maps for color
deficient observers. Electronic Imaging, pp. 1-
8.doi:10.2352/ISSN.2470-
1173.2016.20.COLOR-326
Okabe, M., & Ito, K. (2002, 11 20). How to make
figures and presentations that are friendly to
color blind people. Retrieved from
https://jfly.uni-koeln.de/html/color_blind/
Peterson, G. N. (2015). GIS Cartography A Guide to
Effective Map Design (2nd ed.). Boca Raton:
CRC Press Taylor and Francis Group.
Skinner, A. (2020, 10 22). Towards an Accessible
Basemap. Retrieved from ArcGIS Blog:
https://www.esri.com/arcgis-living-
AGILE: GIScience Series, 2, 37, 2021 | https://doi.org/10.5194/agile-giss-2-37-2021 7 of 7You can also read