Taking stock: an audit of Lancashire's economy in 2021 - Initial findings of the Lancashire Independent Economic Review
←
→
Page content transcription
If your browser does not render page correctly, please read the page content below
www.lancashireier.org

Taking stock: an audit of
Lancashire’s economy in 2021
Initial findings of the Lancashire Independent Economic Review
Taking stock:
An audit of Lancashire’s economy in 2021

Contents

                        3     Foreword from the Chair
                        5     Executive Summary
                        7     Key findings
                        8     The role of the IER as part of a wider strategy for
                              Lancashire
                        9     Navigating this document
                        10    Lancashire: key facts and figures
                        11    How we got here
                        21    Audit 1: People
                        27    Audit 2: Place
                        35    Audit 3: Productivity
                        45    Where next for Lancashire?
                        51    Next steps
                        52    Appendix – Lifecycle methodology

www.lancashireier.org                                                               2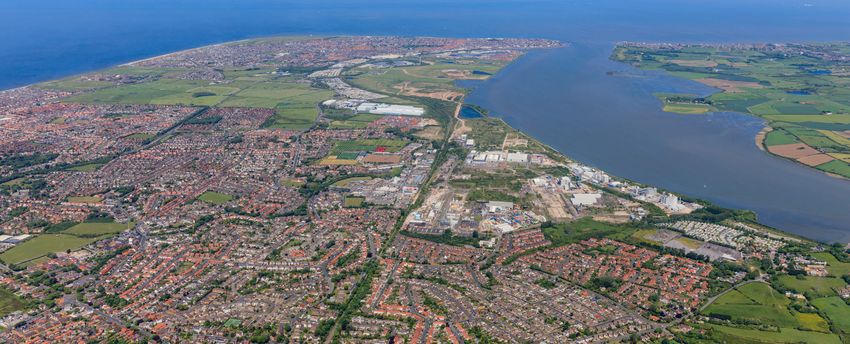
Taking stock:
An audit of Lancashire’s economy in 2021

Foreword from the Chair

           In November 2019, Lancashire partners met and agreed they needed to work together to produce a
           new and ambitious strategy for the Lancashire economy, a strategy which would deliver growth in
           line with the strongest regions of the UK and deliver an exceptional quality of life and well-being for
           citizens in every part of the County.

           This was an important moment for Lancashire. It was also prophetic. In the wake of the COVID-19
           pandemic, and the UK’s departure from the European Union, a powerful and well-evidenced vision for
           Lancashire becomes both an imperative and an opportunity. The decision by Leaders to collaborate,
           to bring together the full richness of Lancashire’s cities, towns, coastal and rural economies in a
           strategy which will tackle economic and health inequalities across the region and deliver long term
           environmental sustainability, is both exciting and ambitious.

           The starting point for the strategy is an agreed and robust analysis of the Lancashire economy.
           We need to understand our current performance against relevant comparators, to analyse the
           trends which are influencing this performance, to examine our strengths and our weaknesses, the
           skills we have and the skills we need for the future, and where the opportunities lie to re-establish
           Lancashire’s position as a key contributor to the UK’s economic growth.

           That is the purpose of this review. It will be objective and based upon the best data we have
           available. We are publishing this first report as an audit of what recent history tells us, with a
           tentative look into the future, and to enrich the dialogue we need to have with stakeholders in the
           debate about Lancashire’s future economy. We are also conducting several deep dive reviews in
           areas which we know will be pivotal to the development of strategy, and these, together with the
           evidence we have gathered from stakeholders and partners, will be the foundations on which the
           Lancashire strategy is built.

           There are two other points which I would stress at this stage. We are living at a time when scientific
           evidence and world opinion are driving with increasing urgency toward an imperative to reduce our
           consumption of carbon to zero. The question for the Lancashire review will be how to develop a
           strategy which not only responds to this imperative – but also seizes the opportunities this creates
           to use our existing assets, in manufacturing, and in our exceptional rural and marine environments.

www.lancashireier.org                                                                                                3
Taking stock:
An audit of Lancashire’s economy in 2021

           Secondly, we must think about our strategy and our choices as players on a national and an
           international stage. We will need to be both outward and inward looking – inward because we will
           be most effective when we are together, and outward because our opportunities and challenges will
           come ultimately from trends and drivers which are global.

           Finally, success will depend entirely on the support and ownership of the people of Lancashire.
           That is why it is so important that we hear from everyone with a stake in Lancashire’s economy.
           Throughout this document we highlight the questions we are still looking to answer – the first is
           at the bottom of this page. I urge you – residents, businesses, charities, public sector bodies – to
           respond to our call for evidence. You can do that at www.lancashireier.org/contribute.

           May I give my thanks to those who have contributed already.

           Following the publication of this report, we will be carrying out targeted research reports into some
           of the key issues arising from our initial analysis. We will bring these findings, together with the
           information from the call for evidence, together into a final report. This will be published in the
           summer, with our recommendations for the next stage of Lancashire’s development. These will
           be directed to those with the power to make a difference, whoever they may be – government,
           institutions, employers, communities.

           While the review is independent, it has been funded by several bodies: Blackpool Council,
           Blackburn with Darwen Borough Council, Lancashire County Council, and the Lancashire Enterprise
           Partnership. I thank them for their support of this review.

           Signed: Rowena Burns
           Chair of the Lancashire Independent Economic Review

                              What are the main strengths and
                              weaknesses of the economy of Lancashire?

www.lancashireier.org                                                                                              4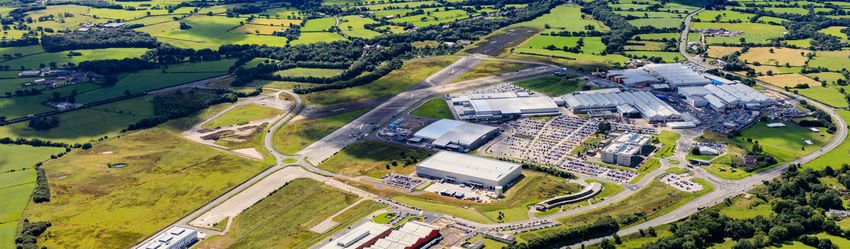
Taking stock:
An audit of Lancashire’s economy in 2021

Executive Summary

           This report sets out the early findings of the Lancashire Independent Economic Review.
           We have chosen to call this report an “audit”, as that is its purpose – to provide an overview of what
           we know about Lancashire’s economy so far.

           It is the start of a conversation. Much as an auditor can only give a high-level overview of the
           financial health of a business based on its accounts, before having detailed meetings with its board
           and employees, so we can only provide a partial picture. The next step is to engage with those
           whose work and lives are intertwined with the economy of Lancashire.

           This report also arrives at a time of great uncertainty, with much more to come. While this research
           is taken forward, authorities in Lancashire are already responding to the urgent challenges thrown
           up by Covid-19, and supporting businesses to adapt and thrive in the post-Brexit context. Authorities
           are also responding to the climate emergency, with the forthcoming work of the Environment
           Commission charting a path towards net zero.

           We begin with a look back to the pre-Covid period, charting the evolution of the economy since the
           2008 financial crisis. The economy recovered sluggishly, with four lost years of output. However, in
           the last five years of data this changed, with an accelerating pace of growth. The manufacturing and
           retail sectors have been in the driving seat here. It will be vital that the current crisis does not cause
           irreparable damage to the Lancashire economy, that might set back this progress.

           Then we look back over the last year. Lancashire has been hit harder than most parts of the UK.
           Meanwhile, we know that the Brexit settlement will have significant impacts on different places in
           the county – but don’t yet have the data to pronounce comprehensively what that will be.

           We then carry out three audits of where things currently stand – starting with the people of
           Lancashire. There are various challenges around poverty, education, skills, deprivation, and health
           and wellbeing. We also know that there are some opportunities – the high performing higher
           education in the region for example. When we get into the detailed analysis, it suggests that poor
           health was the major challenge facing residents pre-Covid – and has only become more important
           since then.

www.lancashireier.org                                                                                                   5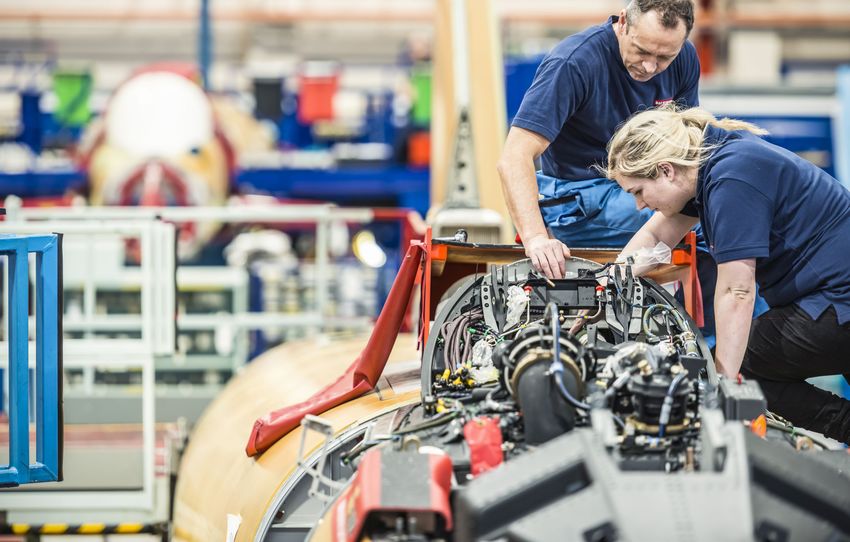
Taking stock:
An audit of Lancashire’s economy in 2021

               The second audit looks at place. The population largely lies along an East-West axis stretching
               from Blackpool to Colne. We start to explore how Lancashire’s people relates to the place – the
               “economic geography” of Lancashire. Certain patterns arise, such as economic centres, like Preston
               that have not achieved significant agglomeration like Greater Manchester has benefited from and
               limited links to Yorkshire.1

               Our third audit focuses on productivity. Productivity matters, because the previous Northern
               Powerhouse Independent Economic Review makes the case that, in the long run, we need increase
               productivity to improve living standards. The Productivity Institute at the University of Manchester
               have supported us in this part of the Review.

               They find that in-work productivity is the main contributor to the overall productivity gap, though
               other factors such as sector mix and labour market participation have an impact. We also note that
               infrastructure provision, which supports productivity, is uneven across Lancashire, and a number
               of its rural areas particularly suffer from economic and social isolation. Levels of Research and
               Development are too low in Lancashire, though there are some very positive initiatives which must
               be strengthened.

               Finally, we look beyond the present to the future. Forecasts show that, in the absence of
               intervention, Lancashire’s productivity gap with Great Britain which has narrowed in the last few
               years is likely to widen again. There is a real risk that, as in 2008, Lancashire will recover more
               slowly from the Covid-19 crisis than the country as a whole. Bold and ambitious action is needed to
               avert this situation. The final report will set out what this action needs to be.

1
    However, the data we have to rely upon is out of date and not granular enough – so extra research has been commissioned using mobile phone data.

www.lancashireier.org                                                                                                                                  6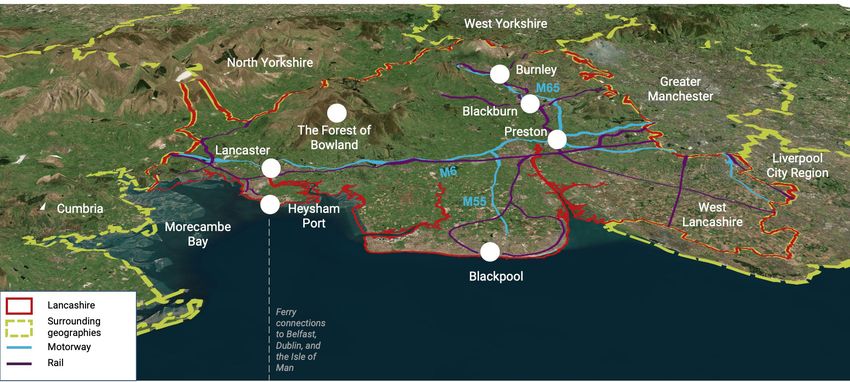
Taking stock:
An audit of Lancashire’s economy in 2021

           Key findings
           These are the findings of work so far – as the Review progresses these may change,
           be refined, and added to.

                                 1. Lancashire’s recovery from the financial crisis was slow, and variable across
                                    places, but in recent years was picking up pace, closing the productivity gap
                                    with the UK average. Manufacturing has grown consistently since 2009 and
                                    jobs have been growing steadily.

                                 2. Lancashire has been more affected by Covid-19 than most of the UK,
                                    in terms of both health and economic impacts.

                                 3. The wide variance in sectoral make up means that the impacts of Brexit
                                    will be felt very differently across Lancashire.

                                 4. Health, education and skills, poverty, and deprivation are all major issues
                                    in Lancashire. To transform the economy, investment in social
                                    infrastructure is as important as physical infrastructure.

                                 5. Poor health outcomes are weighing on economic output and local
                                    government capacity. In the wake of Covid-19, this need merits further
                                    analysis.

                                 6. Lancashire’s physical geography has meant that transport infrastructure
                                    has become more aligned with the North-South axis, but the population
                                    generally lives on an East-West axis.

                                 7. This is one of the most diverse regions in the country. There is no one
                                    urban core but rather a polycentric set of towns and cities, agricultural land,
                                    natural capital, industrial zones and coastal areas. Climate change presents
                                    a real threat which needs to be responded to.

                                 8. If output per head matched the English average Lancashire would
                                    contribute almost £10bn more in economic output to the national economy.

                                 9. Low in-work productivity is the biggest single contributor to Lancashire’s
                                    productivity gap. It is more significant than age structure, employment rate,
                                    or sectoral structure combined.

                                 10. For the growing collaboration between the HE, FE, and business in
                                     Lancashire to be nurtured requires active support from Central Government.

                                 11. If Lancashire wants to avoid a decline scenario it needs to continue to
                                     enhance both productivity and employment in its manufacturing sector,
                                     while transforming it to spearhead net zero efforts.

                                 12. Lancashire lacks a well developed knowledge intensive services base.
                                     A targeted focus on one or two subsectors is likely to work best.

www.lancashireier.org                                                                                                 7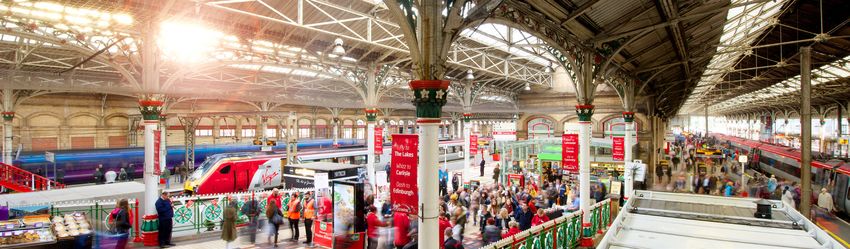
Taking stock:
An audit of Lancashire’s economy in 2021

The role of the IER as part of a
wider strategy for Lancashire
                  The IER is one of three key strategic pieces of work to inform the Greater Lancashire Plan.
                  It sits alongside the Environment Commission and Public Service Reform workstreams. All three
                  workstreams build on the “Redefining Lancashire” recovery plan produced in the Summer, where
                  work is ongoing, for example in sector recovery plans and the forthcoming infrastructure plan.

                  There are major links to be made across the pieces of work. We include some examples in the
                  image below. In particular, the crossover between the IER and the Environment Commission is
                  a major opportunity – to “go big” by investing in clean technologies and investing in the types
                  of programmes that can cut carbon, generate jobs, and improve social wellbeing. This is the type
                  of distinctive programme which can enable Lancashire to meet the twin goals of zero carbon
                  and “levelling up”.

                  There are also links to be drawn between each of the deep dive reports that are going to feed
                  into the final report. An understanding of economic geography will shape how we think about the
                  infrastructure needs of Lancashire. Plans to improve the health, wealth, and wellbeing of residents
                  should drive the next stage of Lancashire’s towns development. Key sectors such as advanced
                  manufacturing have the ability to spearhead environmental and trade goals – while themselves
                  shaping the geography of Lancashire day-to-day.

Figure 1. Strategic landscape in Lancashire, showing links between pieces of research

                  Deep Dives                                                                       Redefining Lancashire recovery plan
                                                                                                                          (Published June 2020)

                Economic Geography and future of towns                                                          Economic goals and data shape the way
                                                                                                                       services are delivered
         3
                                      Health, Wealth and Wellbeing
                                                                               Independent Economic Review

     2
                                                                                                                                 Environment Commission

                                                                                                                                                                              Public Service Reform

1                                            Advanced Manufacturing
                                                                                                                CleanTech,                                   CleanTech,
     4                                                                                                       housing retrofit                             housing retrofit
                                                                                                                 and other                                    and other
                                                    Internationalisation                                      initiatives give
                                                                                                             scope for using
                                                                                                                                                           initiatives give
                                                                                                                                                          scope for using
                                                                                                              environmental                                environmental
                                                                                                                 goals for                                    goals for
                                                                                                                 economic                                     economic
                                                              Infrastructure                                    opportunity                                  opportunity

                LEP strategic work on economy and sectors

Linkages
1
     Economic geography shapes infrastructure, and vice versa
2    Spatial clusters of innovation
3    Nature of towns and health of residents interconnected                                                     Greater Lancashire Plan
4
     Key sectors shape export propositions

    www.lancashireier.org                                                                                                                                                                             8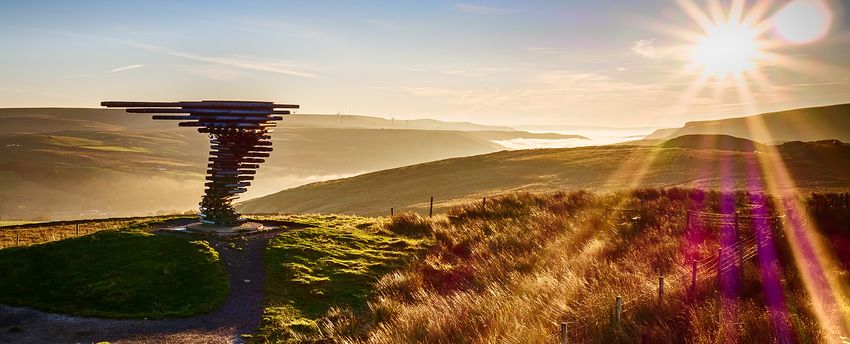
Taking stock:
An audit of Lancashire’s economy in 2021

Navigating this document

                          This icon indicates a question   At points in this report it may be helpful to refer
                          which is being asked in the      to the administrative geography of Lancashire,
                          Call for Evidence                as a lot of data is produced at this level.

                                                           The map on the left shows lower-tier local
                          This icon indicates where a      authority districts and unitaries.
                          targeted research report will
                          go into more detail              The map on the right shows the upper-tier local
                                                           authority (Lancashire County Council) and the
                          This icon indicates a key        two unitaries – Blackpool, and Blackburn with
                          finding from the Review          Darwen.

Figure 2. Administrative geography of Lancashire

         Lower-tier and unitary authorities                           Upper-tier and unitary authorities

www.lancashireier.org                                                                                            9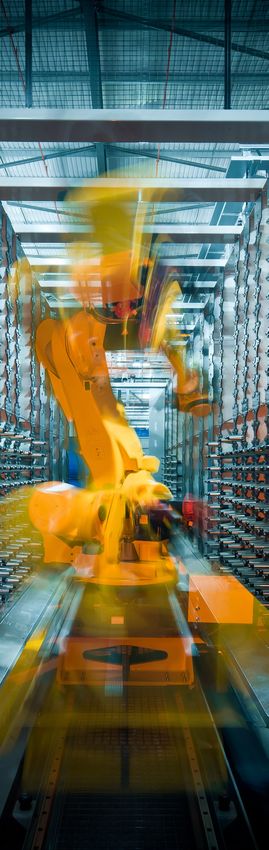
Taking stock:
An audit of Lancashire’s economy in 2021

Lancashire: key facts and figures

                                   1.5m population

                         £34.1bn                                                               668,000
                         economy                                                               jobs

 53k      53,000
        businesses
                                                     4 13
                                                   Four higher
                                                    education
                                                   institutions
                                                                                              Thirteen FE
                                                                                               colleges

     2
    2nd biggest
  concentration of
  Grade 1 farmland
     in England
                                       173km
                                      coastline
                                                                                             World’s
                                                                                             fourth largest
                                                                                             aerospace
                                                                                             cluster

                             19,600 unemployed

Source: Various, including ONS population estimates, ONS Regional Accounts, ONS Business Register and Employment Survey, ONS
Annual Population Survey, DEFRA

www.lancashireier.org                                                                                                          10
Taking stock:
An audit of Lancashire’s economy in 2021
How we got here
A recent economic history of Lancashire
This report is published in March 2021, a year since the first UK lockdown
due to Covid-19 began. The pandemic has had a seismic impact on the
Lancashire’s economy. To understand, then, how we got to where we are
today we firstly need to look back to pre-Covid outcomes. While the official
economic data for Lancashire is still awaited, we can use some less
conventional sources to understand how the Covid-19 pandemic and the
new Brexit deal have affected Lancashire.
The Lancashire economy pre-Covid: A slow but accelerating
recovery from the financial crisis
The narrative of the UK economy since 2008 is well-rehearsed. Output dropped sharply, but only for
a relatively short period; unemployment rose, but not by as much as in other recessions, and strong
job creation following the crash led to record low levels of unemployment; but productivity growth
stagnated with correspondingly weak increases in wages.
Lancashire, however, has a different story to tell.
We have tracked the progress of Lancashire’s economy since 2008, expressing its output and
hours worked (a proxy for employment, that better captures productivity). We set these both to
100 in 2008. The chart also allows us to understand what’s happening with productivity – the
green segment of the graph indicates a productivity improvement, the yellow segment a decline in
productivity. Finally, we add the 2018 positions of the other major economies in the North West,
and the UK as a whole.2
2
For more on the method, see:
https://www.metrodynamics.co.uk/blog/2020/4/29/a-shock-to-the-system-nine-lessons-for-today-from-the-aftermath-of-the-financial-crisis
www.lancashireier.org 11Taking stock:
An audit of Lancashire’s economy in 2021
Figure 3. Lancashire’s economic journey since 2008
How have local economies fared since 2008?
2018
Region
North West Fewer hours Higher output, hours
United Kingdom worked than in worked, and productivity
130
2008 than in 2008
120 Cheshire
Real GVA Output (2008 = 100)
United Kingdom
Greater Manchester
Lancashire
110
Merseyside
Cumbria Higher output and hours
worked than in 2008, but
lower productivity
100
Lower output
than in 2008
90
Fewer hours worked
and lower output
than in 2008
90 100 110 120 130
Hours worked (2008 = 100)
Source: Metro Dynamics analysis of ONS regional output data, NUTS2 geographies
2008 2009 2010 2011 2012 2013 2014 2015 2016 2017 2018
Firstly, the impact of the recession on Lancashire was long-lasting. By 2012, Lancashire was almost
exactly where it was in 2008, with four “lost years” of economic growth (compared to three for
the UK as a whole). After this, output has consistently grown – particularly strongly between 2014
and 2016. This growth outpaced the growth of hours worked, and as a result overall productivity
increased dramatically between 2014 and 2018. By 2018, Lancashire had grown its productivity
by more than anywhere else in the North West, and had closed the productivity gap with the
UK significantly, with higher than UK levels of productivity in aerospace and pharmaceuticals in
particular.
To understand what is behind this, Figure 4 presents output (GVA) by the seven largest broad
industrial groups in Lancashire between 2008 and 2018 – between them these account for over 70%
of economic activity across the period.
www.lancashireier.org 12Taking stock:
An audit of Lancashire’s economy in 2021
Figure 4. GVA output by seven largest broad industrial groups, 2008 – 2018
7
6
5
GVA (£bn) in 2016 £
4
3
2
1
0
2008 2009 2010 2011 2012 2013 2014 2015 2016 2017 2018
Manufacturing Construction Wholesale and retail
Real estate Public administration and defence Education
Human health and social work activities
Source: ONS Regional Accounts
Manufacturing has consistently been the largest sector by output. This should caution against the
assumption that, because manufacturing has declined in scale over the longer term that it cannot
play a significant role in Lancashire’s economy – quite the opposite. It was heavily impacted by
the recession, but has grown consistently since 2009, particularly during the middle of the decade.
Real estate has gradually declined in value, and been overtaken by wholesale and retail, another
sector that has grown very strongly over recent years – but one which we know has been especially
affected by Covid-19 (see Figure 5 below). Health and Social Work and Education have both
remained fairly constant, but public administration and defence 3 has seen a clear decline, in line
with austerity policies. Finally, construction has fluctuated over the period, but a general upward
trajectory had been seen since 2013.
If we look at how these sectors looked across Lancashire pre-Covid (2018), we can pick out some
key differences between districts. Manufacturing is particularly prominent in Pendle, where Rolls
Royce has a large base at Barnoldswick, and features highly for South Ribble, Blackburn with
Darwen, Burnley and Ribble Valley. Retail and Wholesale was a particularly large sector in Preston,
but is important everywhere. Construction activity was very largely concentrated in South Ribble.
3
Note: by defence is meant direct activity by the public sector, rather than businesses that supply the defence sector, such as BAE – which would be
classified as manufacturing
www.lancashireier.org 13Taking stock:
An audit of Lancashire’s economy in 2021
Figure 5. GVA Output by sector, and district in Lancashire. 2018
5
£4.5bn
4.5
4
£3.7bn
3.5
£3.2bn
3
£2.8bn
Gross Value Added (£bn)
£2.8bn
£2.5bn
2.5
£2.3bn
£2.3bn
£2.1bn £2.1bn
2
£1.6bn £1.6bn
£1.5bn
1.5
£1.1bn
1
0.5
0
Preston South Ribble Blackburn with Blackpool Lancaster West Burnley Pendle Fylde Chorley Wyre Ribble Valley Hyndburn Rossendale
Darwen Lancashire
Wholesale and retail Transportation and storage Real estate
Public administration and defence Professional, scientific and technical activities Primary and Utilities
Manufacturing Information and communication Human health and social work activities
Financial and insurance Education Construction
Arts, entertainment, recreation and other services Administrative and support service activities Accommodation and hospitality
Source: ONS Regional Accounts data
We can also look at employment within sectors. Here we show the nine largest sectors, which
employed around 84% of the workforce over the period. The picture is less clear, but retail
employment has clearly grown, and after an initial drop, employment in manufacturing has steadily
grown back.
www.lancashireier.org 14Taking stock:
An audit of Lancashire’s economy in 2021
Figure 6. Employment in nine largest employing sectors, 2009 – 2019
140,000
120,000
100,000
80,000
60,000
40,000
20,000
0
2009 2010 2011 2012 2013 2014 2015 2016 2017 2018 2019
Manufacturing Construction Wholesale and retail
Accommodation and food service Professional, scientific and technical Administrative and support service
Public administration and defence Education Human health and social work activities
Source: ONS Business Register and Employment Survey
Key finding 1 : Lancashire’s recovery from the financial crisis was slow, and
variable across places, but in recent years was picking up pace, closing the
productivity gap with the UK average. Manufacturing has grown consistently
since 2009 and jobs have been growing steadily.
In keeping with the growth of retail, we also find that in 2019, “Sales Assistants and Retail
Cashiers” was the most common occupation in Lancashire. Indeed many of the main roles are in
the “foundational economy”, such as childcare, cleaning, and road transport. These roles are less
amenable to productivity improvement, as technological development is less applicable. They do,
however, play a vital role in society – one that has come increasingly into focus over the last year –
and are rightly a focus for this economic review.
www.lancashireier.org 15Taking stock:
An audit of Lancashire’s economy in 2021
Figure 7. Top ten most common occupations in Lancashire
Secretarial and Related Occupations
Elementary Cleaning Occupations
Sales, Marketing and Related Associate Professionals
Other Elementary Services Occupations
Functional Managers and Directors
Childcare and Related Personal Services
Road Transport Drivers
Teaching and Educational Professionals
Caring Personal Services
Sales Assistants and Retail Cashiers
- 5,000 10,000 15,000 20,000 25,000 30,000 35,000 40,000 45,000
Source: ONS Business Register and Employment Survey
The Lancashire economy over the last year: Covid-19 and
Brexit
The last year has been hard – even traumatic – for many communities and businesses in
Lancashire.
While the pandemic has impacted all parts of the UK, it has not done so equally. At the end of June
2020, almost 200,000 jobs in Lancashire were furloughed, with some districts ranking among the
highest take-up of the scheme. And if we rank all of England’s local authorities by death rate, four of
Lancashire’s district are in the top 5% – Fylde, Wyre, Burnley, and Blackpool (in that order).
All but one of Lancashire’s districts (South Ribble) have seen death rates above the national
average.4
The economic impact of Covid-19 has also been severe. We do not yet know the precise hit to
economic output or jobs – and in the case of the jobs we cannot yet know how many of the 94,500
people currently on furlough in Lancashire5 will have viable jobs to return to when the scheme ends.
But we can look at two useful sources: mobility data provided by Google, and information about
when restrictions on economic life were in place. These are combined into one chart in Figure 8.
4
Data as at February 18th, 2021
5
Provisional figure for January 31st. Source: ONS Coronavirus Job Retention Scheme statistics: February 2021
www.lancashireier.org 16Taking stock:
An audit of Lancashire’s economy in 2021
Figure 8. Amounts of time spent in different types of space,
for the year March 2020 to Feb 2021, and restrictions in Lancashire
Mar-20 Apr-20 May-20 Jun-20 Jul-20 Aug-20 Sep-20 Oct-20 Nov-20 Dec-20 Jan-21 Feb-21
40% 1
Nationallockdown
Tier 3
Tier 4
lockdown
Lockdown easing
“Light touch”
Local restrictions
Tier 3
National lockdown
National lockdown
0.9
20% National
0.8
Time spent, relative to baseline
0% 0.7
0.6
-20%
0.5
-40%
0.4
0.3
-60%
0.2
-80%
0.1
-100% 0
Retail and recreation Essential retail Public transport Workplaces
Source: Metro Dynamics analysis of Google Community Mobility Data, Gov.uk, and local media. A seven-day average is used for each
space class in order to eliminate weekly fluctuation. Note data is for Lancashire County Council area, as it has not been possible to
aggregate this data with Blackpool and Blackburn with Darwen data
One immediate point to note is that Lancashire has been under some form of restrictions for
the entire year, and in particular the period of “light touch” restrictions (where almost everything
was open and the “rule of six” was in force) was extremely brief – four weeks in total. After this,
local lockdowns began in various areas of Lancashire. With the introduction of the tier system,
Lancashire was almost immediately placed in the highest tier (tier 3) and was briefly in the new tier
4 before another national lockdown started.
We can see how much of an impact these restrictions, and concerns about the virus, have had on
movement. Non-essential retail usage (including restaurants and pubs) plummeted and took a
long-time to recover – briefly returning to baseline levels at the end of the Summer holidays before
dropping back again. Given the economic importance of retail and wholesale noted above, this
has been particularly impactful. Essential retail (grocery and pharmacy) has remained significantly
below baseline all year – with the exception of panic-buying in March 2020 and a pre-Christmas
uplift. At the end of February of this year time spent in workplaces was down by over a third, and
public transport usage by over a half.
www.lancashireier.org 17Taking stock:
An audit of Lancashire’s economy in 2021
We also know from national research that economic impacts have particularly affected women.
The ONS note that: “Women were more likely to be furloughed, and to spend significantly less time
working from home, and more time on unpaid household work and childcare.”6 This suggests that
the pandemic is reversing gains in gender equality in the workplace.
We are not making a judgement on restrictions per se. But clearly, the impact on economic activity
and people’s lives has been huge.
Key finding 2: Lancashire has been more affected by Covid-19 than most
of the UK, in terms of both health and economic impacts.
The second major development in the last year has been the new settlement with the European
Union. Whilst the long-term impacts – both positive and negative – are as yet unknown, initial trade
frictions have impacted local firms. There have been some reports of confusion among Lancashire
businesses around exporting to Northern Ireland, where there are direct links via Heysham port. In
general, Lancashire is slightly less exposed to trade fluctuations than average – exports account for
27.4% of output (GVA), compared to 30.7% across the whole of England.7
However, those exports will be concentrated in specific sectors, especially manufacturing of
complex products (such as aeroplanes) where supply chains are long and often rely on ‘just-in-time’
delivery.
At the end of 2020 manufacturers had significantly increased exports from the slump earlier in
the year – we do not yet have the data from the start of 2021 to understand whether this has been
sustained. The service sector is still below pre-2020 levels.
6
https://www.ons.gov.uk/peoplepopulationandcommunity/healthandsocialcare/conditionsanddiseases/articles/
coronaviruscovid19andthedifferenteffectsonmenandwomenintheukmarch2020tofebruary2021/2021-03-10
7
Source: ONS Regional trade in goods statistics disaggregated by smaller geographical areas
www.lancashireier.org 18Taking stock:
An audit of Lancashire’s economy in 2021
Figure 9. Net balance of exports quarter on quarter for firms in
Lancashire’s manufacturing and services sector
60
40
20
0
Net Balance %
-20
-40
-60
-80
Q4 1 5 Q1 1 6 Q2 1 6 Q3 1 6 Q4 1 6 Q1 1 7 Q2 1 7 Q3 1 7 Q4 1 7 Q1 1 8 Q2 1 8 Q3 1 8 Q4 1 8 Q1 1 9 Q2 1 9 Q3 1 9 Q4 1 9 Q1 2 0 Q2 2 0 Q3 2 0 Q4 2 0
Manufacturing Sector Service Sector
Source: Lancashire Chambers of Commerce
Previous analysis from the Bank of England identified sectors where jobs were most likely to be
vulnerable to Brexit: food & agriculture, chemicals & pharmaceuticals, cars & transport goods,
transport services (logistics) and construction & real estate.8
These sectors are deemed at highest risk of changes in regulation, trade and labour movements.
If we look across Lancashire we can see the size of these sectors is variable. In South Ribble and
Ribble Valley, there is twice the concentration as is found in England. Blackpool on the other hand
has a significantly smaller proportion of these sectors. Continued developments between the UK
and the EU mean the picture is changing, and it remain unclear what the final impact will be.
8
Bank of England (November 2018) EU withdrawal scenarios and monetary and financial stability: A response to the House of Commons Treasury
Committee. https://www.bankofengland.co.uk/-/media/boe/files/report/2018/eu-withdrawal-scenarios-and-monetary-and-financial-stability.pdf
www.lancashireier.org 19Taking stock:
An audit of Lancashire’s economy in 2021
Figure 10. Proportion of employment in sectors vulnerable to Brexit
40%
30%
20%
10%
0%
y
en
le
le
i re
y
r
e
rn
on
y
l
e
e
oo
te
le
lle
al
le
ld
yr
nd
bb
bu
sh
rw
t
rn
as
or
nd
Fy
W
kp
Va
es
Pe
Ri
nd
Bu
Ch
ca
Da
nc
ac
e
Pr
le
ss
h
Hy
an
La
Bl
ut
ith
bb
Ro
tL
So
w
Ri
es
n
ur
W
kb
ac
Bl
Local Authorities England
Source: Metro Dynamics analysis, Bank of England
Key finding 3: The wide variance in sectoral make up means that the impacts of
Brexit will be felt very differently across Lancashire
Because of the importance of these issues, the Lancashire Enterprise Partnership is commissioning
an Internationalisation Strategy. We also note that the University of Central Lancashire’s Centre for
SME development posited that activity to support the “Internationalisation of businesses” was the
top priority for improving productivity,9 something which can only become more important in view
of the Government’s Global Britain agenda. The research output from this work will be incorporated
into the review.
The views of those working in sectors affected by Brexit will also be extremely valuable.
What is, or will be, the impact of the new Deep Dive:
Brexit settlement on Lancashire? Which Internationalisation
international markets should Lancashire This will explore the roles of international
be prioritising for trade and inward trade and foreign direct investment
investment? What is Lancashire’s unique in Lancashire against a changing
export proposition? geopolitical backdrop.
9
Productivity in Lancashire: Sparking New Ideas
www.lancashireier.org 20Taking stock:
An audit of Lancashire’s economy in 2021
Audit 1: People
We begin with our audit of the economic lives of people in Lancashire
for two reasons. Firstly, our principal reason for concern about economic
outcomes is a concern for the outcomes and wellbeing of the people of
Lancashire.
An economy that works well creates good, productive jobs, returning decent pay to workers.
A stagnant economy, with moribund businesses and low productivity, will create insecure jobs
paying low wages.
The second reason is that cause and effect run in both directions. Just as a malfunctioning
economy creates poor outcomes for people, so will poor outcomes for people damage the
economy. A workforce that is either frequently unwell, or lacking in the skills needed to work
productively, will hold back economic growth.
Outcomes through the lifecycle
These issues are multi-layered and complex. To begin to unpick them, we have used a lifecycle
approach that looks at outcomes for people in five different stages of life: early years, childhood,
young adults, working years, and older years. We have compared these data for local authorities
across England, to rate the values into five categories, from red (worse) to green (best).10
Firstly, we have ranked values for indicators, and secondly for the overall life stages, based upon
a combined score of all the indicators in that life stage.
10
For the methodology used please see Appendix 1
www.lancashireier.org 21Taking stock:
An audit of Lancashire’s economy in 2021
Figure 11. Lancashire through the lifecycle – outcomes at a glance
Education Deprivation Health
Lifecycle RAG score
EARLY YEARS Lower
% achieving good level of Child deprivation Overweight in reception
development
Education Deprivation Health Higher
CHILDHOOD
KS2 (expected attainment) Child deprivation Overweight in Year 6
Skills Work Health
YOUNG ADULTS Education & Training
Participation
Universal Credit Substance misuse
Skills Work Deprivation Housing Health
No or low qualifications Universal Credit Real Living Wage Fuel poverty Overweight (18+)
WORKING YEARS
Work Deprivation Health
OLDER YEARS Age 50+ in employment Low income household Healthy life expectancy
1
Source: Metro Dynamics analysis of various sources
The first thing that comes out very clearly is that Lancashire has significantly worse outcomes
for its people than national averages. Taken as a whole, Lancashire is not in either of the top two
categories on any of the metrics. This chimes with comments from Blackburn college in an early
submission to the review: “Deprivation, health and expectation remain the key barriers and perhaps
it is the presence of low expectation amongst some parts of the communities that presents the
most challenge.” The “levelling up” challenge in Lancashire will not be met until many of these
outcomes are improved.
Key finding 4: Health, education and skills, poverty, and deprivation are all
major issues in Lancashire. To transform the economy, investment in social
infrastructure is as important as physical infrastructure.
www.lancashireier.org 22Taking stock:
An audit of Lancashire’s economy in 2021
In particular, the two stages of the lifecycle that deserve particular focus are early years and working
years. This is echoed when looking at the differences between local authorities. All are RAG rated
either ‘red’, ‘orange’ or ‘yellow’ for early and working years:
Figure 12. Lancashire through the lifecycle – local authority categorisations
Source: Metro Dynamics analysis of various sources
This is likely to have impacts on social mobility, with people being held back at key life stages.
The panel is also particularly concerned about the heavy impact Covid-19 has had on young adults
in particular, many of whom work in sectors that have been shutdown, or have been deprived of the
social contact and learning opportunities that would normally be afforded by college and university.
Uncertainty for businesses has caused hiring to drop across the UK and this is likely to have limited
career progression for young people entering the labour market for the first time.
We are encouraged to see local responses, such as from the University of Central Lancashire, who
are working with the Social Mobility Pledge, and are taking proactive action around their Burnley
campus.
www.lancashireier.org 23Taking stock:
An audit of Lancashire’s economy in 2021
This analysis also shows us where, spatially, the biggest challenges are. Blackpool and East
Lancashire have the most significant challenges, with Blackpool having the lowest RAG rating
across every life stage. Outcomes in Ribble Valley are generally best, although we note that some
particular challenges associated with living in rural areas – such as poor transport connectivity
– are not picked up by this analysis. Importantly, health is consistently a factor in those local
authorities which are lowest performing across the lifecycle (‘red’ RAG rated).
Education and skills are another area where there are challenges – our evidence would suggest
early years, and skills among the labour force needs to be a particular focus. Positively, the Further
Education system in Lancashire is robust, with half of the colleges rated as outstanding. The
colleges work together through The Lancashire Colleges umbrella organisation, and there are some
close FE-HE links as well,11 which is an encouraging sign of a co-ordinated approach to tackle skills
deficits. This will be needed in order to raise the general skills level of the population – which may
require the strengthening of pathways into FE for those already in the workforce. While the quality
of provision is high, it is a lack of participation that is preventing this translating into better skills
outcomes.
However, the findings above, in line with other data sources, highlight health as perhaps the biggest
challenge facing Lancashire’s people. Health deprivation shows Lancashire to be much worse than
the English average:
Figure 13. Health deprivation – neighbourhoods in each English decile of deprivation
Deprivation filter page return
Deprivation decile
Neighbourhoods in each national deprivation decile
Decile 1 2 3 4 5 6 7 8 9 10
30%
25%
20%
15%
England = 10%
10%
5%
0%
1 2 3 4 5 6 7 8 9 10
Source: Ministry of Housing, Communities, and Local Government. Neighbourhoods are equivalent to Lower Super Output Areas
(LSOAs), which typically contain between 1,000 and 3,000 residents.
11
For example, Lancaster University accredits degree level qualifications for Blackburn and Blackpool colleges.
www.lancashireier.org 24Taking stock:
An audit of Lancashire’s economy in 2021
Over a quarter of neighbourhoods in Lancashire fall in England’s bottom 10%. Lancashire is
overrepresented in the bottom five deciles, and underrepresented in the top five, with less than 1% in
the very best category.
The recently published health index from the ONS presents similar findings. It provides an objective
ranking of all upper-tier authorities in England, drawing on a breadth of measures. There are three
main categories: healthy people (which includes mortality, physical health conditions, personal
wellbeing, and mental health), healthy lives (which includes working conditions, behavioural risk
factors, and unemployment), and healthy places (which includes access to green space, the quality
of the local environment and access to health services).
Figure 14. Rankings of upper tier/unitary authorities in England by health index outcomes
Overall
Healthy
people
Healthy
lives
Healthy
places
Lancashire Blackburn Blackpool
Better Worse
(County Council) with Darwen
Source: ONS Health Index for England in 2018
This reinforces the reality of very poor health outcomes in Blackpool – but all Lancashire authorities
are in the bottom half of the index. Positively, all areas perform better in the “healthy places”
domain, especially Lancashire and Blackburn with Darwen. This reflects some of the features of a
healthy environment found in Lancashire: good access to the countryside, generally lower air and
noise pollution, and access to GP surgeries and pharmacies.
www.lancashireier.org 25Taking stock:
An audit of Lancashire’s economy in 2021
Why does this matter to an economic review? Firstly, poor health imposes significant costs by
reducing economic activity. The Northern Health Science Alliance estimates that 30% of the
productivity gap between the North of England and the rest of England is due to ill health, a cost of
£13.2bn a year.12
This estimate was made before Covid-19, and while the full impact of the pandemic (and the extent
to which its effects on health are long lasting) is unknown, it can only have served to worsen this
picture. Secondly, we know that health and social care costs feed directly back to local authorities,
absorbing budgets and reducing capacity to focus on economic development, business cases
for infrastructure, and other vital activity for Lancashire’s progress. This will only increase as the
population ages – underscoring the need to take action.
While this is partly a question of funding for health services, long-standing issues will not simply be
solved by additional money. Innovation is needed in the health and care sector, and new models of
co-working and commissioning between authorities may be needed.
Key finding 5: Poor health outcomes are weighing on economic output and local
government capacity. In the wake of Covid-19, this need merits further analysis.
To explore these issues further, and see how they link through to people’s wealth and wellbeing, the
Panel has commissioned a report to look further into this issue. We are keen to hear the views of
stakeholders on this topic.
What are the barriers to people Deep Dive:
participating in, and benefiting from, Health, Wealth, and Wellbeing
economic growth? How do health, This deep dive will explore the causes
education, and skills in Lancashire impact of health and wellbeing challenges in
upon people’s life chances – and how Lancashire and make recommendations
effectively do these systems work? about how residents can be empowered
to live healthy, productive lives in the wake
of the Covid-19 crisis.
12
https://www.thenhsa.co.uk/app/uploads/2018/11/NHSA-REPORT-FINAL.pdf
www.lancashireier.org 26Taking stock:
An audit of Lancashire’s economy in 2021
Audit 2: Place
Figure 15. Lancashire, viewed from the west
Source: Metro Dynamics analysis of Bing aerial, NASA, Ordnance Survey. Elevations have been accentuated for clarity.
The historic county of Lancashire was established in 1182.13 Since then, its
borders have shifted. While the notion of Lancashire attracts loyal feeling,
we know that the way people live their lives day-to-day does not necessarily
follow administrative boundaries. How does Lancashire work as a place?
Lancashire has boundaries with five other major northern geographies (see Figure 15). Cumbria sits
to the North, facing the county across Morecambe Bay. North Yorkshire sits to East of Lancashire
across the Pennines, and to the West and South sit three of the major Northern city regions: West
Yorkshire, Greater Manchester and the Liverpool City Region. Lancashire has a key strategic
position within the Northern Powerhouse.
Lancashire also has two major natural boundaries – the Irish Sea to the West and the Pennines to
the East. These “hem in” the county, for economic purposes – the data we have so far suggests that
“people flows” are limited in these directions, and those leaving the county for work are more likely
to go north or south, than east or west.
The sea has had, and continues to have, a defining influence on Lancashire’s economy. The county
has 137km of coastline. Heysham port is a key transport link to Lancashire’s neighbours across the
sea with connections to Belfast, Dublin and the Isle of Man.
13
https://web.archive.org/web/20160304185947/http://www.highsheriffs.com/Lancashire/LancashireHistory.htm
www.lancashireier.org 27Taking stock:
An audit of Lancashire’s economy in 2021
In recent years, it has shipped almost five million tonnes of freight every year.14 The sea has also
been at the heart of Lancashire’s tourism growth, centred on Blackpool, which remains the UK’s
most visited seaside resort.15 The scenery and wildlife at Morecambe Bay, including the Arnside &
Silverdale Areas of Outstanding Natural Beauty (AONB), is also a major visitor attraction. However, in
common with much of the UK, Lancashire’s coastal population has pockets of poverty and extreme
deprivation – associated with high levels of seasonal work at coastal attractions and distance from
other employment opportunities.
In a similar manner, the Pennines are both an area of environmental importance, and boast many
attractive landscapes – but can act as a barrier to opportunity in places. The Forest of Bowland
is one of England’s Areas of Outstanding Natural Beauty (AONB), and of huge significance for
biodiversity. 13% of the area is designated as a Site of Special Scientific Interest (SSSI), and the
area is designated a special protection area (SPA) for birds, including hen harriers – one of the few
strongholds for this bird in the UK.16
At the same time, the Pennines have caused transport links to be limited – rail connections end at
Colne and Clitheroe,17 meaning rail transport into North Yorkshire is impossible, nor are there any
direct motorway links into Yorkshire, as there are north and south of Lancashire. Districts within
the Pennines – such as Ribble Valley and Pendle – are likely to experience some of the challenges
particularly associated with rural areas, such as an ageing population, reduced access to jobs and
skills provision, unaffordable housing in some areas, and seasonal employment. This is balanced by
opportunities – such as developing localised business clusters, attracting lifestyle entrepreneurs on
the basis of strong broadband connectivity, and building on natural assets. The Review will need to
explore these issues further.
Between the coast and the Pennine hills, there is a mix of very different places. Close to the
geographic centre of Lancashire, Preston sits on the River Ribble. The city is at the heart of
Lancashire’s transport network, meeting at the axis of North-South and East-West connectivity for
both road and rail. Preston station is the most used in Lancashire, with an estimated 4.6m entries
and exits in 2018/19, more than double that of the next station (Lancaster – 2.1m).18
This connectivity is likely to be one factor behind Preston’s strong population growth over many
decades, to becoming the largest centre by population.19 However, Preston does not have the
same “pull” on it surrounding area as a larger city like Manchester has on the Greater Manchester
area. As the economic geography data shows (Figures 18 and 19), Preston is among the top three
commuting and house move destinations for around half of Lancashire’s districts – though rarely in
first place. Preston has strong economic links with the districts of South Ribble and Chorley to the
south, which connect through to Greater Manchester to the south.
14
Department for Transport table PORT0101
15
https://www.visitblackpool.com/latest-news/another-year-of-growth-for-blackpool%E2%80%99s-tourism-eco/
16
For more, see: https://www.forestofbowland.com/wildlife
17
The railway line does in fact carry on past Clitheroe to Hellifield, but no passenger services currently run on this line.
18
Source: Office for Road and Rail
19
Using the ONS “Built-up Areas” definition, according to which the population was 325,841 in 2019
www.lancashireier.org 28Taking stock:
An audit of Lancashire’s economy in 2021
To the East of Preston is Blackburn, a cathedral city. From here, a historic transport corridor,
originally based on the Leeds and Liverpool Canal and now the M65 and railway links, has been
the basis for the growth of what is almost – but not quite – a continuous urban area, stretching
from Blackburn to Colne. This connects the towns of Accrington, Oswaldtwistle, Padiham, Burnley,
and Nelson, rising up into the Pennines. The growth of these towns was closely tied to the textiles
sector, and they retain significant concentrations of industrial activity. This is part of an East-West
corridor that contains the majority of Lancashire’s population.
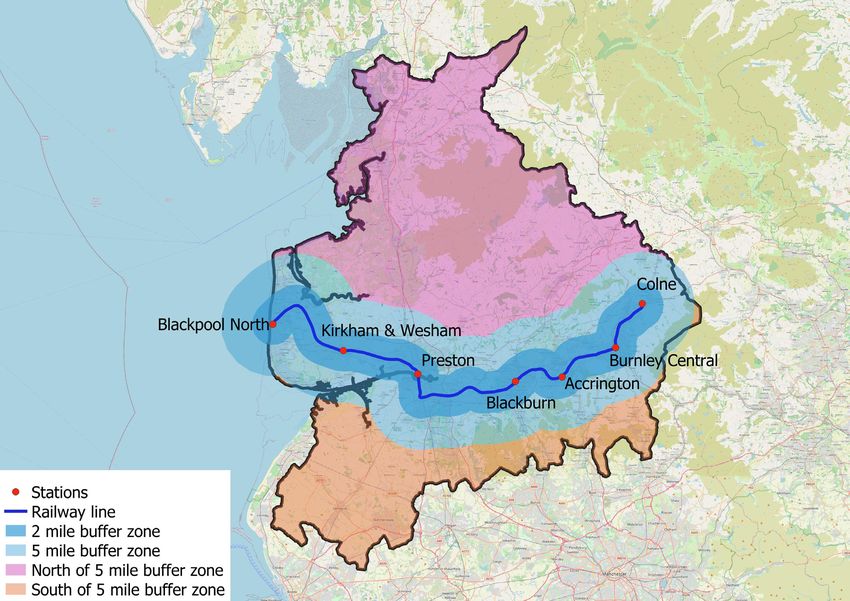
To illustrate this, Figure 16 shows the railway line linking Blackpool North station and Colne – both
stations at the end of a line. A traveller who took this route, changing at Preston, would pass within
two miles of half of Lancashire’s population. If we expand this buffer zone to five miles, it would
capture another 21%. The remaining 29% is split almost exactly between the north and south of this
buffer zone. Approximately half of the population of the northern (pink) area is based in Lancaster-
Morecambe – combined with the buffer zone below this creates an “arc” where the majority of
population and economic activity takes place.
Figure 16. The East-West distribution of most of Lancashire’s population
15%
50%
21%
15%
Source: Metro Dynamics analysis of ONS mid-year population estimates. Percentages do not sum to 100% due to rounding.
www.lancashireier.org 29Taking stock:
An audit of Lancashire’s economy in 2021
However, the transport infrastructure in Lancashire at the moment doesn’t reflect this East-West
reality. The West Coast mainline, which stops at Preston and Lancashire is a fast, reliable, and
frequent service, connecting through to Manchester, Birmingham, London, and Glasgow. However,
East-West rail in Lancashire is much slower. This is illustrated by the fact that, while Lancaster is
more than twice as far from Preston as Blackburn, it is more quickly reached by train. While there
is motorway connectivity via the M65 to Colne, this road ends abruptly there, and doesn’t provide
links into Yorkshire. The two main roads that perform this function – the A6068 and the A56 – are of
insufficient standard to function as interregional routes, with congestion and speed limits acting as
a barrier to effective transportation.
Key finding 6: Lancashire’s physical geography has meant that transport
infrastructure has become more aligned with the North-South axis, but the
population generally lives on an East-West axis.
And rail coverage is not even across Lancashire – for example the district of Rossendale has no rail
connectivity. But it sits as a gateway between this East Lancashire corridor and Greater Manchester,
containing the strategic M66/A56 corridor.
On the west side of Lancashire are three more rural districts – Wyre, Fylde, and West Lancashire.
These districts sit on very high-quality farmland – in fact, West Lancashire is home to England’s
second largest concentration of Grade 1 agricultural land, after the fens. Fylde and Wyre have
significant concentrations of Grade 2 land. This is likely to only increase in importance as food
security rises up the agenda in the face of climate change.
Figure 17. Agricultural land grades in Lancashire
Agricultural land grades
Grade 1
Grade 2
Grade 3
Grade 4
Grade 5
Non Agricultural
Urban
Source: DEFRA
www.lancashireier.org 30Taking stock:
An audit of Lancashire’s economy in 2021
However, this area is also perhaps the most exposed to climate change, due to being low-lying and
next to the sea, meaning rising sea levels could have a dramatic impact. How the land has been
managed also contributes to challenges, with the Wildlife Trust noting in their submission to the
review that:
“Centuries of drainage of lowland peat soils in Lancashire for conventional agriculture have led to
decomposition of peatland habitat, peat soil losses and subsidence… degraded peatlands contribute
to climate-changing emissions of carbon dioxide and methane and degrade faster as a result of
climate-change effects.”
How can Lancashire best respond to the climate emergency, protect
and enhance its natural environment, and support the transition to
low/zero carbon?
Finally, in the north of Lancashire is the county town of Lancaster, which sits across the River Lune
from Morecambe. While well connected to central Lancashire via the M6 and West Coast Mainline,
Lancaster is at some distance from the central population corridor, though still has clear economic
relationships with Preston, as well as north into South Lakeland in Cumbria (see Figures 15 and 16).
This brief overview highlights just how diverse Lancashire is. In their submission to the Review, the
University of Cumbria in Lancaster comment:
“Lancashire is highly differentiated geographically, and different parts of the County have varied
economic structures with associated strengths and weaknesses”.
This chimes with feedback from many others.
Key finding 7: This is one of the most diverse regions in the country. There is no
one urban core but rather a polycentric set of towns and cities, agricultural land,
natural capital, industrial zones and coastal areas. Climate change presents a
real threat which needs to be responded to.
To understand how these many different places are linked in economic terms, we have begun
exploring data that teases out the economic geography of Lancashire. However, our current data on
this question is limited.
One of the main questions we want to answer is: where do people go to work? To do this, we have to
look back ten years to the 2011 Census.
www.lancashireier.org 31Taking stock:
An audit of Lancashire’s economy in 2021
Figure 18. Primary destinations for Lancastrians travelling to work
Within Lancashire Outside Lancashire Rank
1st
West Lancashire
commuting to
South Lakeland
Ribble Valley
South Ribble
District
Rossendale
Blackburn
Lancaster
2nd
Blackpool
Hyndburn
Rochdale
Liverpool
Preston
Chorley
Burnley
Craven
Pendle
Sefton
Bolton
Wigan
Fylde
Wyre
Bury
3rd
Lancaster
Blackpool
Fylde
Wyre
District commuting from
Preston
South Ribble
Chorley
Ribble Valley
Blackburn
Hyndburn
Burnley
Pendle
Rossendale
West Lancashire
Source: Metro Dynamics Analysis of Census 2011
This chart shows where, in 2011, people commuted to for work, by the top three locations (not
including other locations within the same district). This data is provided by lower-tier local authority
districts – it may be helpful to consult the map on page 9.
These findings suggest that:
• Blackpool, Fylde, and Wyre are closely connected, each appearing in the top two destinations for
the other two districts.
• Preston is the most significant commuter destination, appearing in the top three for eight
districts, mostly in second place. These are in all directions – North (Lancaster, Wyre), East
(Blackburn, Ribble Valley), South (Chorley, South Ribble) and West (Blackpool, Fylde).
However, it is only the top district for South Ribble.
• There are four district pairings with the strongest possible relationship (both being first for
the other district). These are: Blackpool and Fylde, Preston and South Ribble, Blackburn and
Hyndburn, and Burnley and Pendle.
• The relationship between some districts and the rest of Lancashire is more tenuous. Lancaster’s
primary commuter destination is South Lakeland in Cumbria. Rossendale’s first and second
destinations (Rochdale and Bury) are in Greater Manchester. And most notably, all three of West
Lancashire’s commuter destinations are outside of Lancashire – and it doesn’t feature in any
other district’s top three.
• The fact that Craven only features once, and no other Yorkshire districts do, suggests there are
currently weak economic links to Yorkshire. The larger cities of Liverpool and Manchester also do
not feature. Both of these may have changed since the data was published.
www.lancashireier.org 32You can also read