Tamil version of the Fear of COVID-19 Scale - Research Square
←
→
Page content transcription
If your browser does not render page correctly, please read the page content below
Tamil version of the Fear of COVID-19 Scale
Jaishankar Bharatharaj
Bharath Institute of Higher Education and Research https://orcid.org/0000-0002-5277-7335
Mohsen Alyami
University of Auckland https://orcid.org/0000-0001-9278-1841
Marcus A. Henning
University of Auckland https://orcid.org/0000-0002-1135-3464
Hussain Alyami
Taif University https://orcid.org/0000-0001-5792-6638
Christian U. Krägeloh ( chris.krageloh@aut.ac.nz )
Auckland University of Technology https://orcid.org/0000-0002-7298-0736
Research Article
Keywords: Coronavirus, COVID-19, Fear of COVID-19 Scale, Tamil, Rasch analysis
DOI: https://doi.org/10.21203/rs.3.rs-40914/v1
License: This work is licensed under a Creative Commons Attribution 4.0 International License.
Read Full License
Page 1/13Abstract
Background: The seven-item Fear of COVID-19 Scale (FCV-19S) assesses severity of fear of COVID-19
(novel coronavirus). The present study translated the scale into Tamil and tested its psychometric
properties so that the scale can be used in Tamil-speaking populations.
Methods: The FCV-19S was translated into Tamil following a forward-backward translation procedure.
Using an online-based survey, 95 participants completed the Tamil version of the FCV-19S alongside
questions about demographic information. Psychometric properties were examined using Partial-Credit
Rasch analysis, which was suitable for analyzing a questionnaire of this length with the present sample
size.
Results: The data t for the Rasch model was con rmed without the need for any adjustments. Item
means were comparable to those reported in other studies, with some evidence of clustering of items,
although not su cient to challenge the unidimensionality of the scale. Reliability was very high (α= 0.93),
and there was no evidence of differential item functioning by age, sex, or education.
Conclusion: The Tamil version of the FCV-19S has a unidimensional structure with robust psychometric
properties. It can thus be used in research assessing the psychological impact of COVID-19 among Tamil-
speaking populations. Further studies with larger samples are required to provide population reference
values.
Introduction
The novel coronavirus outbreak in December 2019 (COVID-19), caused by Severe Acute Respiratory
Syndrome Coronavirus 2 (SARS-CoV-2), had spread to 213 countries and territories since December 2019
until the time of writing this paper (Worldometer 2020). As of 28 June 2020, there are 10,012,299
con rmed cases and a reported death toll of 499,185 worldwide. In India, the number of COVID-19 cases
is growing exponentially with 505,953 cases and 15,685 deaths (Johns Hopkins University & Medicine
2020). The state of Maharashtra, Delhi, and the state of Tamil Nadu have the highest number of
con rmed COVID-19 cases, respectively (Johns Hopkins University & Medicine 2020).
The impact of the pandemic itself and the measures taken to contain the spread of COVID-19 (e.g.,
quarantine) and their subsequent social and economic consequences on mental health and well-being is
likely to be signi cant (Galea et al. 2020; Rajkumar 2020). A recent review found that anxiety and
depression symptoms, stress and disturbed sleep were common manifestations of the COVID-19
pandemic (Rajkumar 2020).
Research has also shown heightened levels of fear of COVID-19 among various populations (Knipe et al.
2020), including healthcare professionals (Lu et al. 2020), similar to previous viral epidemics (Bukhari et
al. 2016; Reynolds et al. 2008). Fear of COVID-19 could worsen mental health and well-being (e.g. among
Page 2/13university students, see Gritsenko et al. 2020) or it could motivate individuals to comply with the
recommended health measures (Harper et al. 2020; Winter et al. 2020).
Ahorsu et al. (2020) recently developed the Fear of COVID-19 Scale (FCV-19S) which measures the
severity of fear of COVID-19. The FCV-19S is a unidimensional seven-item scale with robust psychometric
properties (Ahorsu et al. 2020). Using the English version of the FCV-19S, a recent study (Doshi et al.
2020) examined the level of fear of COVID-19 among 1,499 Indian residents and found that more than
half of the sample (54.8%) reported low levels of fear. In this study, participants who were female,
married, had lower educational status and working in healthcare had signi cantly higher odds of
reporting higher levels of fear of COVID-19 (Doshi et al., 2020). To accurately assess fear of COVID-19, the
reliability and validity of the FCV-19S need to be rst evaluated in the targeted population, particularly in
their preferred language. In this study, the language that we focused on is Tamil, which is widely spoken
in the southern states of India, Sri Lanka, Malaysia, and Singapore. For example, Tamil is predominantly
spoken in Tamil Nadu, an Indian southern state with a population of over 72 million people according to
the 2011 Census (National Informatics Centre 2020). The present study developed a Tamil version of the
FCV-19S and assessed its psychometric properties using Rasch Analysis.
Methods
Participants
Participants were Tamil-speaking adult Indian citizens residing in the state of Tamil Nadu since the
COVID-19 pandemic was declared by the World Health Organization. The respondents were able to read
and write in the Tamil language and were aged between 18 and 67 years. A total of 95 responses was
received. Due to a programming error, 25 participants had no data available for age, 33 no data for
education, and 4 no data for gender. With the available data on remaining participants, the mean age was
31.07 years (SD=10.25) with 46 (51%) male and 45 (49%) female participants. Ten respondents indicated
that they had completed their schooling, 40 had graduated from a higher-education institute, and 11
participants held a post-graduate quali cation.
Procedure
Participants were recruited using a snowball sampling method to complete an anonymous online survey.
The research was advertised via social media platforms (Facebook and LinkedIn), personal and
professional networks through email with detailed aims and objectives of the study. The Google Forms’
link was included in the advertisement, and instructions on completing the survey was provided.
Participants were also requested to share the survey link with their personal and professional contacts.
Answering all questionnaire items were mandatory to submit. The questionnaire also contained a brief
section on demographic information (gender, age, and education). Data reported in this study were
collected from 31st of May to 21st of June 2020. Participation in the study was voluntary, and no reward
Page 3/13or compensation was provided. The study was approved by the Bharath University Ethics Committee (BUEC IRB 062020-1). Adaptation of FCV-19S into Tamil Following established protocols for cross-cultural adaptation (Alyami et al. 2019; Henning et al. 2020), the original FCV-19S was translated from English into Tamil using forward-backward translation. First, the questionnaire was translated into Tamil by an independent translator uent in both English and Tamil and with a post-graduate quali cation. Second, the rst author, who is uent in English and Tamil reviewed the provisional Tamil translation and discussed any concerns with the independent translator. Third, after approval of the Tamil translation, the preliminary Tamil version was back translated into English by an independent native speaker of Tamil, with a post-graduate quali cation in English who at that time was unfamiliar with the original scale. At the nal stage, any discrepancies were discussed with the team of translators. The nal Tamil version of the FCV-19S can be found in the appendix. Measures Fear of COVID-19 The seven-item FCV-19S (Ahorsu et al., 2020) measures respondents’ fear levels of COVID-19. All items are positively worded, implying that higher scores indicate greater levels of fear. Respondents rate items on a 5-point Likert scale, ranging from 1 (strongly disagree) to 5 (strongly agree). Most validation studies have proposed a unidimensional solution, which allows the calculation of a total score (range 7 to 35) by summing all seven items. The scale has shown robust psychometric properties in its various language versions (Ahorsu et al., 2020; Alyami et al. 2020; Huarcaya-Victoria et al. 2020; Perz et al. 2020; Sakib et al. 2020; Satici et al. 2020; Soraci et al. 2020; Tsipropoulou et al. 2020) including high internal consistency (Cronbach’s alpha ranging from .81 to .91). Statistical analysis Descriptive statistics were conducted using IBM SPSS Statistics v 26 software. Item-level analyses included means, standard deviations, skewness, and kurtosis. Internal consistency was assessed by Cronbach’s alpha (α) coe cients and the impact on alpha if each item was deleted. Inter-item correlations and corrected item-total correlations further explored associations between items, where coe cients between .30 and .70 suggest medium to strong associations (Ferketich 1991). Detailed psychometric properties of the Tamil version of the FCV-19S were investigated using Partial- Credit Rasch analysis with the software RUMM2030 (Andrich 2009). Given the small number of items in the scale, the present sample size of 95 was considered su cient (Willse 2017). This meant that the analyses provided 95% con dence that the item locations would be within + 0.50 logits (Linacre 1994). A likelihood ratio test con rmed the suitability of the present dataset for the partial-credit model (χ2(17) = 41.48, p
indicated by a nonsigni cant (p> .05, Bonferroni adjusted) chi square for item-trait interaction (Krägeloh
et al. 2019). Solutions were inspected for signi cant item mis t and differential item functioning by
demograghic factors. Given a previous proposal for a two-factor solution of the FCV-19S (Bitan et al.
2020), residual correlations were monitored for patterns that could indicate the presence of
multidimensionality. After a nonsigni cant Rasch t had been achieved, unidimensionality was tested
using Smith’s (2002) test. As a measure of internal consistency reliability, Rasch analysis provides the
Person Separation Index (PSI). The value is interpreted in a similar way as Cronbach’s α, where values of
.70 or higher indicate acceptable reliability (DeVellis 2016). While a minimum PSI of .70 is required for
group comparisons of scale scores, values of .85 and above indicate that the scale is suitable for within-
participant analyses such as comparisons of change scores (Tennant and Conaghan 2007).

Results
Table 1 shows descriptive statistics for the Tamil version of the FCV-19S. Skewness values ranged from
-0.79 to 0.59. Kurtosis was mostly negative, with the exception of item 7 (1.50), which also had a value
that is at the cusp of the recommended acceptable range of -1.50 to 1.50 (Byrne and Campbell 1999).
Overall Cronbach’s alpha was 0.93, and Cronbach’s alpha values when item deleted were either .91 or .92.

Table 1. Descriptive details for the Tamil FCV-19S (overall Cronbach alpha score = 0.93)

                                 Item          Mean (SD)          Skewness         Kurtosis      Cronbach alpha when item deleted

                                   1           3.45 (1.24)           -0.79           -0.46                            .92

                                   2           3.35 (1.27)           -0.65           -0.71                            .92

                                   3           2.37 (1.35)            0.56           -1.05                            .91

                                   4           2.75 (1.47)            0.16           -1.42                            .91

                                   5           3.16 (1.45)           -0.32           -1.36                            .91

                                   6           2.44 (1.47)            0.59           -1.15                            .91

                                   7           2.66 (1.53)            0.28           1.50                             .91

                             Total score       20.18 (8.13)          -0.06           -1.26                             -

A comparative overview of means, skewness, kurtosis with those found in 13 other samples around the
world is provided in Table 2. Overall, the data from the present Tamil version demonstrate less skewness
and kurtosis than most other comparison datasets. High skewness and kurtosis such as found in the two
New Zealand samples (Winter et al. 2020) and one of the studies reporting data from a Hebrew version
(Bitan et al. 2020) was related to low means and possible oor effects for items 3, 6, and 7. The pattern
of item means of the Tamil version appeared to be most similar to that of the Bangla version (Sakib et al.
2020) and also similar to that found for the English-language version used in a sample in India (Doshi et
al. 2020).

Table 2. Means, skewness, and kurtosis values for the present Tamil version of the FCV-19S and comparative values for other language versions.

                                                                               Page 5/13
Item Statistic Tamil Arabic Bangla English English English English Hebrew Hebrew Italian Persian Russian Spanish Turkish
(NZ (NZ (India) (US) (Study (Study
Sample Sample 1) 2)
1) 2)
1 Mean 3.45 2.98 3.62 3.06 3.62 3.24 3.2 2.95 3.09 3.44 3.48 2.82 2.9 3.46
2 Mean 3.35 3.31 3.52 2.88 3.45 3.12 3.0 3.23 2.97 2.94 4.01 3.31 2.7 3.63
3 Mean 2.37 1.71 2.49 1.57 1.73 2.23 1.9 1.56 1.33 1.50 3.76 1.70 1.6 1.79
4 Mean 2.75 2.36 2.93 2.16 2.42 2.50 2.7 2.15 1.64 2.41 4.24 2.62 2.5 3.07
5 Mean 3.16 2.97 3.53 2.66 3.30 2.91 3.1 2.91 2.86 2.94 3.53 3.17 2.5 3.67
6 Mean 2.44 1.68 2.41 1.65 1.89 1.95 2.0 1.73 1.42 1.56 4.11 1.53 1.8 2.01
7 Mean 2.66 1.94 2.88 1.61 1.87 2.07 2.3 1.79 1.59 2.11 4.26 2.07 1.8 2.40
1 Skewness -0.79 -0.08 -0.82 0.47 0.04 -0.38 -0.29 - -0.28 -0.36 -0.34 -0.50
2 Skewness -0.65 -0.45 -0.77 0.65 0.18 -0.32 -0.06 - -0.25 -0.13 -0.58 -0.80
3 Skewness 0.56 1.51 0.46 2.52 1.90 0.72 1.10 - 2.31 1.99 -0.42 1.33
4 Skewness 0.16 0.63 -0.09 1.37 1.06 0.41 0.24 - 1.48 0.55 -1.18 -0.19
5 Skewness -0.32 -0.10 -0.98 0.77 0.18 -0.20 -0.13 - 0.08 0.11 -0.36 -0.83
6 Skewness 0.59 1.71 0.60 2.33 1.75 1.01 0.95 - 2.13 1.48 -0.79 1.00
7 Skewness 0.28 1.17 0.05 2.38 1.72 0.86 0.82 - 1.64 0.87 -0.91 0.50
1 Kurtosis -0.46 -0.88 0.18 -1.02 -1.20 -0.71 -0.94 - 0.72 -0.35 -0.61 -0.47
2 Kurtosis -0.71 -0.70 -0.14 -0.81 -1.28 -0.94 -1.30 - -1.00 -1.02 -0.12 -0.20
3 Kurtosis -1.05 2.48 -0.68 7.56 4.22 -0.18 0.37 - 5.98 3.37 0.12 1.85
4 Kurtosis -1.42 -0.52 -1.16 0.93 0.09 -0.84 -1.30 - 1.85 -0.72 0.98 -1.12
5 Kurtosis -1.36 -1.01 0.14 -0.69 -1.29 -1.13 -1.30 - -1.06 -1.04 -0.47 -0.05
6 Kurtosis -1.15 3.10 -0.54 5.58 2.88 0.66 0.08 - 4.50 1.28 0.56 0.40
7 Kurtosis -1.50 0.76 -1.22 5.69 2.38 0.05 -0.42 - 1.97 -0.39 0.78 -0.82
Shown above are values for versions in Arabic (Alyami et al. 2020), Bangla (Sakib et al. 2020), English (New Zealand Samples 1 and 2 as reported by Winter et al. 2020,
sample from India by Doshi et al. 2020, and sample from the US by Perz et al. 2020), Hebrew (Study 1 by Bitan et al. 2020 and Study 2 by Zolotov et al. 2020), Italian (Soraci
et al. 2020), Persian (Ahorsu et al. 2020), Russian (Reznik et al. 2020), Spanish (Huarcaya-Victoria et al. 2020), and Turkish (Satici et al. 2020). For one of the studies reported
a Hebrew version (Bitan et al. 2020) and the Spanish version (Huarcaya-Victoria et al. 2020), no skewness and kurtosis values had been reported. Means for the English (US)
Spanish version had been reported to one decimal place only. Skewness and kurtosis of the English (India) sample was calculated based on Table 2 of Doshi et al. (2020).
Skewness and kurtosis values 1.50 and above or values -1.50 and below are shown in bold-type font.
Table 3 shows inter-item correlation coe cients as well as corrected item-total correlation coe cients for
each item. All items were moderately to highly correlated with each other, and item-total correlation
Page 6/13ranged from .68 to .84. Item 7 was highly correlated (r= .79) with items 3 and 6. While this may indicate a
potential item cluster, the pattern was not very clear from this analysis, as item 7 was also highly
correlated (r= .72) with item 4. Additionally, correlations between other items with items 3, 6, and 7 were
not generally lower than correlations among items 1, 2, 4, and 5.
Table 3. Inter-item Pearson’s correlation matrix and corrected item-total correlations
Item Item 1 Item 2 Item 3 Item 4 Item 5 Item 6 Item 7 Corrected item-total correlations
1 - .70
2 .67* - .68
3 .54* .55* - .78
4 .58* .53* .65* - .78
5 .66* .62* .56* .73* - .78
6 .54* .56* .77* .66* .61* - .79
7 .58* .57* .79* .72* .71* .79* - .84
*Statistically significant at p < .01 (2–tailed)
The baseline model of the Rasch analysis already provided a satisfactory t (χ2(14)= 16.85, p>.05), with
no evidence of differential item functioning by demographic variables. None of the items were mis tting
and were well within the acceptable range of -2.50 to 2.50. Due to a previous report of a two-factor
structure of the scale (Bitan et al. 2020), the results were inspected for any indications of
multidimensionality in the present dataset. The residual correlation coe cients for items 3, 6, and 7
exceeded the mean value of all such residual correlations by at least 0.20, indicating some local response
dependency. However, since the overall t was satisfactory, this local dependency was not su cient to
warrant postulating a second factor. Smith’s (2002) test indicated that the seven-item solution was
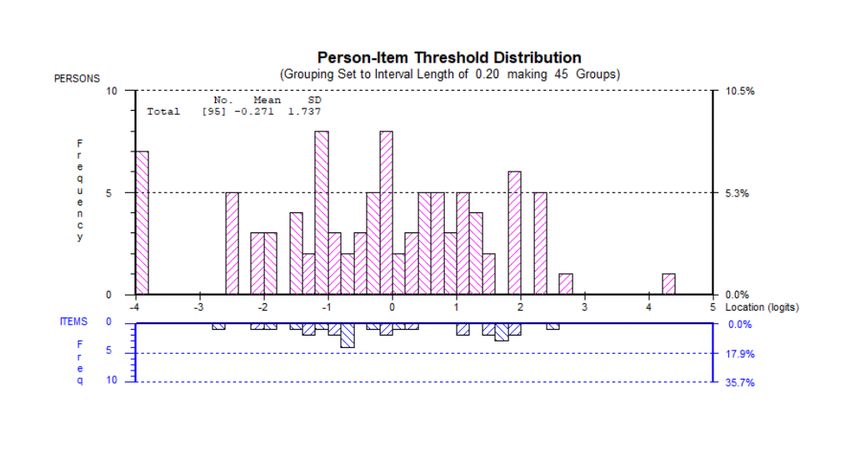
unidimensional. The internal consistency of this unidimensional solution was excellent. PSI was .88,
indicating that the scale is suitable for between-group as well as within-group comparative analyses. The
only issue highlighted was in the person-item distribution. As shown in Figure 1, items failed to provide
enough coverage for the bottom 7% of the sample. This oor effect indicates that the scale is unsuitable
to provide detailed differentiation between participants at the very low end of the fear of COVID-19
spectrum.
Discussion
The present study translated the FCV-19S into Tamil and tested its psychometric properties using Rasch
analysis. The data t the unidimensional Rasch model very well, with no item mis t or differential item
functioning by demographic variables. Item means, skewness, and kurtosis were comparable to those of
other international studies, particularly when compared with the Bangla version or a sample from India
that had completed the English-language version. Internal consistency reliability of the Tamil version of
Page 7/13the FCV-19S was also excellent, even exceeding the values obtained in other language versions, making
the tool both valid and reliable for the assessment of fear of COVID-19 suitable for both between-group
and within-participant comparisons in Tamil-speaking populations. Due to some oor effects, the FCV-
19S may fail to differentiate between individuals who have very low levels of fear.
Our study replicated common reports that the FCV-19S provides a unidimensional assessment of fear of
COVID-19 (Ahorsu et al., 2020; Alyami et al. 2020; Perz et al. 2020; Sakib et al. 2020; Satici et al. 2020;
Soraci et al. 2020; Tsipropoulou et al. 2020). The only exception is a study reporting on results from a
Hebrew version (Bitan et al. 2020) where the authors proposed that items 1, 2, 4, and 5 (generally afraid,
uncomfortable thinking about COVID-19, afraid of losing life, anxious from news) form a factor called
emotional fear reactions and that item 3, 6, and 7 (clammy hands, lack of sleep, heart racing) be grouped
into a factor called symptomatic expressions of fear. Pakpour et al. (2020) argued that the statistical
approach used by Bitan et al. (2020) was inappropriate and that a con rmatory factor analysis should
have been used instead of a principal components analysis where a two-factor was forced even though a
single-factor solution had already indicated that a t was adequate. In their validation of the Arabic
version of the FCV-19S, Alyami et al. (2020) noted error co-variance for items 3, 6, and 7, although this
could be resolved by correlating the error co-variance in a con rmatory factor analysis. The present study
of the Tamil version also noted some residual correlations that indicate a clustering of items 3, 6, and 7.
However, these relationships were not substantial enough to challenge the unidimensionality of the scale.
As shown in our overview of various studies (Table 2), these three items tend to exhibit oor effects. This
was particularly the case in the study by Bitan et al. (2020), which indicates that the clustering of items 3,
6, and 7 may be due to sample-related method effects. This was not the case for the present Tamil
version, which may be used with con dence as a unidimensional scale.
The following limitations of the present study need to be noted. Firstly, although the present sample size
met the minimum requirements for Rasch analysis, collection of more data using this scale would
provide more accurate reference mean scores for future comparative work using the Tamil version. Such
work may also attempt to achieve better representation by demographic factors than achieved by the
snowball sampling of the present study. Secondly, the present psychometric analysis was limited to
residents in India, and further studies may also explore the suitability of the scale in other countries with
signi cant Tamil-speaking populations, including Sri Lanka, Malaysia, and Singapore. Lastly, in order to
reduce response burden for participants, the present study did not collect measures of stress and anxiety
as a test of construct validity. However, this was deemed redundant given that the correlations between
relevant constructs and the FCV-19S have been demonstrated repeatedly and consistently for a number
of language versions (Ahorsu et al. 2020; Alyami et al. 2020; Huarcaya-Victoria et al. 2020; Perz et al.
2020; Satici et al. 2020; Soraci et al. 2020; Tsipropoulou et al. 2020).
Declarations
Con ict of Interest
Page 8/13The authors declare that they have no con ict of interest.
Ethical approval
All procedures followed were in accordance with the ethical standards of the responsible committee on
human experimentation (institutional and national) and with the Helsinki Declaration.
Informed Consent
All participants provided electronic informed consent.
Funding
No funding was sought.
References
Ahorsu, D. K., Lin, C.-Y., Imani, V., Saffari, M., Gri ths, M. D., & Pakpour, A. H. (2020). The Fear of COVID-19
Scale: Development and initial validation. International Journal of Mental Health and Addiction.
https://doi.org/10.1007/s11469-020-00270-8
Alyami, M., Al-Sharef, A., Al-Aseri, M., & Henning, M. (2019). Mammography self-e cacy scale and breast
cancer fear scale: Psychometric properties of the Arabic versions among Saudi women. Cancer Nursing.
https://doi.org/10.1097/NCC.0000000000000767
Alyami, M., Henning, M., Krägeloh, C. U., & Alyami, H. (2020). Psychometric evaluation of the Arabic
version of the Fear of COVID-19 Scale. International Journal of Mental Health and Addiction.
https://doi.org/10.1007/s11469-020-00316-x
Andrich, D., Sheridan, B., & Luo, G. (2009). RUMM 2030. Perth, Australia: RUMM Laboratory.
Bitan, D. T., Grossman-Giron, A., Bloch, Y., Mayer, Y., Shiffman, N., & Mendlovic, S. (2020). Fear of COVID-
19 scale: Psychometric characteristics, reliability and validity in the Israeli population. Psychiatry
Research, 289, 113100. https://doi.org/10.1016/j.psychres.2020.113100
Bukhari, E. E., Temsah, M. H., Aleyadhy, A. A., Alrabiaa, A. A., Alhboob, A. A., Jamal, A. A., & Binsaeed, A. A.
(2016). Middle East respiratory syndrome coronavirus (MERS-CoV) outbreak perceptions of risk and
stress evaluation in nurses. Journal of Infection in Developing Countries, 10(8), 845–850.
https://doi.org/10.3855/jidc.6925
Byrne, B. M., & Campbell, T. L. (1999). Cross-cultural comparisons and the presumption of equivalent
measurement and theoretical structure: A look beneath the surface. Journal of Cross-Cultural Psychology,
30(5), 555–574. https://doi.org/10.1177/0022022199030005001
DeVellis, R. F. (2016). Scale development: Theory and applications. SAGE.
Page 9/13Doshi, D., Karunakar, P., Sukhabogi, J. R., Prasanna, J. S., & Mahajan, S. V. (2020). Assessing Coronavirus
Fear in Indian Population Using the Fear of COVID-19 Scale. International Journal of Mental Health and
Addiction. https://doi.org/10.1007/s11469-020-00332-x
Ferketich, S. (1991). Focus on psychometrics. Aspects of item analysis. Research in Nursing & Health,
14(2), 165–168. https://doi.org/10.1002/nur.4770140211
Galea, S., Merchant, R. M., & Lurie, N. (2020). The mental health consequences of COVID-19 and physical
distancing: The need for prevention and early intervention. JAMA Internal Medicine.
https://doi.org/10.1001/jamainternmed.2020.1562
Gritsenko, V., Skugarevsky, O., Konstantinov, V., Khamenka, N., Marinova, T., Reznik, A., & Isralowitz, R.
(2020). COVID 19 Fear, Stress, Anxiety, and Substance Use Among Russian and Belarusian University
Students. International Journal of Mental Health and Addiction. https://doi.org/10.1007/s11469-020-
00330-z
Harper, C. A., Satchell, L. P., Fido, D., & Latzman, R. D. (2020). Functional Fear Predicts Public Health
Compliance in the COVID-19 Pandemic. International Journal of Mental Health and Addiction.
https://doi.org/10.1007/s11469-020-00281-5
Henning, M., Alyami, M., Melyani, Z., Alyami, H., & Al Mansour, A. (2020). Development of the Cross-
Cultural Academic Integrity Questionnaire—Version 3 (CCAIQ-3). Journal of Academic Ethics, 18(1), 35–
53. https://doi.org/10.1007/s10805-019-09350-4
Huarcaya-Victoria, J., Villarreal-Zegarra, D., Podestà, A., Luna-Cuadros, M. A. (2020). Psychometric
properties of a Spanish version of the Fear of COVID-19 Scale in general population of Lima, Peru.
International Journal of Mental Health and Addiction. https://doi.org/10.1007/s11469-020-00354-5
Johns Hopkins University & Medicine. (2020). Johns Hopkins Coronavirus Resource Center.
https://coronavirus.jhu.edu/map.html
Knipe, D., Evans, H., Marchant, A., Gunnell, D., & John, A. (2020). Mapping population mental health
concerns related to COVID-19 and the consequences of physical distancing: A Google trends analysis.
Wellcome Open Research, 5, 82–92. https://doi.org/10.12688/wellcomeopenres.15870.1
Krägeloh, C. U., Medvedev, O. N., Hill, E. M., Webster, C. S., Booth, R. J., & Henning, M. A. (2019). Improving
measurement of trait competitiveness: a Rasch analysis of the Revised Competitiveness Index with
samples from New Zealand and US university students. Psychological Reports, 122(2), 689-708.
https://doi.org/10.1177/0033294118762548
Linacre, J. M. (1994). Sample size and item calibration stability. Rasch Measurement Transactions, 7(4),
328.
Page 10/13Lu, W., Wang, H., Lin, Y., & Li, L. (2020). Psychological status of medical workforce during the COVID-19
pandemic: A cross-sectional study. Psychiatry Research, 288, 112936.
https://doi.org/10.1016/j.psychres.2020.112936
National Informatics Centre. (2020). Government of Tamil Nadu. https://www.tn.gov.in/tamilnadustate
Pakpour, A. H., Gri ths, M. D., & Lin, C.-Y. (2020). Assessing the psychological response to the COVID-19:
a response to Bitan et al. "Fear of COVID-19 scale: Psychometric characteristics, reliability and validity in
the Israeli population". Psychiatry Research, 290, 113127.
https://doi.org/10.1016/j.psychres.2020.113127
Perz, C. A., Lang, B. A., & Harrington, R. (2020). Validation of the Fear of COVID-19 Scale in a US college
sample. International Journal of Mental Health and Addiction. https://doi.org/10.1007/s11469-020-
00356-3
Rajkumar, R. P. (2020). COVID-19 and mental health: A review of the existing literature. Asian Journal of
Psychiatry, 52, 102066. https://doi.org/10.1016/j.ajp.2020.102066
Reynolds, D. L., Garay, J. R., Deamond, S. L., Moran, M. K., Gold, W., & Styra, R. (2008). Understanding,
compliance and psychological impact of the SARS quarantine experience. Epidemiology & Infection,
136(7), 997–1007. https://doi.org/10.1017/S0950268807009156
Reznik, A., Gritsenko, V., Konstantinov, V., Khamenka, N., & Isralowitz, R. (2020). COVID-19 fear in Eastern
Europe: validation of the Fear of COVID-19 Scale. International Journal of Mental Health and Addiction.
https://doi.org/10.1007/s11469-020-00283-3
Sakib, N., Mamun, M. A., Bhuiyan, A. I., Hossain, S., Al Mamun, F., Hosen, I., Abdullah, A. H., Sarker, A.,
Mohiuddin, M. S., Rayhan, I., Hossain, M., Sikder, T., Gozal, D., Muhit, M. A., Islam, S. M. S., Gri ths, M. D.,
& Pakpour, A. H. (2020). Psychometric validation of the Bangla Fear of COVID-19 Scale: Con rmatory
factor analysis and Rasch analysis. International Journal of Mental Health and Addiction.
https://doi.org/10.1007/s11469-020-00289-x
Satici, B., Gocet-Tekin, E., Deniz, M. E., & Satici, S. A. (2020). Adaptation of the Fear of COVID-19 Scale: Its
association with psychological distress and life satisfaction in Turkey. International Journal of Mental
Health and Addiction. https://doi.org/10.1007/s11469-020-00294-0
Smith, E. V. (2002). Detecting and evaluation the impact of multidimensionality using item t statistics
and principal component analysis of residuals. Journal of Applied Measurement, 3(2), 205–231.
Soraci, P., Ferrari, A., Abbiati, F. A., Del Fante, E., De Pace, R., Urso, A., & Gri ths, M. D. (2020). Validation
and psychometric evaluation of the Italian version of the Fear of COVID-19 Scale. International Journal of
Mental Health and Addiction. https://doi.org/10.1007/s11469-020-00277-1
Page 11/13Tennant, A., & Conaghan, P. G. (2007). The Rasch measurement model in rheumatology: What is it and
why use it? When should it be applied, and what should one look for in a Rasch paper? Arthritis &
Rheumatism, 57(8), 1358–1362. http://dx.doi.org/10.1002/art.23108
Tsipropoulou, V., Nikopoulou, V. A., Holeva, V., Nasika, Z., Diakogiannis, I., Sakka, S., Kostikidou, S.,
Varvara, C., Spyridopoulou, E., & Parlapani, E. (2020). Psychometric properties of the Greek version of
FCV-19S. International Journal of Mental Health and Addiction. https://doi.org/10.1007/s11469-020-
00319-8
Willse, J. T. (2017). Polytomous Rasch models in counseling assessment. Measurement and Evaluation
in Counseling and Development, 50(4), 248–255. http://dx.doi.org/10.1080/07481756.2017.1362656
Winter, T., Riordan, B. C., Pakpour, A. H., Gri ths, M. D., Mason, A., Poulgrain, J. W., & Scarf, D. (2020).
Evaluation of the English Version of the Fear of COVID-19 Scale and its relationship with behavior change
and political beliefs. International Journal of Mental Health and Addiction.
https://doi.org/10.1007/s11469-020-00342-9
Worldometer. (2020). Countries where Coronavirus has spread.
https://www.worldometers.info/coronavirus/countries-where-coronavirus-has-spread/
Zolotov, Y., Reznik, A., Bender, S., & Isralowitz, R. (2020). COVID-19 fear, mental health, and substance use
among Israeli university students. International Journal of Mental Health and Addiction.
https://doi.org/10.1007/s11469-020-00351-8
Figures
Page 12/13Figure 1
Person-item distribution for the Tamil version of the FCV-19S.
Page 13/13You can also read