TauSTED: pushing STED beyond its limits with lifetime - Nature
←
→
Page content transcription
If your browser does not render page correctly, please read the page content below
ADVERTISING FEATURE
APPLICATION NOTE
TauSTED: pushing STED beyond its limits with lifetime
The new TauSTED technology from Leica Microsystems sets the new standard for straightforward,
gentle STED using lifetime-based information. TauSTED combines the optical signals from STED and
the physical information from fluorescence lifetime at confocal speeds. This approach uses phasor
analysis in a novel way, delivering outstanding STED resolution and image quality while removing
background noise, even at low excitation and STED powers. This newfound flexibility opens new
avenues for super-resolution applications in live specimens.
Stimulated emission depletion (STED) is one of the super-resolution Conventional STED approaches have been challenging to adapt
techniques that have revolutionized fluorescence imaging, promoting a to dynamic processes in live cells, mainly because of the light dose
better understanding of the spatial distribution and relationships of cellular plus the photon budget and signal-to-noise ratio needed to attain
components and processes1. To realize STED in two dimensions, the such high resolutions1. These limitations are particularly relevant
diffraction-limited point spread function (PSF) is reduced to a subdiffraction- when the only available information is the fluorescence intensity
sized PSF by overlaying a donut-shaped laser beam (“STED beam”) signal versus the spatial coordinate. Pioneering work explored the
onto the excitation beam. STED provides a de-excitation path for the use of fluorescence lifetime to gain information and enhance STED
fluorophores to return to the ground state via stimulated emission (Fig. 1a), performance. This aspect of STED microscopy sparked the concepts
confining the volume from which fluorescence is observed up to a few tens behind gated STED, SPLIT and phasor-STED2–5. The STED process
of nanometers. This concept has also been extended to three dimensions. competes with the fluorescence emission, lowering the fluorescence
a d g
e
b
f
c
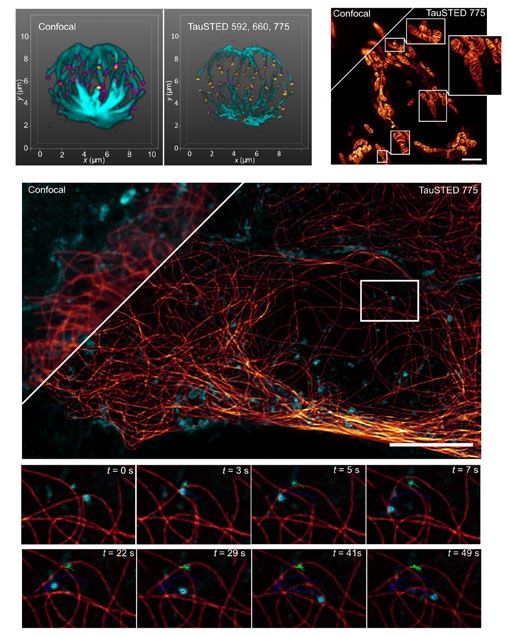
Figure 1 | Basic concepts of TauSTED. a, Jablonski–Perrin diagram: fluorescence process, fluorophore excitation (blue), photon emission (red), and competing
processes (STED, red dashed arrow; non-radiative processes, dotted arrow). (1, 2): observed rates for fluorescence process with and without STED. t, lifetime; kr, knr and
kSTED, rates of radiative, non-radiative and STED de-excitation, respectively. b, Radial line profile of excitation and STED energies, and related gradient. c, Simulated
PSFs with intensity and lifetime-derived information, for CW STED and pulsed STED lasers (650 ps pulse). d, TauSTED acquisition pipeline. e, Temporal dynamics of
fluorescence and STED process as lifetime decay curves and relationship to scanning spot geometry. Orange arrow, temporal position for a single gate-out approach;
photons to the left are lost. f, TauSTED phasor. STED trajectory and additional signals from the image. g, Live-cell TauSTED in U2OS cells. Stains for actin (SiR-actin,
glowscale), microtubules (SPY555-tubulin, cyan) and membranes (WGA-488, green). Scale bar, 2 µm. SiR and SPY probes available from Spirochrome.
Luis A. J. Alvarez, Ulf Schwarz, Lars Friedrich, Jonas Foelling, lifetime-derived readouts as the applied STED energy increases
Frank Hecht and M. Julia Roberti† (Fig. 1, equations (1) and (2)). As a result, a lifetime gradient is generated
on the effective PSF that follows the energy gradient of the STED beam
Leica Microsystems CMS GmbH, Mannheim, Germany.
†e-mail: julia.roberti@leica-microsystems.com geometry (Fig. 1b). Simulated data for lifetime-coded PSFs illustrate
NATURE METHODS | JUNE 2021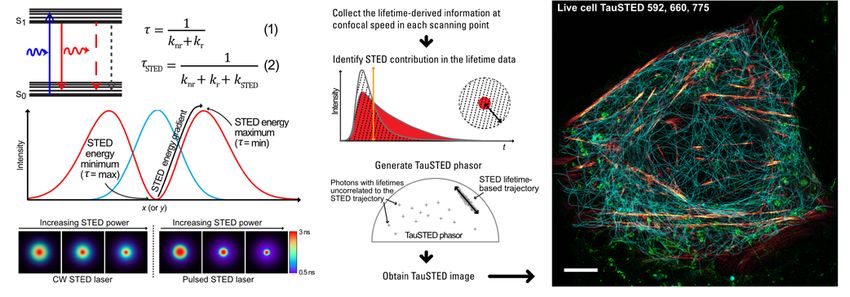
ADVERTISING FEATURE
 APPLICATION NOTE

this point for any scheme of STED depletion (continuous wave or              signatures that are not correlated to the STED trajectory are most
pulsed) and at increasing STED powers (Fig. 1c). This information is in      likely generated by noise and background, and these are precisely
principle available at every scanning point in a STED experiment (Fig.       the signals that are removed (Fig. 2a). TauBackground Suppression can
1d). The simplest approach to exploit this extra layer of information,       be activated and deactivated, providing a tool to evaluate its effect on
gated STED, relies on a single time gate that excludes photons with          the TauSTED image.
early arrival times (Fig. 1e, cross-hatched region) that contribute low-
resolution signal2,3. The overall resolution increases, but the signal        a                                            b
from the photons that are excluded is lost. This temporal window
(Fig. 1e, left of the orange arrow) still contains significant signal from
the center of the donut, and omitting this information leads to lower
signal-to-noise ratios than those observed for less-resolved, non-
gated images. Therefore, it would be advantageous to preserve these           c
photons. This can be achieved with the more advanced lifetime-based
approaches mentioned above, but they require a deep knowledge of
both nanoscopy and fluorescence lifetime imaging microscopy (FLIM),
making their widespread adoption difficult4,5. Leveraging our fast FLIM
and lifetime-based technologies6,7, we have developed TauSTED
(Fig. 1d–h), a new approach to STED super-resolution to deliver high          d                                            e
quality, multicolor STED in two and three dimensions, compatible at
the same time with live-cell imaging of highly dynamic processes.
TauSTED combines the optical signals from STED with the physical
information from the fluorescence lifetime acquired at typical confocal
speeds. Our approach uses phasor analysis8 in a novel way and works           f
in an automated manner, enabling increased STED resolution and
elimination of uncorrelated background noise even at low excitation
and STED light dose.
  For TauSTED, we first must describe the STED process in the lifetime
dimension. We determine the two characteristic limits of the operative
range of STED: the maximum energy delivered by STED sets the
shortest lifetime in the sample while the minimum STED energy (at the         Figure 2 | TauSTED operating principles. a, TauBackground Suppression
                                                                              on a TauSTED image of tubulin (560nm-excitable fluorophore; see Fig. 3a).
center of the donut) marks the longest lifetime, where fluorophores           Scale bar, 2 μm. b–e, TauSTED 775 of GATTA-Beads R (nominal size 23 nm) at
undergo the least fluorescence lifetime change (Fig. 1b). These two           increasing STED dose (% of available STED power). b, Diameter estimation
                                                                              with a Lorentzian function fitting each particle. nparticles > 500 per condition. c,
values, mapped into a phasor plot, define a STED trajectory that will         Distribution of nanoparticle diameters in the series. d, Representative images
contain all the photons emanating from the STED process (Fig. 1f).            for data used in c. All images are adjusted to the same look-up table (0–100
                                                                              photon counts). Scale bars, 200 nm. e, Effect of TauStrength on the diameter
Building the STED trajectory is far from trivial, especially because of       estimation at STED 100%. f, Time series on cells immunostained for basket
the limited photon budget associated with STED measurements. We               proteins of nuclear pores (point-like structures) imaged at low excitation and
                                                                              STED light dose. 85% of the signal is preserved after 100 frames of continuous
have automated this step in TauSTED by leveraging a newly published           STED imaging, with ~80 nm FWHM for individual pores. Scale bar, 2 μm.
approach with a complex wavelet filter. This approach improves the
determination of the fluorescence lifetime behavior on the phasor
plot8, preserving the fine structures in the image even at very low            In TauStrength, the intensity values of the image are weighted on
photon budget9. The result of this automation is a TauSTED phasor            the basis of their positions with respect to the limits of the TauSTED
with two parameters: TauBackground Suppression, which removes                trajectory. This weighting determines a range of values that correspond
background from the physical readout of lifetime contributions               to a default scale and the resolution that can be achieved with it. The
uncorrelated to the STED process, and TauStrength, which improves            so-called TauStrength parameter can take any of those values. The
resolution from the lifetime-derived gradient of the STED trajectory         scale can then be further tuned to push resolution along the resulting
mapped on the plot. A unique aspect of this approach is that the             readout of the lifetime gradient, following the rules of phasors8. Here,
only information needed comes from the STED experiment itself; no            as TauStrength values increase, the longer lifetime-containing signals
additional confocal readout is required.                                     are given more weight than the shorter ones. The limit to the achievable
  In TauBackground Suppression, the two-dimensional distribution of          resolution is set by the photon budget and signal-to-noise ratio.
the lifetime fingerprints on the phasor space makes it straightforward         To illustrate how TauSTED works, we imaged a commercially
to assess any signal contributions that do not emanate from the              available fluorescent bead sample (GATTA-Beads R, nominal diameter
STED process (Fig. 1f). The photon signals with fluorescence lifetime        23 nm), increasing the STED light dose and keeping the excitation

NATURE METHODS | JUNE 2021
ADVERTISING FEATURE
                                                                                                                                   APPLICATION NOTE

light dose constant. The sampling conditions (4k image format, 7 nm                   pores central region size of 80 nm (from full width at half maximum
pixel size) and the beads density in the sample ensured a statistically               (FWHM) measurements on individual structures). This means that we
significant assessment of the TauSTED performance (nparticles > 500 for               can protect the sample for extended periods to achieve longer time-
each image; Fig. 2b–d). The results showed the expected decrease in                   lapse sessions and larger volumes.
the estimated diameter of the nanoparticles at increasing STED light                       TauSTED enables straightforward access to high fidelity, multicolor
dose, using the default settings for TauSTED (Fig. 2b). Once we have                  super-resolution imaging of live and fixed specimens (Figs. 1h and 3).
reached the optical limits, we can further push the resolution with                   We characterized the three-dimensional organization of the mitotic
TauStrength (Fig. 2e), where we estimate an average diameter for the                  spindle (Fig. 3a) together with the distribution of CENP-C and BUB1,
GATTA-Beads R of (27.9 ± 2.1) nm.                                                     two key proteins required for kinetochore assembly10, using TauSTED
    The ability of TauSTED to increase the resolution at a given                      with multiple STED lines (592, 660 and 775 nm). We also achieved
STED light dose enables gentle excitation and STED regimes while                      high resolution while examining delicate cristae in live mitochondria
delivering high STED quality and resolution. We show this by                          in HeLa cells11 (Fig. 3b). The access to TauSTED with low photon
performing continuous TauSTED imaging of a sample of Cos7 cells                       budgets and the fast detection scheme in our confocal platform12
immunostained for proteins forming the nuclear pore basket (Fig. 2f)                  enable the tracking of highly dynamic processes in live cells. As
at extremely low STED light dose (5%). The labeling at the central                    an example, we can follow the dynamics of the cytoskeleton and
region of the pores gives point-like structures as a result. The total                membrane vesicles (Fig. 3c).
intensity trace over time shows that 85% of the fluorescence intensity                     TauSTED is the fusion of nanoscopy and lifetime, bringing excellent
remains after 100 consecutive images, with an estimated nuclear                       resolution, image quality and flexibility in a diversity of samples and
                                                                                      experimental designs. STED benefits from gentle illumination for
a                                                   b                                 extended imaging of delicate specimens (more frames) or of larger
                                                                                      volumes (more planes) without sacrificing resolution. The sample
                                                                                      is protected by milder illumination regimes, particularly suited for
                                                                                      sensitive fluorophores and for studies of cellular dynamics that require
                                                                                      high imaging speeds. The outstanding performance of TauSTED at
                                                                                      low light dose is key to rendering dynamic, live-cell super-resolution
                                                                                      microscopy straightforward and accessible for researchers.
c
                                                                                      REFERENCES
                                                                                      1.    Hell, S. W. & Wichmann, J. Breaking the diffraction resolution limit by stimulated
                                                                                            emission: stimulated-emission-depletion fluorescence microscopy. Opt. Lett.
                                                                                            19, 780–782 (1994).
                                                                                      2.    Vicidomini, G. et al. Sharper low-power STED nanoscopy by time gating. Nat.
                                                                                            Methods 8, 571–573 (2011).
                                                                                      3.    Moffitt, J. R., Osseforth, C. & Michaelis, J. Time-gating improves the spatial
                                                                                            resolution of STED microscopy. Opt. Express 19, 4242–4254 (2011).
                                                                                      4.    Lanzanò, L. et al. Encoding and decoding spatio-temporal information for
                                                                                            super-resolution microscopy. Nat. Commun. 6, 6701 (2015).
                                                                                      5.    Wang, L. et al. Resolution improvement in STED super-resolution microscopy at
                                                                                            low power using a phasor plot approach. Nanoscale 10, 16252–16260 (2018).
                                                                                      6.    Alvarez, L. A. J. et al. Application Note: SP8 FALCON: a novel concept in
                                                                                            fluorescence lifetime imaging enabling video-rate confocal FLIM. Nat. Methods
                                                                                            https://www.nature.com/articles/d42473-019-00261-x (2019).
                                                                                      7.    Roberti, M. J. et al. Application Note: TauSense: a fluorescence lifetime-based
                                                                                            tool set for everyday imaging. Nat. Methods https://www.nature.com/articles/
                                                                                            d42473-020-00364-w (2020).
                                                                                      8.    Digman, M. A., Caiolfa, V. R., Zamai, M. & Gratton, E. The phasor approach to
                                                                                            fluorescence lifetime imaging analysis. Biophys. J. 94, L14–L16 (2008).
                                                                                      9.    Wang, P. et al. Complex wavelet filter improves FLIM phasors for photon
                                                                                            starved imaging experiments. Biomed. Optics Express https://doi.org/10.1364/
                                                                                            BOE.420953 (2021).
                                                                                      10.   Sacristan, C. et al. Dynamic kinetochore size regulation promotes microtubule
 Figure 3 | TauSTED for biological applications. a, Three-color TauSTED                     capture and chromosome biorientation in mitosis. Nat. Cell Biol. 20, 800–810
 660, 592 and 775 on mitotic cells immunostained for tubulin (cyan; 560-nm                  (2018).
 excitation), CENP-C (yellow; 488-nm excitation) and BUB1 (magenta; 647-              11.   Stephan, T., Roesch, A., Riedel, D. & Jakobs, S. Live-cell STED nanoscopy of
 nm excitation). Sample courtesy Carlos Sacristan Lopez, Hubrecht Institute,                mitochondrial cristae. Sci. Rep. 9, 12419 (2019).
 Utrecht10. 3D movie at https://www.leica-microsystems.com/tausted-                   12.   Schweikhard, V. et al. Application Note: The Power HyD family of detectors. Nat.
 mitoticcell3d/. b, Live-cell TauSTED with STED at 775 nm: HeLa cells stably                Methods https://www.nature.com/articles/d42473-020-00398-0 (2020).
 expressing COX8A-SNAP labeled with SiR-BG. Sample courtesy T. Dellmann and           13.   Tinevez, J. Y. et al. TrackMate: an open and extensible platform for single-
 A. Garcia, CECAD, Köln. Cell line originally from S. Jakobs11. Scale bar, 2 µm. c,         particle tracking. Methods 115, 80–90 (2017).
 Two-color live-cell low power TauSTED; cytoskeleton (SPY-620 tubulin, glow)
 and vesicles (WGA-594, cyan). Scale bar, 5 µm. Fast dynamics captured at 1
 frame/s. Montage shows a selection of time points from the inset; TrackMate Fiji
 plugin13 traces three individual vesicles (red, green and blue). Movie at https://   This article was submitted to Nature Methods by a commercial organization
 www.leica-microsystems.com/tausted-cell-dynamics/.                                   and has not been peer reviewed. Nature Methods takes no responsibility for
                                                                                      the accuracy or otherwise of the information provided.

                                                                                                                                             NATURE METHODS | JUNE 2021
You can also read