Terrestrial Ecoregions of the World: A New Map of Life on Earth
←
→
Page content transcription
If your browser does not render page correctly, please read the page content below
Articles

Terrestrial Ecoregions of
the World: A New Map of
Life on Earth
DAVID M. OLSON, ERIC DINERSTEIN, ERIC D. WIKRAMANAYAKE, NEIL D. BURGESS, GEORGE V. N. POWELL,
EMMA C. UNDERWOOD, JENNIFER A. D’AMICO, ILLANGA ITOUA, HOLLY E. STRAND, JOHN C. MORRISON, COLBY
J. LOUCKS, THOMAS F. ALLNUTT, TAYLOR H. RICKETTS, YUMIKO KURA, JOHN F. LAMOREUX, WESLEY W.
WETTENGEL, PRASHANT HEDAO, AND KENNETH R. KASSEM

T    he tapestry of life on Earth is unraveling as humans
     increasingly dominate and transform natural ecosys-
tems. Scarce resources and dwindling time force conserva-
                                                                         A NEW GLOBAL MAP OF TERRESTRIAL
tionists to target their actions to stem the loss of biodiversity—       ECOREGIONS PROVIDES AN INNOVATIVE
a pragmatic approach, given the highly uneven distribution
                                                                         TOOL FOR CONSERVING BIODIVERSITY
of species and threats (Soulé and Kohm 1989, Olson and
Dinerstein 1998, Mace et al. 2000, Myers et al. 2000). Unfor-
tunately, the ability to focus strategically is hindered by the ab-
sence of a global biodiversity map with sufficient biogeo-               Although our ecoregions are intended primarily as units
graphic resolution to accurately reflect the complex                  for conservation action, they are built on the foundations of
distribution of the Earth’s natural communities. Without              classical biogeography and reflect extensive collaboration
such a map, many distinctive biotas remain unrecognized. In           with over 1000 biogeographers, taxonomists, conservation bi-
this article, we address the disparity in resolution between          ologists, and ecologists from around the world. Consequently,
maps currently available for global conservation planning             ecoregions are likely to reflect the distribution of species and
and the reality of the Earth’s intricate patterns of life. We         communities more accurately than do units based on global
have developed a detailed map of the terrestrial ecoregions of        and regional models derived from gross biophysical features,
the world that is better suited to identify areas of outstand-        such as rainfall and temperature (Holdridge 1967, Walter
ing biodiversity and representative communities (Noss 1992).          and Box 1976, Schulz 1995, Bailey 1998), vegetation structure
We define ecoregions as relatively large units of land containing     (UNESCO 1969, deLaubenfels 1975, Schmidthüsen 1976), or
a distinct assemblage of natural communities and species, with
boundaries that approximate the original extent of natural            David Olson (e-mail david.olson@wwfus.org), Eric Dinerstein, Eric Wikra-
communities prior to major land-use change.                           manayake, Neil Burgess, George Powell, Jennifer D’Amico, Holly
   Our ecoregion map offers features that enhance its utility         Strand, John Morrison, Colby Loucks, Thomas Allnutt, John Lamoreux,
for conservation planning at global and regional scales: com-         Wesley Wettengel, and Kenneth Kassem are conservation scientists
prehensive coverage, a classification framework that builds on        in the Conservation Science Program at World Wildlife Fund–US, Wash-
existing biogeographic knowledge, and a detailed level of             ington, DC 20037. Emma Underwood is a doctoral candidate in the
biogeographic resolution. Ecoregions reflect the distribu-            Graduate Group in Ecology, Information Center for the Environment,
tions of a broad range of fauna and flora across the entire           University of California, Davis, CA 95616. Illanga Itoua is a conser-
planet, from the vast Sahara Desert to the diminutive Clip-           vation biologist, 78230 Le Pecq, France. Taylor Ricketts is a post-
perton Island (eastern Pacific Ocean). They are classified            doctoral researcher at the Center for Conservation Biology, Depart-
within a system familiar to all biologists—biogeographic              ment of Biological Sciences, Stanford University, Palo Alto, CA
realms and biomes. Ecoregions, representing distinct biotas           94305. Yumiko Kura is a conservation specialist with the World Re-
(Dasmann 1973, 1974, Udvardy 1975), are nested within the             sources Institute, Washington, DC 20002. Prashant Hedao is a
biomes and realms and, together, these provide a framework            conservation GIS specialist with Environmental Systems Research
for comparisons among units and the identification of rep-            Institute, Inc., Redlands, CA 92373. © 2001 American Institute of
resentative habitats and species assemblages.                         Biological Sciences

                                                                                     November 2001 / Vol. 51 No. 11 • BioScience 933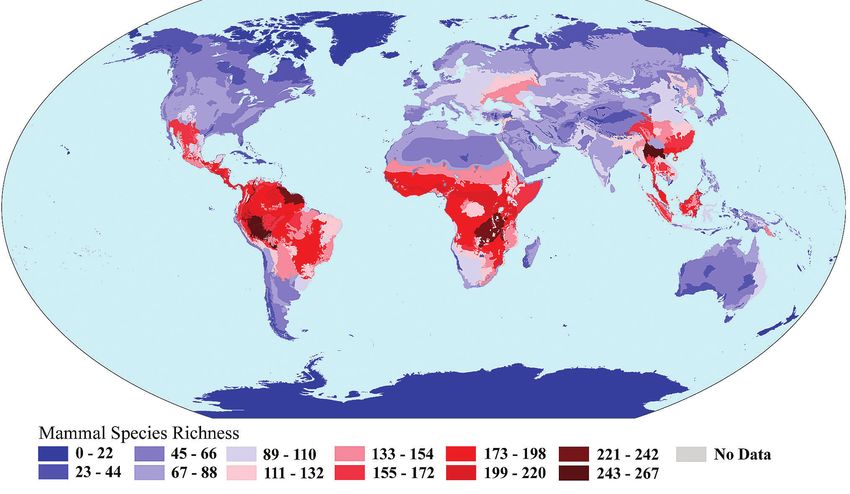
Articles
spectral signatures from remote-sensing data (Defries et al. with 463 found in the ecoregion map. Biodiversity assessments
1995, Loveland and Belward 1997). None of these other ap- that employ large biotic provinces or hotspots often fail to dis-
proaches emphasizes the importance of endemic genera and cern smaller but highly distinctive areas, which may result in
families (higher taxa), distinct assemblages of species, or the these areas receiving insufficient conservation attention. The
imprint of geological history, such as the strong influence of island of New Guinea is illustrative. Dasmann and Udvardy
past glaciations or Pleistocene land bridges, on the distribu- treat the island as a single unit, whereas the new terrestrial map
tion of plants and animals. distinguishes 12 ecoregions: four lowland and four montane
Existing maps of global biodiversity have been ineffective broadleaf forests, one alpine scrub ecoregion along the cen-
planning tools because they divide the Earth into extremely tral cordillera, a mangrove forest, a freshwater swamp forest,
coarse biodiversity units. These units are typically well beyond and a savanna–grassland, all with distinct biotas and ecolog-
the size of landscapes tractable for designing networks of ical conditions.
conservation areas, the largest of protected areas, or the
50,000 km2 threshold for restricted-range species (Stattersfield The delineation of ecoregions
et al. 1998) that are of particular concern (Stuart Pimm We began by accepting the biogeographic realms of Pielou
[Center for Environmental Research and Conservation, Co- (1979) and Udvardy (1975) and modifying the biome systems
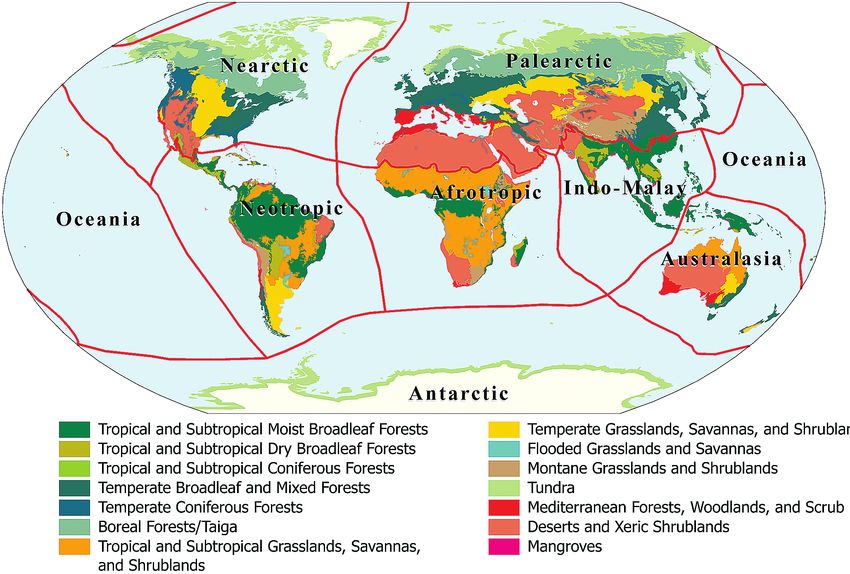
lumbia University, NY], personal communication, 2000). of Dinerstein et al. (1995) and Ricketts et al. (1999) (Figure
The average size of our ecoregions is roughly 150,000 km2 1). We then consulted existing global maps of floristic or
(median 56,300 km2), whereas the biotic provinces of Udvardy zoogeographic provinces (e.g., Rübel 1930, Gleason and
(1975) have an approximate mean of 740,000 km2 (median Cronquist 1964, Good 1964), global and regional maps of
306,000 km2) and the biodiversity hotspots of Myers et al. units based on the distribution of selected groups of plants
(2000), which represent threatened regions with high con- and animals (e.g., Hagmeier 1966), the world’s biotic province
centrations of endemic species, have an approximate mean maps (Dasmann 1973, 1974, Udvardy 1975), and global maps
of 787,760 km2 (median 324,000 km2). of broad vegetation types (e.g., UNESCO 1969, deLaubenfels
We subdivided the terrestrial world into 14 biomes and 1975, Schmidthüsen 1976). These were useful for evaluating
eight biogeographic realms (Figure 1). Nested within these are the extent of realms and biomes, the first two tiers in our hi-
867 ecoregions (Figure 2). This is roughly a fourfold increase erarchical classification. We then identified published re-
in resolution over that of the 198 biotic provinces of Dasmann gional classification systems to be used as a baseline for ecore-
(1974) and the 193 units of Udvardy (1975). The increased gion boundaries. Data and consultations from regional experts
resolution is most apparent in the tropics (between the Trop- were also important for final ecoregion delineations.
ics of Cancer and Capricorn) where Dasmann (1974) and Ud- The use of widely recognized biogeographic maps as a
vardy (1975) identify 115 and 117 units, respectively, compared basis for ecoregions enhances the utility of the map as a plan-
ning tool in different regions.
For example, White’s (1983)
phytogeographic regions serve
as the basis for the ecoregions
of the Afrotropics. The Aus-
tralian ecoregions are derived
from Thackway and Cresswell’s
(1995) biogeographic region-
alization. Nearctic ecoregions
are adapted from the ecoregion
systems of Omernik (1995),
Gallant et al. (1995), Wiken et
al. (1989), and Rzedowski
(1978). A more diverse set of
sources was used for the
Neotropics, including habitat
classifications for Brazil from
the Instituto Brasilero de Ge-
ografia Estatística (IBGE 1993),
the vegetation maps of Huber
and Alarcon (1988) and Hu-
ber et al. (1995) for Venezuela
and Guyana, and Holdridge’s
Figure 1. The ecoregions are categorized within 14 biomes and eight biogeographic realms (1977) life zones for Central
to facilitate representation analyses. America. The western Palearc-
934 BioScience • November 2001 / Vol. 51 No. 11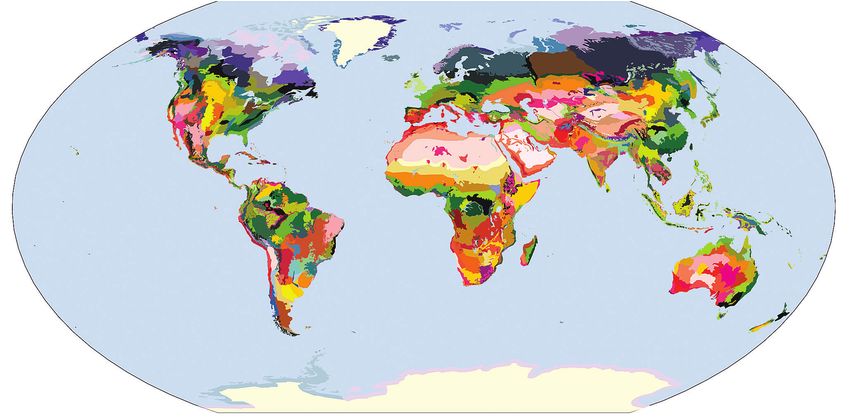
Articles

                                                                                                     scrutiny to discern the influ-
                                                                                                     ence of historic events on
                                                                                                     present-day distributions. For
                                                                                                     example, the effects of changes
                                                                                                     in sea level and land bridges in
                                                                                                     the Philippines archipelago
                                                                                                     during the Pleistocene have re-
                                                                                                     sulted in several island ecore-
                                                                                                     gions in close proximity har-
                                                                                                     boring many unique taxa
                                                                                                     (Heaney 1986, 1991). Delin-
                                                                                                     eation of ecoregions varied
                                                                                                     slightly in boreal and polar
                                                                                                     habitats, where species assem-
                                                                                                     blages are relatively homoge-
                                                                                                     neous across large regions.
Figure 2. The map of terrestrial ecoregions of the world recognizes 867 distinct units,              Thus, dynamics and processes
roughly a fourfold increase in biogeographic discrimination over that of the 193 units of            were emphasized, such as ma-
Udvardy (1975). Maps of freshwater and marine ecoregions are similarly needed for                    jor variations in climate, fire
conservation planning.                                                                               disturbance regimes, and large
                                                                                                     vertebrate migrations (Ricketts
tic ecoregions (except Africa) were developed in concert with                                        et al. 1999).
the DMEER (2000) project. The ecoregions of Russia are                 Three caveats are appropriate for all biogeographic map-
adapted from Kurnaev (1990) and Isachenko and colleagues            ping approaches. First, no single biogeographic framework is
(1988), Japan from Miyawaki (1975), China from the systems          optimal for all taxa. Ecoregions reflect the best compromise
developed by the Chinese Vegetation Map Compilation Com-            for as many taxa as possible. Second, ecoregion boundaries
mittee (1979) and the Changchun Institute of Geography and          rarely form abrupt edges; rather, ecotones and mosaic habi-
Chinese Academy of Sciences (1990), and Southwest Asia              tats bound them. Third, most ecoregions contain habitats that
from Zohary (1973). The major divisions for Indo-Malayan            differ from their assigned biome. For example, rainforest
ecoregions are based on the MacKinnon (1997) units that             ecoregions in Amazonia often contain small edaphic savan-
build upon Dasmann’s and Udvardy’s biotic provinces. A key          nas. More detailed biogeographic analyses should map the less
to the terrestrial ecoregions of the world map (Figure 2), the      dominant habitat types that occur within the larger ecoregions,
sources for ecoregions, technical descriptions, and digital data    and ecoregion conservation strategies should address their re-
are available at the Web site www.worldwildlife.org/science.        quirements.
   Most existing systems required that units be aggregated or
divided, or that boundaries be modified, to achieve three           Ecoregions as a tool for conservation
goals: (1) match recognized biogeographic divisions inade-          How can a map of the world’s ecoregions contribute to con-
quately reflected in that system, (2) achieve a similar level of    serving biodiversity? Our ecoregion map has already been used
biogeographic resolution of units, and (3) match units and          as a biogeographic framework to highlight those areas of the
boundaries in adjacent systems, when necessary. Where widely        world that are most distinctive or have high representation
accepted biogeographic maps were unavailable, we relied             value and are therefore worthy of greater attention (Olson and
first on landforms and second on vegetation to inform the bi-       Dinerstein 1998, Ricketts et al. 1999, Wikramanayake et al.
otic divisions. For example, montane and lowland habitats           2001). Ecoregions were ranked by the distinctiveness of their
support distinct biotic communities and dynamics. These were        biodiversity features—species endemism, the rarity of higher
separated where they occurred over extensive areas. Detailed        taxa, species richness, unusual ecological or evolutionary
vegetation maps were then consulted. Vegetation is an im-           phenomena, and global rarity of their habitat type (e.g.,
portant proxy for both plants and invertebrates, which together     Mediterranean-climate woodlands and scrub and temperate
constitute the vast majority of species. Most invertebrates, and    rainforests). Ecoregions can also be ranked by threats to bio-
to some extent vertebrates, are associated with different plant     diversity, the status of their natural habitats and species, and
communities, particularly where ecoclimatic differences are         degree of protection (Dinerstein et al. 1995, Olson and Din-
strong (e.g., tropical wet forest versus tropical dry forest).      erstein 1998, Ricketts et al. 1999, Wikramanayake et al. 2001).
   The appropriate delineation of ecoregions was obvious in            Using this framework, biologists can examine one of the
many cases. The sand pine scrubs of central Florida, for ex-        most interesting biological problems: the concordance and
ample, support many endemic species and higher taxa, and            mismatches in patterns of richness and endemism for indi-
one can confidently discern the distinctiveness of its biota as     cator taxa, often birds and mammals, used in conservation pri-
well as its geographic extent. Other ecoregions required closer     ority setting (Stattersfield et al. 1998, Fonseca et al. 2000,

                                                                                    November 2001 / Vol. 51 No. 11 • BioScience 935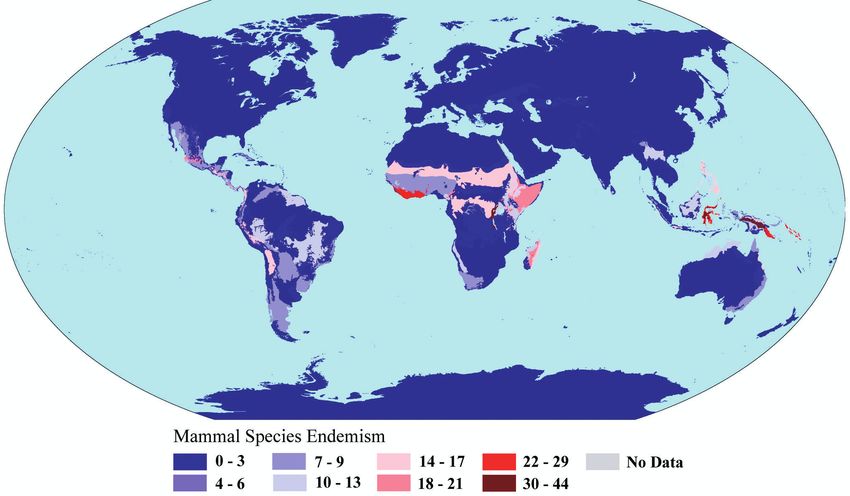
Articles

Mace et al. 2000). As an illus-
tration, patterns of richness and
endemism by ecoregion for the
world’s 4,600+ terrestrial mam-
mal species reveal some major
differences. The three richest
mammal assemblages are in the
northern Indochina subtropi-
cal forests, the southwestern
Amazon moist forests, and the
central Zambezian miombo
woodlands (Figure 3), whereas
the ecoregions with the highest
number of endemic mammals
are the Central Range montane
forests of New Guinea, the Al-
bertine Rift montane forests of
Central Africa, and the Sulawesi
montane forests (Figure 4).
Similar analyses for birds, her- Figure 3. The relative richness of terrestrial mammal species by ecoregion is depicted.
petofauna, and vascular plants Warmer colors denote ecoregions containing richer assemblages.
are under way, to be incorpo-
rated into a database that can be continually improved as new         herbaria are using this base map to frame discussions with log-
data are acquired. This ecoregion–species database will com-          ging companies and wood product retailers about reducing
plement emerging grid-based species datasets by providing in-         the loss of forest biodiversity. It is also being used as a strate-
sights into the biogeographic relationship among cells (Brooks        gic tool to determine conservation investments for the World
et al. 2001).                                                         Bank, the US Agency for International Development, the
   The ecoregion map complements global priority-setting              World Wildlife Fund, the World Resources Institute, The Na-
analyses, such as Global 200 (Olson and Dinerstein 1998) and          ture Conservancy, and several foundations (Dinerstein et al.
Hotspots (Myers et al. 2000), by providing an even finer level        1995, Roca et al. 1997, Olson and Dinerstein 1998).
of resolution to assess biodiversity features. For example, the          Conservation strategies that consider biogeographic units
25 terrestrial hotspots identified by Myers et al. (2000) amal-       at the scale of ecoregions are ideal for protecting a full range
gamate 414 of the 867 ecoregions of the world, and the 237            of representative areas, conserving special elements, and en-
units of Global 200 contain 402 terrestrial ecoregions. On our        suring the persistence of populations and ecological processes,
map, the Indo–Burma hotspot
(Mittermeier et al. 1999, Myers
et al. 2000) covers 37 terrestrial
ecoregions and Global 200’s
eastern Himalayan forests (Ol-
son and Dinerstein 1998) en-
compass four terrestrial ecore-
gions. The rich mosaic of the
map’s ecoregions calls atten-
tion to the importance of global
biodiversity, including those
ecoregions that lie outside the
species-rich tropics.
   New ways of looking at bio-
diversity loss and global
threats—from climate change
to oil exploration, mining, road
development, and logging—
are facilitated by this detailed
map of ecoregions. Currently, a
consortium of conservation or- Figure 4. The level of species endemism for terrestrial mammals shows different patterns
ganizations, museums, and than that of richness. Warmer colors denote ecoregions containing more endemic species.

936 BioScience • November 2001 / Vol. 51 No. 11
Articles

particularly those that require the largest areas or are most sen-   to all public and private schools in the United States to pro-
sitive to anthropogenic alterations (Noss et al. 1999, Soulé and     mote biogeographic literacy and a better understanding of
Terborgh 1999, Groves et al. 2000, Margules and Pressey              global biodiversity. We are indebted to all of the individuals
2000). Some of the most promising tools for designing net-           who helped develop the World Wildlife Fund/National Ge-
works of conservation areas—gap analysis, equal-area grid            ographic Society/Environmental Systems Research Institute,
analyses, complementarity analyses, and other reserve selec-         Inc., educational Web site that uses this map to present pat-
tion algorithms (Kiester et al. 1996, Margules and Pressey 2000,     terns of biodiversity from around the world (www.world-
Williams et al. 1997, 2000)—will be more robust if con-              wildlife.org/wildworld).
ducted within the context of biologically defined units such
as ecoregions, as the distribution of species and communities        References cited
rarely coincides with political units. An ecoregion perspective      Bailey RG. 1998. Ecoregions: The Ecosystem Geography of Oceans and
                                                                         Continents. New York: Springer-Verlag.
can also help identify whether conservation areas are redun-
                                                                     Brooks T, Balmford A, Burgess N, Fjeldså J, Hansen LA, Moore J, Rahbek C,
dant or complementary across political boundaries.                       Williams P. 2001. Toward a blueprint for conservation in Africa. BioScience
    Ecoregions approximate the dynamic arena within which                51: 613–624.
ecological processes most strongly interact (Orians 1993).           Changchun Institute of Geography and Chinese Academy of Sciences. 1990.
This critical component of the ecoregion concept allows us               The Conservation Atlas of China. Beijing (China): Science Press.
                                                                     Chinese Vegetation Map Compilation Committee. 1979. Vegetation Map of
to expand the scope of factors considered in conservation plan-
                                                                         China. Map 1:10,000,000. Beijing (China): Science Press.
ning to include ecological phenomena as well as distributions        Dasmann RF. 1973. A system for defining and classifying natural regions for
of species. Preserving the migrations in East Africa, large              purposes of conservation. Morges (Switzerland): International Union for
predator–prey interactions in the South Asian jungles (Joshi             Conservation of Nature and Natural Resources. IUCN Occasional Paper
et al. 2001), or sufficient forest cover in the Amazon Basin to          no. 7.
maintain rainfall patterns requires conservation efforts across      ———. 1974. Biotic provinces of the world: Further development of a sys-
                                                                         tem for defining and classifying natural regions for purposes of conser-
entire ecoregions.                                                       vation. Morges (Switzerland): International Union for Conservation of
    Fortunately, conducting conservation assessments within              Nature and Natural Resources. IUCN Occasional Paper no. 9.
the framework of larger biogeographic units is an approach           Defries R, Hansen M, Townshend J. 1995. Global discrimination of land cover
that is gaining support in all of the major international con-           types from metrics derived from AVHRR Pathfinder data. Remote Sens-
servation organizations and in many government agencies                  ing of the Environment 54: 209–222.
                                                                     deLaubenfels DJ. 1975. Mapping the World’s Vegetation: Regionalization of
(Groves et al. 2000, Johnson et al. 1999, Mittermeier et al. 1999,       Formations and Flora. Syracuse (NY): Syracuse University Press.
Ricketts et al. 1999). Ecoregion-level strategies are receiving      Dinerstein E, Olson DM, Graham DJ, Webster AL, Primm SA, Bookbinder
increased funding from major conservation donors. This                   MP, Ledec G. 1995. A Conservation Assessment of the Terrestrial Ecore-
growing interest offers encouragement that ecoregion maps                gions of Latin America and the Caribbean. Washington (DC): World Bank.
                                                                     [DMEER] Digital Map of European Ecological Regions Project. 2000. The
and analyses can heighten awareness about the urgency of bio-
                                                                         Digital Map of European Ecological Regions (DMEER). Paris: European
diversity loss and play an important role in conserving the ex-          Union, European Topic Centre on Nature Conservation, Museum d’His-
traordinary variety of life on Earth.                                    toire Naturelle.
                                                                     Fonseca GAB, et al. 2000. Following Africa’s lead in setting priorities. Nature
Acknowledgments                                                          405: 393–394.
                                                                     Gallant AL, Binnian EF, Omernik JM, Shasby MB. 1995. Ecoregions of
We greatly appreciate the thousand-plus regional experts
                                                                         Alaska. Washington (DC): US Government Printing Office. US Geological
who provided invaluable knowledge and assistance in the                  Survey Professional Paper 1567.
development of this map. We appreciate the support of the            Gleason HA, Cronquist A. 1964. The Natural Geography of Plants. New York:
World Bank; the Commission for Environmental Coopera-                    Columbia University Press.
tion; Comisión Nacional Para el Conocimiento y Uso de la             Good R. 1964. The Geography of Flowering Plants. London: Longmans,
                                                                         Green.
Biodiversidad; Instituto Nacional de Estatística, Geografia e
                                                                     Groves C, Valutis L, Vosick D, Neely B, Wheaton K, Touval J, Runnels B. 2000.
Informática; the US Agency for International Development;                Designing a Geography of Hope: A Practitioner’s Handbook for Ecore-
the Digital Map of European Ecological Regions working                   gional Conservation Planning. Arlington (VA): The Nature Conser-
group; the European Union; the Fitzpatrick Institute; the                vancy.
Biodiversity Support Program; the World Resources Institute;         Hagmeier EM. 1966. A numerical analysis of the distributional patterns of
                                                                         North American mammals, II: Re-evaluation of the provinces. System-
The Nature Conservancy; and the World Wildlife Fund Net-
                                                                         atic Zoology 15: 279–299.
work. We thank J. Leape, D. Wood, J. Martin-Jones, G. Hem-           Heaney LR. 1986. Biogeography of mammals in Southeast Asia: Estimates
ley, A. Carroll, R. Sayre, J. Soberón, E. Iñigo, K. Redford, J.          of rates of colonization, extinction, and speciation. Biological Journal of
Robinson, U. Bohn, O. Ostermann, P. Regato, R. Thackway,                 the Linnean Society 28: 127–165.
M. McKnight, M. Taye, and T. Green for their support and ex-         ———. 1991. A synopsis of climatic and vegetational change in Southeast
                                                                         Asia. Climatic Change 19: 53–61.
pertise. We thank A. Balmford, S. Pimm, G. Orians, L. Farley,
                                                                     Holdridge LR. 1967. Life Zone Ecology. San Jose (Costa Rica): Tropical Sci-
S. O’Connor, and S. Osofsky for reviewing earlier drafts of this         ence Center.
paper. We would also like to thank the National Geographic           ———. 1977. Mapa ecologico de America Central. San Jose (Costa Rica):
Society, in collaboration with World Wildlife Fund, which has            Tropical Science Center.
provided 10 copies of the ecoregion map and teacher’s guides

                                                                                      November 2001 / Vol. 51 No. 11 • BioScience 937
Articles
Huber O, Alarcon C. 1988. Mapa de Vegetación de Venezuela. Map 1:2,000,000. Orians GH. 1993. Endangered at what level? Ecological Applications 3:
Caracas (Venezuela): Ministerio del Ambiente y de los Recursos Natu- 206–208.
rales Renovables. Pielou EC. 1979. Biogeography. New York: John Wiley and Sons.
Huber O, Gharbarran G, Funk V. 1995. Vegetation Map of Guyana (prelim- Ricketts TH, et al. 1999. Terrestrial Ecoregions of North America: A Con-
inary version). Map 1:1,000,000. Georgetown (Guyana): Centre for the servation Assessment. Washington (DC): Island Press.
Study of Biological Diversity, University of Guyana. Roca R, Adkins L, Wurschy MC, Skerl K. 1997. Transboundary conservation:
[IBGE] Instituto Brasilero de Geografia Estatística. 1993. Mapa de Vegetação An ecoregional approach to protect neotropical migratory birds in South
do Brasil. Map 1:5,000,000. Rio de Janeiro (Brazil): IBGE.
America. Environmental Management 21: 477–481.
Isachenko AG, Shliapnikov AA, Pobozerova OD, Filipetskaya AZ. 1988.
Rübel E. 1930. Pflanzengesellsschaften der Erde. Berlin: Hans Huber.
Landscapes of the USSR. Moscow: National Agency of Geodesy and
Rzedowski J. 1978. Vegetación de Mexico. Mexico DF (Mexico): Editorial
Cartography.
Limusa.
Johnson KN, Swanson FJ, Herring M, Greene S, eds. 1999. Bioregional As-
sessments: Science at the Crossroads of Management and Policy. Wash- Schmidthüsen J. 1976. Atlas zur biogeographie. Mannheim (Germany): Bib-
ington (DC): Island Press. liographisches Institut.
Joshi A, Dinerstein E, Smith D. 2001. The Terai Arc: Managing tigers and other Schultz J. 1995. The Ecozones of the World: The Ecological Divisions of the
wildlife as metapopulations. In Wikramanayake E, Dinerstein E, Loucks Geosphere. Berlin: Springer-Verlag.
C, Olson D, Morrison J, Lamoreux J, McKnight M, Hedao P. Terrestrial Soulé ME, Kohm KA. 1989. Research Priorities for Conservation Biology.
Ecoregions of the Indo-Pacific: A Conservation Assessment. Washington Washington (DC): Island Press.
(DC): Island Press. Soulé ME, Terborgh J. 1999. Conserving nature at regional and continental
Kiester AR, Scott JM, Csuti B, Noss RF, Butterfield B, Sahr K, White D. 1996. scales—a scientific program for North America. BioScience 49: 809–817.
Conservation prioritization using gap data. Conservation Biology 10: Stattersfield AJ, Crosby MJ, Long AJ, Wege DC. 1998. Endemic Bird Areas of
1332–1342. the World: Priorities for Biodiversity Conservation. Cambridge (UK):
Kurnaev S. 1990. Forest Regionalization of the USSR. Map 1:16,000,000. Birdlife International. Birdlife Conservation Series no. 7.
Moscow: National Agency of Geodesy and Cartography. Thackway R, Cresswell ID, eds. 1995. An Interim Biogeographic Regional-
Loveland TR, Belward AS. 1997. The IGBP-DIS global 1 km land cover data ization for Australia: A Framework for Establishing a National System of
set, DISCover first results. International Journal of Remote Sensing 18:
Reserves. Canberra (Australia): Australian Nature Conservation Agency.
3289–3295.
Udvardy MDF. 1975. A classification of the biogeographical provinces of the
Mace GM, Balmford A, Boitani L, Cowlishaw G, Dobson AP, Faith DP, Gas-
world. Morges (Switzerland): International Union of Conservation of Na-
ton KJ, Humprhies CJ, Vane-Wright RI, Williams PH. 2000. It’s time to
work together and stop duplicating conservation efforts. Nature 405: 393. ture and Natural Resources. IUCN Occasional Paper no. 18.
MacKinnon J. 1997. Protected Areas Systems Review of the Indo-Malayan [UNESCO] United Nations Educational, Scientific and Cultural Organiza-
Realm. Canterbury (UK): Asian Bureau for Conservation and World Con- tion. 1969. A Framework for a Classification of World Vegetation. Paris:
servation Monitoring Centre/World Bank publication. UNESCO. UNESCO SC/WS/269.
Margules CR, Pressey RL. 2000. Systematic conservation planning. Nature Walter H, Box E. 1976. Global classification of natural terrestrial ecosystems.
405: 243–253. Vegetatio 32: 75–81.
Mittermeier RA, Myers N, Mittermeier CG, Gill PR. 1999. Hotspots: Earth’s White F. 1983. The Vegetation of Africa: A Descriptive Memoir to Accom-
biologically richest and most endangered terrestrial ecoregions. Mexico pany the UNESCO/AETFAT/UNSO Vegetation Map of Africa (3 plates),
DF (Mexico): CEMEX S.A. 1:5,000,000. Paris: UNESCO.
Miyawaki A. 1975. Outline of Japanese vegetation. Pages 19–27 in Numata Wiken EB, Rubec CDA, Ironside GR. 1989. Terrestrial Ecoregions of Canada.
K, Yoshida K, Kato M, eds. Studies in Conservation of Natural Terrestrial Provisional Map 1:7,500,000. Ottawa (Canada): Sustainable Development
Ecosystems in Japan. Tokyo: University of Tokyo Press. Branch, Environment Canada.
Myers N, Mittermeier RA, Mittermeier CG, Fonseca GAB, Kent J. 2000. Wikramanayake E, Dinerstein E, Loucks C, Olson D, Morrison J, Lamoreux
Biodiversity hotspots for conservation priorities. Nature 403: 853–858.
J, McKnight M, Hedao P. 2001. Terrestrial ecoregions of the Indo-Pacific:
Noss RF. 1992. The Wildlands Project land conservation strategy. Wild Earth
A conservation assessment. Washington (DC): Island Press.
Special Issue: 10–25.
Williams PH, Gaston KJ, Humphries CJ. 1997. Mapping biodiversity value
Noss RF, Strittholt JR, Vance-Borland K, Carroll C, Frost P. 1999. A conser-
worldwide: Combining higher-taxon richness from different groups.
vation plan for the Klamath-Siskiyou ecoregion. Natural Areas Journal
19: 392–411. Proceedings of the Royal Society of London Series B Biological Sciences
Olson DM, Dinerstein E. 1998. The Global 200: A representation approach 264: 141–148.
to conserving the Earth’s most biologically valuable ecoregions. Con- Williams PH, Burgess ND, Rahbek C. 2000. Flagship species, ecological
servation Biology 12: 502–515. complementarity, and conserving the diversity of mammals and birds in
Omernik JM. 1995. Level III Ecoregions of the Continental US. Map sub-Saharan Africa. Animal Conservation 3: 249–260.
1:7,500,000 Scale. Washington (DC): National Health and Environment Zohary M. 1973. Geobotanical Foundations of the Middle East. Stuttgart (Ger-
Effects Research Laboratory, US Environmental Protection Agency. many): Gustav Fischer-Verlag.
938 BioScience • November 2001 / Vol. 51 No. 11You can also read