The ability of detainment bunds to decrease sediment loss from pastoral catchments in surface runoff: Investigating a novel stormwater mitigation ...
←
→
Page content transcription
If your browser does not render page correctly, please read the page content below
The ability of detainment bunds to decrease sediment loss from
pastoral catchments in surface runoff: Investigating a novel
stormwater mitigation strategy
Brian Levine1 , Lucy Burkitt1 , Dave Horne1 , Chris Tanner2 , James Sukias2 , Leo Condron3 ,
and John Paterson4
1
Massey University
2
NIWA
3
Lincoln University
4
Phosphorus Mitigation Project, Inc.
Posted on Authorea 25 Feb 2020 — CC BY 4.0 — https://doi.org/10.22541/au.158264003.39358113 — This a preprint and has not been peer reviewed. Data may be preliminary.
May 5, 2020
Abstract
Erosion leading to sedimentation in surface water may deliver sediment-bound nutrients that contribute to eutrophication.
Loss of native vegetation driven by land use changes have accelerated the naturally high rates of erosion in New Zealand and
increased sedimentation in streams and lakes. Water quality in Lake Rotorua, in the Bay of Plenty region, New Zealand, has
declined since the 1960’s due to land use developments contributing to nutrient loading and eutrophication. Anthropogenic
P loads delivered to the lake are 17-19 t P y-1, 71-79% of which are sediment-bound. Lake sediments release an estimated
48% of the total annual P load. Detainment bunds (DBs) were first implemented in the Lake Rotorua catchment in 2010
as a strategy to address P losses from pastoral agriculture. Detainment bund are 1.5-2 m high earthen stormwater retention
structures, constructed on productive pasture across the flow path of targeted low-order ephemeral streams. The current DB
design protocol recommends a minimum pond volume of 120 m3 ha-1 of contributing catchment with a maximum pond storage
capacity of 10,000 m3. No previous study has investigated the ability of DBs to decrease annual suspended sediment (SS) loads
leaving pastoral catchments. Annual SS yields delivered to 2 DBs, with 20 ha and 55 ha catchments, during this 12-month
study, were 109 kg SS ha-1 and 28 kg SS ha-1, respectively. Results suggest that the DB strategy decreased annual SS loads
discharged from the DB catchments by 1280 kg (59%) and 789 kg (51%) as a result of the bunds’ ability to impede stormflow
and facilitate soil infiltration and sedimentation. The results of this study highlight the DB strategy’s ability to consistently
decrease SS loads leaving pastures in runoff, even during rare, high magnitude storm events, and suggests DBs are likely able
to reduce P loading in Lake Rotorua.
Introduction
Suspended sediments (SS) are organic and inorganic particles transported in suspension by water (Bilotta
et al., 2009). Rainfall and surface runoff cause erosion, leading sedimentation in surface waters and causing
aquatic ecosystem degradation by disrupting aquatic habitats and food webs (Howard-Williams, Davies-
Colley, Rutherford, & Wilcock, 2010), and by delivering sediment-bound nutrients that contribute to eu-
trophication (Dare, 2018). Land use developments clearing native forests have accelerated the already
1naturally high rates of erosion across New Zealand and caused significant sedimentation in lakes and streams
(Ministry for the Envrionment, 2019).
Pastoral agriculture in New Zealand is strongly associated with eutrophication and degraded freshwater
ecosystems (Verburg, Hamill, Unwin, & Abell, 2010). Treading by grazing animals physically disrupts the
soil, and increases the likelihood of surface runoff and erosion by decreasing infiltration rates and porosity,
and impairing plant growth (Bilotta, Brazier, & Haygarth, 2007; R. W. McDowell et al., 2003; Ward, Talbot,
Denne, & Abrahamson, 1985). Year-round grazing and high stocking rates used to graze crops are common
practices in New Zealand and contribute to increased erosion (Monaghan et al., 2007). Addressing erosion
is a challenge for pastoral farmers in New Zealand, particularly those on sloping landscapes, due to variable
precipitation patterns with very wet winters, and dry summers interspersed with large storms (R. McDowell,
Wilcock, & Hamilton, 2013). Erosion is likely to be intensified by climate change causing more dramatic
hydrologic conditions (Ministry for the Envrironment, 2019; Ockenden et al., 2016).
Since the 1960’s water quality in Lake Rotorua, in the Bay of Plenty Region on the North Island of New
Zealand, has declined due to nutrient inputs from residential, commercial, industrial and agricultural devel-
opments (Environment Bay of Plenty, 2009). An estimated 43% of the annual total phosphorus (P) delivered
to the lake comes from pastoral dairy and drystock farms which cover ˜48% of the 42,000 ha Lake Rotorua
surface catchment (Bay of Plenty Regional Council, 2012). Between 71-79% of the anthropogenic P delivered
Posted on Authorea 25 Feb 2020 — CC BY 4.0 — https://doi.org/10.22541/au.158264003.39358113 — This a preprint and has not been peer reviewed. Data may be preliminary.
to the lake is sediment bound (Hamill, 2018), and a portion of that may become biologically available under
anoxic conditions which occur in Lake Rotorua and contributes to lake eutrophication (Abell & Hamilton,
2013). Lake sediments release an estimated 36 t P y-1 , accounting for ˜48% of the total annual P loading
(Bay of Plenty Regional Council, 2012). Intensified anoxic conditions during periods of warmer tempera-
tures have cause significantly greater contributions to annual P loads by lake sediments (Burns, McIntosh,
& Scholes, 2005).
The 2012 Lake Rotorua Management Plan has set a target to reduce annual TP loads delivered from the
catchment by 10 t P y-1 by 2022 from the estimated 39 t P y-1 , in order to restore lake water quality
(Bay of Plenty Regional Council, 2012). Achieving Lake Rotorua water quality targets by addressing P
loading from pastoral agriculture will require combining multiple appropriate nutrient mitigation strategies
and potentially developing new technologies (R. W. McDowell, 2010).
Mitigation strategies that increase stormflow residence time have been found to decrease surface runoff flows,
leading to increased sediment deposition by decreasing the kinetic energy of flowing water (Dosskey, 2001;
McKergow, Tanner, Monaghan, & Anderson, 2007; Stanley, 1996). However, the type of mitigation strategy
affects the duration sediments are attenuated. Studies have found that sediment retention times are more
brief (weeks to months) where sediments accumulate in more concentrated areas, such as narrow grass filter
strips and constructed treatment wetlands, compared to strategies where sediments are blanketed over a
wide area, which may have retention times of up to hundreds of years (McKergow et al., 2007).
Previous research has found that ponding surface runoff can decrease discharge concentrations and loads of
sediments and particulate bound P by decreasing the kinetic energy of flowing water (Brown, Bondurant,
& Brockway, 1981; Harper, Herr, Baker, & Livingston, 1999; Levine et al., 2019; R. W. McDowell et al.,
2006; Stanley, 1996). Detainment bunds (DBs), are earthen storm water retention structures constructed
on pastures across the flow path of targeted low-order ephemeral streams capable of impeding stormflow
and temporarily ponding up to 10,000 m3 of surface runoff. The structures were implemented in the Lake
Rotorua catchment in 2010 as a mitigation strategy to target P losses from pastures (Clarke, 2013). A
concurrent paper by Levine et al., (In review) investigating the strategy’s effect on stormwater volumes
leaving the same DB catchments during the same storm events as this current study presents further detail
on DB design and function.
Preliminary studies of DBs in the Lake Rotorua catchment have found that P enriched sediments were
deposited in DB ponding areas (Clarke, 2013), and that a DB effectively decreased runoff volumes, and
sediment and P loads, discharged during 3 non-consecutive ponding events (Levine et al., 2019). A concurrent
2study investigating the same ponding events at the same DB sites as this present study reported 31 and 43%
and noted that deposited sediments could be developing a less permeable surface soil layer and/or clogging
soil pore spaces and causing infiltration rates to decline in the ponding areas (Levine et al., In review).
Although erosion is recognised for its potential impact to aquatic ecosystems, there is room to progress our
understanding of the transport and fate of sediments from intensively managed pastures (Haygarth et al.,
2006). To determine if DBs could provide a viable strategy for pastoral farmers to improve Lake Rotorua
water quality, it is important to quantify their ability to decrease SS loads. The main objective of this study
was to measure the effect of the DB strategy on SS concentrations and yields delivered to 2 DBs with 55 ha and
20 ha catchments, located on pastures in the Lake Rotorua catchment, and identify the factors influencing
the results. Previous studies on DBs, and related mitigation strategies, suggest ponding surface runoff
facilitates sedimentation, although there is currently no definitive research quantifying the impact of the
DBs on annual sediment loads transported from pastures in the Lake Rotorua catchment. We hypothesised
that ponding surface runoff will facilitate sedimentation and result in lower discharge concentrations, which,
combined with soil infiltration lowering runoff discharge volumes reported in a concurrent study by Levine
et al. (In Review), will decrease annual SS loads discharged from the treatment catchments.
Materials and Methods
Posted on Authorea 25 Feb 2020 — CC BY 4.0 — https://doi.org/10.22541/au.158264003.39358113 — This a preprint and has not been peer reviewed. Data may be preliminary.
Site descriptions
The 2 DBs investigated during this current study, along with concurrent studies investigating the effect of
DBs on hydrology and nutrients during the same storm events from 1 December 2017 to 30 November 2018,
were located on pastoral dairy farms in the north-western portion of the Lake Rotorua catchment. Table 1
describes site characteristics reported by the concurrent studies. The Oropi series soils at the the Hauraki
site, and Waiteti series soils at the Awahou site are both free draining, with >72 mm/h permeability in
slowest horizon (Rijkse & Guinto, 2010).
Event types
Event types reported on in this, and concurrent studies, were differentiated according to the mode(s) ponded
water was discharged from the DB. ‘Overflow Events’ occurred during larger runoff events when inflow
continued to be delivered to the pond after the pond height exceeded the height of the upstand riser (Fig. 1 ).
After 3 days of ponding, any residual ponded water was evacuated when the outlet valve was opened, creating
‘release discharge’. Therefore, ‘Overflow Events’ had both overflow and release discharge components. In
contrast, ‘Non-overflow Events’ were smaller storms that did not contribute enough runoff to overtop the riser.
Non-overflow Events included events when at the end of the 3-day treatment period, either had a portion of
ponded runoff to discharge by opening the release valve, or all ponded runoff leaked and infiltrated the soil
so there was no water left to discharge.
Equipment
Isco® (California, USA) 6712 portable auto-samplers, capable of filling 24 x 1 L bottles collected inflow and
discharge samples at each site when triggered by a telemetered UNIDATA® Neon® 2013 F 3G External
Memory Metering Module data loggers linked to UNIDATA® 6527 Starflow® QSD flowmeters. The auto-
samplers were triggered to collect 1 L samples when flows exceeded 7 L/s (Harmel, King, Wolfe, & Torbert,
2002). Calibration and maintenance of the monitoring equipment followed standard quality controls (NIWA,
2004).
Inflow auto-samplers collected a 1 L sample every 20 min for the first 10 samples, then one 1 L sample/h
thereafter (Harmel, King, & Slade, 2003; Stanley, 1996). The mouth of a rain guarded 750-mL self-sealing
3bottle using a ping-pong ball inside the bottle, was installed at ground level near the pond outlet valve to
capture a sample of the initial flush of surface runoff generated before the inflow auto-sampler was triggered.
The ping-pong ball bottle sample was used as the concentration of the initial runoff and used in calculating
event inflow yields
Discharge auto-samplers were programmed to collect a 1-L sample/h (Harmel et al., 2003; Stanley, 1996).
Sampled discharge flows were generated if the pond height exceeded the upstand riser height during pond
filling (i.e. ‘overflow discharge’) (Fig. 1 ), and when the valve at the base of the riser was opened to release
the pond at the end of the event treatment, typically on the third day of ponding (i.e. ‘release discharge’).
Throughout all ponding at both sites an intractable leak at the connection point of the outlet valve pipe and
the base of the upstand riser generated a continual flow of ˜2-4 m3 /h. Attempts at sealing this leak during
the study period were unsuccessful. Under normal sampling conditions, the leak flow was too low to trigger
the auto-samplers, although leak samples were collected during 4 events at the Hauraki site, and 1 event at
the Awahou site, in order to characterise the SS concentrations of the leak discharge.
Water samples were collected from the field within 24 h of the end of the ponding event and kept refrigerated
at 4 °C prior to subsampling (within ˜24 h of collection). Two separate subsamples (˜30 mL) were taken from
the field sample after vigorously shaking the bottle, to analyse total and dissolved N and P. The remaining
field sample was kept refrigerated until being analysed for SS concentrations used in this current study,
Posted on Authorea 25 Feb 2020 — CC BY 4.0 — https://doi.org/10.22541/au.158264003.39358113 — This a preprint and has not been peer reviewed. Data may be preliminary.
following the standard procedure from the American Public Health Association (2005).
Calculations
Mean flow proportional concentrations
Event and annual mean flow-proportional (MFP) SS concentrations were calculated by dividing the inflow
and discharge loads by their respective volume (Tanner & Sukias, 2011). The average difference between
the event MFP inflow and leak samples collected during 5 events was +3%, with no consistent increase or
decrease. Due to the negligible difference between the MFP inflow and leak concentrations, the MFP inflow
concentration was applied to the entire leak volume for each respective event in which the leak discharge was
not sampled. The applied leak concentration was used to calculate the event MFP discharge concentrations
and event discharge loads. All inflow and discharge MFP concentrations will be referred to only as inflow
and outflow concentrations.
Loads and yields calculation
Loads of SS in inflows and each discharge type were determined for all ponding events. Inflow loads of SS were
calculated by multiplying the measured concentration of the runoff samples collected by the ping-pong ball
sample bottle and auto-samplers, and using interpolated concentrations based on the linear rate of change
between measured concentrations, by the interval flow volume measured every 5 minutes. Inflow loads were
corrected on a pro rata basis (15% increase at the Hauraki site and 9% increase at the Awahou site) to
account for the small catchment area between the inflow monitoring site and the DB (Table 1) .
Discharge loads were calculated for overflow discharge (combining upstand riser and spillway breaching),
release discharge (which occurred during Overflow events and Non-Overflow events), and leak discharge.
The load of each discharge type was calculated from flow measurements and sample concentrations taken
from the DB outlet pipe, except for emergency spillway breaching. Emergency spillway loads were calculated
by applying the MFP concentration of the overflow discharge generated by ponded water discharged by going
over the upstand riser to the volume breaching the spillway calculated by the concurrent study reporting on
hydrology. Yields refer to the load per unit of contributing catchment area and expressed as mm for runoff
volumes, and kg ha-1 for SS loads.
4Data analysis
Water sample data analysis
Events were grouped by site, then analysed for overall annual results, and results for each event type. Changes
to concentrations were calculated as the percent difference between inflow and discharge concentrations. The
percent difference between inflow and discharge yields were reported as ‘yield treatment efficiencies’. Inflow
yield data for each site was also organised by austral seasons (i.e. summer from December to February) to
compare differences between the sites and identify seasonal patterns for SS inflow yields.
Results and discussion
Storm generated surface runoff resulted in 18 ponding events at the Hauraki site and 19 ponding events at
the Awahou site during this 12-month study. Ponding events occurred most often during the winter months
compared to the other seasons (Fig. 2) . Water samples were analysed for 13 of these ponding events at
the Hauraki site, and 14 events at the Awahou site, since not all ponding events generated flow rates high
enough to trigger auto-samplers. Discharge samples were collected during 10 events at the Hauraki site, and
13 events at the Awahou site, since not all events generated discharge flows to be sampled due to leakage
Posted on Authorea 25 Feb 2020 — CC BY 4.0 — https://doi.org/10.22541/au.158264003.39358113 — This a preprint and has not been peer reviewed. Data may be preliminary.
and soil infiltration.
Concentrations
The annual SS inflow concentration was 17 g m-3 at the Hauraki site, and 96 g m-3 at the Awahou site.
Concentrations peaked in the winter at the Hauraki site, while there was no clear temporal trend for inflow
concentrations at the Awahou site (Fig. 2) . Event inflow concentrations did not tend to correspond to event
runoff magnitudes and varied widely between events.
The annual MFP SS discharge concentration was 28% lower than inflows at the Hauraki site, and 29% lower
at the Awahou site. These results suggest that DBs effectively facilitated sedimentation during ponding,
and attenuated deposited sediments in the ponding area. Discharge concentrations were lower than inflows
during 7 of the 10 events analysed at the Hauraki site, and 10 of the 13 events analysed at the Awahou site
(Fig. 2 ). Inconsistencies in concentration treatment efficiencies were observed between and within event
types at both sites (Table 2 ).
The wide range of concentration treatment efficiencies observed in this study were influenced by multiple
factors. Treading damage, deposited animal excreta and previously deposited sediments in the ponding area
could have contributed to SS discharged from the DB that were not accurately accounted for by the pro rata
correction of the contributing catchment area and affected the concentration treatment efficiency results.
Variations in particle sizes delivered to the DBs, which were not measured in this study, could have also
been a contributing factor to the varying concentration treatment efficiencies observed between events and
the sites in this present study. Large particles that have greater densities settle more readily than smaller
sized particles with lower densities, which would be less likely to settle and more likely to be remobilised and
discharged from the DBs (R. W. McDowell et al., 2003). A greater number of larger particles, which require
more energy to mobilise and transport, could have been delivered to the DBs during higher magnitude runoff
events, particularly Overflow Events, and could be partially responsible for SS concentrations decreasing
during all Overflow events in this study, while this was not the case for all Non-Overflow Events (Table 2 ).
During Overflow Events at both sites, the SS concentrations between the portions of inflow contributing to
ponded water going over the top of the upstand riser and emergency spillway (i.e. overflow discharge) and the
overflow discharge, did not decrease to the same extent as the concentration decreased between the between
overflow discharge and the following release discharges (Table 3) . These results are somewhat surprising
since we would expect the decanting of the uppermost layer of water performed by the upstand riser (Fig. 1
5) and emergency spillway would be highly effective at preventing SS discharge. The data suggests however,
that longer pond residence times experienced by the release discharge compared to the overflow discharge
(an average of 14 hours between overflow discharge and the following release discharge at both sites) allowed
for greater sedimentation to occur. Longer retention times have been found to increase sediment removal
efficiencies in a study of sedimentation ponds (Brown et al., 1981).
The data suggests ponding runoff for longer than the currently suggested 3 days could achieve greater
concentration treatment efficiencies, however, this could risk damaging pasture productivity. Removing the
upstand riser/outlet valve/discharge pipe installation (Fig. 1 ), and allowing all ponded water to infiltrate
the soil, would avoid discharging the bottommost portion of ponded water where SS are likely to concentrate
and/or be stirred up by turbulence when unplugging the outlet valve to drain the pond. Also, placing the
outlet valve 10 cm above ground level would enable a small portion of the ponded water left after draining
the pond to infiltrate the soil. This later revision would prevent the discharge of a lower portion of ponded
runoff, and would decrease the area potentially affected by prolonged inundation, compared to avoiding the
release procedure entirely. Lastly, approaches to achieve greater SS concentration treatment efficiencies could
include the use of flocculants.
Yields and loads
Posted on Authorea 25 Feb 2020 — CC BY 4.0 — https://doi.org/10.22541/au.158264003.39358113 — This a preprint and has not been peer reviewed. Data may be preliminary.
The key finding of this study was that impeding stormflow with DBs effectively attenuated 789 kg and 1280
kg of SS at the Hauraki and Awahou sites, respectively. The 51% and 60% decrease in annual SS loads
discharged from the DB catchments was a result of the DBs’ ability to facilitate sedimentation, which often
decreased event SS concentrations, and soil infiltration, which decreased the volume of runoff discharged
from the DB. These results suggest DBs should be effective at reducing P losses from pastures in the Lake
Rotorua catchment, due to the high proportion of sediment bound P delivered to the lake (Hamill, 2018).
Annual SS inflow yields were 28 kg ha-1 at the Hauraki site, and 109 kg ha-1 at the Awahou site, although
runoff inflow yields were greater at the Hauraki site than the Awahou site. The annual SS inflow yields at
both sites in this study were much lower than the estimated annual SS yields entering streams in the same
area of the Lake Rotorua catchment from May 2010 to May 2012 (479-741 kg ha-1 y-1 ) (Abell, Hamilton,
& Rutherford, 2013). Factors affecting the catchments’ hydrological responses to precipitation, including
antecedent soil conditions and localised differences in storm rainfall intensity and duration, and differences
between the catchment sizes, geomorphologies, and land use and management factors, affected runoff genera-
tion and erosion (Dougherty, Fleming, Cox, & Chittleborough, 2004), and likely accounted for the SS inflow
yield differences between study sites in this present study and the results reported by Abell et al. (2013).
At both sites during this present study, runoff and SS inflow yields were lowest in the spring and increased
during each subsequent season, peaking during the winter period (Fig. 3 ). This was not surprising, as the
contributing catchment is grazed by dairy cattle soil treading damage and erosion is likely to increase when
soils are wet (R. W. McDowell et al., 2003) . Additionally, greater SS yields tended to correspond with greater
runoff yields, particularly during the high runoff magnitude Overflow Events (Fig. 4 ). These results are
consistent with other studies that found greater runoff magnitudes tend to mobilise and transport greater
quantities of sediments and nutrients from pastures in New Zealand (Cooke, 1988; Smith & Monaghan, 2003)
and the Lake Rotorua catchment, specifically (Abell et al., 2013; Dare, 2018).
The results of this study suggest the DBs at both sites were able to consistently decrease SS loads discharged
from the DB catchments, even during rare, high runoff magnitude events. The greater inflow magnitudes
during Overflow Events at the Hauraki site contributed to a greater portion of runoff undergoing overflow
discharge, and consequently, the difference in the portion of inflow undergoing soil infiltration and SS yield
treatment efficiencies between the sites during these high magnitude events (Fig. 5) .
The results from the high magnitude Overflow Events emphasize the importance of being effective during
these high magnitude events since they were responsible for 61% and 66% of the annual SS inflow loads at
the Hauraki and Awahou sites, respectively, and 39% and 59% of annual SS yields attenuated. This finding is
6important to note since large storm events have been found to be responsible for the majority of SS loading
to streams in the Lake Rotorua catchment (Abell et al., 2013).
Although DBs effectively attenuated SS loads during Overflow Events, these large magnitude events still
generated 84% of the annual SS discharge yields at the Hauraki site, and 77% at the Awahou site. These
results are likely related to the majority of annual runoff discharges also occurring during Overflow Events
at both sites (Table 4) . These results suggest that reducing runoff discharges from DBs by facilitating soil
infiltration played a key role in effectively decreasing SS loads, which highlights the importance of optimising
DB designs to maximise soil infiltration of ponded runoff and avoiding excess overflow discharge.
The ability of DBs to consistently decrease SS loads, particularly during high magnitude runoff events,
is also significant because some land management strategies may be overwhelmed by extreme hydrologic
conditions (Kleinman et al., 2006; R. W. McDowell & Sharpley, 2002; McKergow et al., 2007). Sediments
deposited as a blanket across the relatively wide DB ponding area was observed during this present study,
and likely contributed to the consistency in DB performance during this study (Table 1 ) (McKergow et
al., 2007). Importantly, it is likely sediments deposited in the DB ponding area will be attenuated for longer
periods of time than other mitigation strategies, such as buffer strips and treatment wetlands, that have
more concentrated sediment deposition areas and are susceptible to flushing during high magnitude events
(McKergow et al., 2007). The ability of the DB to impede the stormflow of each runoff event reduced the
Posted on Authorea 25 Feb 2020 — CC BY 4.0 — https://doi.org/10.22541/au.158264003.39358113 — This a preprint and has not been peer reviewed. Data may be preliminary.
kinetic energy of water, which enables the transfer and/or remobilisation sediments, and particularly the
‘first-flush’ of the initial runoff, could have had a major influence on the DBs’ ability to decrease SS loads
transported in surface runoff during each event in this study (Bieroza et al., 2019).
The role of soil infiltration in annual SS yield treatment efficiencies is important to note. The concurrent
study by (Levine et al., In review) found lower infiltration rates in the ponding area than outside the ponding
area (Table 1 ). The decreased soil infiltration rates in the ponding area could be due to a combination
of factors including treading damage in the lower lying and wetter areas (R. W. McDowell et al., 2003),
the large volumes of water moving through the soil causing stress and deterioration in soil structure, and
sediments deposited in the ponding area clogging soil pores and/or forming a less permeable surface soil layer
(Hendrickson, 1934; Reddi, Ming, Hajra, & Lee, 2000; Rice, 1974). Therefore, the data suggests infiltration
rates, and consequently SS yield treatment efficiencies, may be highest in newly constructed DBs, and
may decrease over time. Also, soil infiltration rates, and consequently SS yield treatment efficiencies, could
decline more rapidly if DBs are located in areas where erosion is more intense and a greater amount of
sediments are deposited in the ponding area compared to this present study, if deposited sediments are
responsible for infiltration rate declines. Causes of declining soil infiltration rates in the ponding areas, as
well as methods of mitigating soil infiltration rate declines, such as aerating the pond area soils or employing
subsoil amendments, should be investigated.
During this study, event discharge concentrations were lower than inflows more often than higher, and SS yield
treatment efficiencies were greater than runoff yield treatment efficiencies (Fig. 5 ). These results indicate
that sedimentation facilitated by impeding stormflows with DBs caused lower SS discharge concentrations.
Therefore, DBs would likely be able to decrease SS discharge yields in areas where soil infiltration rates and
pond storage to catchment area ratios are lower than those in this present study. Other factors influencing the
proportion of runoff infiltrating the soil and sediment sizes delivered to the DBs would affect yield treatment
efficiencies.
Lastly, revising the DB design to remove the upstand riser/outlet valve/discharge pipe installation would
prevent SS leak and release discharges, which could be remobilised and delivered to downstream surface
waters in subsequent runoff events. We calculated that applying this revised DB design would have prevented
an additional 147 kg of SS from being discharged from the Hauraki site, and an addition 216 kg at the Awahou
site, increases of 16% and 14% of the annual load attenuated at each site, respectively. The costs and benefits
of revising the DB design should be considered since the increased inundation period could damage pasture
productivity.
7Conclusion
The results of this current study found that DBs located on pastures in the Lake Rotorua catchment at-
tenuated 789 kg SS at the Hauraki site, and 1280 kg SS at the Awahou site, accounting for 51% and 59%
of the annual inflow SS loads, respectively. These findings demonstrate that DBs are an effective strategy
available to pastoral farmers attempting to mitigate their contribution to Lake Rotorua eutrophication, since
and the majority of P transported from the catchment is sediment-bound and has the potential to become
biologically available.
Large portions of the annual SS yields attenuated by the DBs occurred during rare, high runoff magnitude
events, which delivered the greatest surface runoff and SS yields to the bunds during this study. Identifying the
ability of DBs to effectively decrease SS yields during these rare, high magnitude storm events is important
since large but less frequent runoff events have been observed to contribute significant sediment loads to
streams in the northwest portion of the Lake Rotorua catchment where this study was conducted.
The annual SS yield treatment efficiencies observed in this present study were related to changes in SS
concentrations through sedimentation, and the portion of runoff infiltrating the soil in the ponding area.
Greater SS yields were discharged from the DBs with greater discharged runoff volumes, which emphasises
the importance of optimising DB design to maximise the amount of runoff infiltrating the soil. Still, the
Posted on Authorea 25 Feb 2020 — CC BY 4.0 — https://doi.org/10.22541/au.158264003.39358113 — This a preprint and has not been peer reviewed. Data may be preliminary.
impoundment of runoff generally decreased event SS concentrations, suggesting that DBs may effectively
decrease SS loads where soil infiltration rates, and pond storage to catchment area ratios, are not as high as
those this present study.
While this study found DBs consistently decreased SS yield discharged from the DBs, identifying methods
to improve concentration treatment efficiencies, such as integrating flocculants, or allowing the bottommost
layer of the pond to infiltrate the soil rather than be released, would improve yield treatment efficiencies.
Also, cost:benefit analyses should be conducted to determine whether removing the pond drainage mechanism
(i.e.. riser/outlet valve/discharge pipe unit) would be beneficial, keeping in mind this might affect pasture
productivity. Longer-term studies should also be conducted on more DBs in the Lake Rotorua catchment to
further understand the potential of the strategy to effectively mitigate pastoral farming’s impact to surface
water quality. Studies should also investigate the cause of declining soil infiltration rates in the ponding
area and methods for maintaining or rehabilitating infiltration rates in order to maintain SS yield treatment
efficiencies over the life of the DB.
Data Availability Statement
Data is available upon request from the corresponding author.
Conflict of interest
The authors declare no conflict of interest.
References
Abell, J. M., & Hamilton, D. P. (2013). Bioavailability of phosphorus transported during storm flow to
a eutrophic, polymictic lake. New Zealand Journal of Marine and Freshwater Research, 47 (4), 481-489.
10.1080/00288330.2013.792851
Abell, J. M., Hamilton, D. P., & Rutherford, J. C. (2013). Quantifying temporal and spatial variations
in sediment, nitrogen and phosphorus transport in stream inflows to a large eutrophic lake.Environmental
Science Processes & Impacts, 15 , 1137-1152. 10.1039/c3em00083d
American Public Health Association. (2005). Standard methods for the examination of water and wastewater
. Washington, DC, USA: Federation, Water, Environmental, and American Public Health Association.
8Bay of Plenty Regional Council. (2012). Improving water quality in Lake Rotorua: Information on the way
land is used . Whakatane, New Zealand: Bay of Plenty Regional Council.
Bieroza, M., Bergström, L., Ulén, B., Djodjic, F., Tonderski, K., Heeb, A., . . . Malgeryd, J. (2019). Hydrologic
extremes and legacy sources can override efforts to mitigate nutrient and sediment losses at the catchment
scale. Journal of Environmental Quality, 48 , 1314-1324. 10.2134/jeq2019.02.0063
Bilotta, G. S., Brazier, R. E., & Haygarth, P. M. (2007). The impacts of grazing animals on the quality of
soils, vegetation, and surface waters in intensively managed grasslands. Advances in Agronomy, 94 , 237-280.
10.1016/S0065-2113(06)94006-1
Bilotta, G. S., Krueger, T., Brazier, R. E., Freer, P. B., Hawkins, J. M. B., Haygarth, P. M., . . . Quinton, J. N.
(2009). Assessing catchment-scale erosion and yields of suspended solids fromimproved temperate grassland.
Journal of Environmental Monitoring, 12 , 731-739. 10.1039/B921584K
Brown, M. J., Bondurant, J. A., & Brockway, C. E. (1981). Ponding surface drainage water for sediment
and phosphorus removal.Tansactions of ASAE, 24 (6), 1478-1481. 10.13031/2013.34477
Burns, N., McIntosh, J., & Scholes, P. (2005). Strategies for Managing the Lakes of the Rotorua District,
New Zealand. Lake and Reservoir Management, 21 (1), 61-72. 10.1080/07438140509354413
Posted on Authorea 25 Feb 2020 — CC BY 4.0 — https://doi.org/10.22541/au.158264003.39358113 — This a preprint and has not been peer reviewed. Data may be preliminary.
Clarke, D. (2013). The performance of Detainment Bunds (DBs) for attenuating phosphorus and sediment
loss from pastoral farmland.(Master of Science Masters thesis), University of Waikato, Hamilton, New Zea-
land. Retrieved from https://hdl.handle.net/10289/7993
Cooke, J. G. (1988). Sources and sinks of nutrients in a New Zealand hill pasture catchment II. Phosphorus.
Hydrologlcal Processes, 2 , 123-133. 10.1002/hyp.3360020203
Dare, J. (2018). Trends and State of Nutrients in Lake Rotorua Streams 2002-2016 . Whakatane, New
Zealand: Bay of Plenty Regional Council.
Dosskey, M. (2001). Toward Quantifying Water Pollution Abatement in Response to Installing Buffers on
Crop Land. Environmental Management, 28 (5), 577–598. 10.1007/s002670010245
Dougherty, W. J., Fleming, N. K., Cox, J. W., & Chittleborough, D. J. (2004). Phosphorus Transfer in
Surface Runoff from Intensive Pasture Systems at Various Scales. Journal of Environment Quality, 33 (6),
1973. 10.2134/jeq2004.1973
Environment Bay of Plenty. (2009). Lakes Rotorua and Rotoiti Action Plan . Environment Bay of Plenty.
Hamill, K. D. (2018). Anthropogenic phosphorus load to Rotorua review and revision . Whakatane, New
Zealand: Bay of Plenty Regional Council.
Harmel, R., King, K., & Slade, R. (2003). Automated storm water sampling on small watersheds. Applied
Engineering in Agriculture, 19 (6), 667-674. 10.13031/2013.15662
Harmel, R., King, K., Wolfe, J., & Torbert, H. (2002). Minimum flow considerations for automated storm
sampling on small watersheds.Texas Journal of Science, 54 (2), 177-188.
Harper, H. H., Herr, J. L., Baker, D., & Livingston, E. H. (1999).Performance evaluation of dry detention
stormwater management systems . Paper presented at the Stormwater Research & Watershed Management
Conference, Tampa, Florida.
Haygarth, P. M., Bilotta, G. S., Bol, R., Brazier, R. E., Butler, P. J., Freer, J., . . . Worsfold, P. (2006).
Processes affecting transfer of sediment and colloids, with associated phosphorus, from intensively farmed
grasslands: an overview of key issues. Hydrological Processes, 20 , 4407-4413. 10.1002/hyp.6598
Hendrickson, B. H. (1934). The choking of pore-space in the soil and its relation to runoff and erosion.
Transactions American Geophysical Union, 15 , 500-505. 10.1029/TR015i002p00500
9Howard-Williams, C., Davies-Colley, R., Rutherford, K., & Wilcock, R. (2010). Diffuse pollution and fresh-
water degradation: New Zealand perspectives. Paper presented at the Issues and Solutions to Diffuse Pollu-
tion: Selected Papers from the 14th International Conference of the IWA Diffuse Pollution Specialist Group,
DIPCON 2010, Quebec, Canada.
Kleinman, P. J., Srinivasan, M. S., Dell, C. J., Schmidt, J. P., Sharpley, A. N., & Bryant, R. B. (2006).
Role of rainfall intensity and hydrology in nutrient transport via surface runoff. Journal of Environmental
Quality, 35 (4), 1248-1259. 10.2134/jeq2006.0015
Levine, B., Burkitt, L., Horne, D., Condron, L., Tanner, C., & Paterson, J. (2019). Preliminary assessment
of the ability of detainment bunds to attenuate sediment and phosphorus transported by surface runoff in
the Lake Rotorua catchment. Animal Production Science, 60 , 154-158. 10.1071/AN18544
Levine, B., Horne, D., Burkitt, L., Tanner, C., Sukias, J., Condron, L., & Paterson, J. (In review). The
ability of detainment bunds to decrease surface runoff leaving pastoral catchments: Investigating a novel
approach to agricultural stormwater management
McDowell, R., Wilcock, B., & Hamilton, D. P. (2013). Assessment of Strategies to Mitigate the Impact or
Loss of Contaminants from Agricultural Land to Fresh Waters . Wellington, New Zealand: Ministry for the
Environment.
Posted on Authorea 25 Feb 2020 — CC BY 4.0 — https://doi.org/10.22541/au.158264003.39358113 — This a preprint and has not been peer reviewed. Data may be preliminary.
McDowell, R. W. (2010). The efficacy of strategies to mitigate the loss of phosphorus from pastoral land use
in the catchment of Lake Rotorua . Environment Bay of Plenty.
McDowell, R. W., Drewry, J. J., Paton, R. J., Carey, P. L., Monaghan, R. M., & Condron, L. M. (2003).
Influence of soil treading on sediment and phosphorus losses in overland flow. Australian Journal of Soil
Research, 41 , 949-961.
McDowell, R. W., McGrouther, N., Morgan, G., Srinivasan, M. S., Stevens, D., Johson, M., & Copland, R.
(2006). Monitoring of the impact of farm practices on water quality in the Otago and Southland deer focus
farms.Proceeding of the New Zealand Grassland Association, 68 , 183-188.
McDowell, R. W., & Sharpley, A. N. (2002). The effect of antecedent moisture conditions on sediment
and phosphorus loss during overland flow: Mahantango Creek catchment, Pennsylvania, USA. Hydrological
Processes, 16 (15), 3037-3050. 10.1002/hyp.1087
McKergow, L., Tanner, C., Monaghan, R., & Anderson, G. (2007).Stocktake of diffuse pollution attenuation
tools for New Zealand pastoral farming systems . Hamilton, New Zealand: National Institute of Water &
Atmospheric Research Ltd.
Ministry for the Envrionment. (2019). Environment Aotearoa 2019 Summary.Environment Aotearoa 2019.
Retrieved 5/09 2019 from https://www.mfe.govt.nz/environment-aotearoa-2019-summary
Ministry for the Envrironment. (2019, 2019/03/22). Likely climate change impacts in New
Zealand. Retrieved 29 March 2019 from https://www.mfe.govt.nz/climate-change/likely-impacts-of-climate-
change/likely-climate-change-impacts-nz
Monaghan, R., Hedley, M., Di, H., McDowell, R., Cameron, K., & Ledgard, S. (2007). Nutrient management
in New Zealand pastures—recent developments and future issues. New Zealand Journal of Agricultural
Research, 50 (2), 181-201. 10.1080/00288230709510290
NIWA. (2004). Environmental data operations manual. In AS/NZS ISO 9001:2003 . Wellington, NZ: NIWA
Science and Technology Series, National Institute of Water and Atmospheric Research.
Ockenden, M., Deasy, C., Benskin, C., Beven, K., Burke, S., Collins, A., . . . Haygarth, P. M. (2016). Chang-
ing climate and nutrient transfers: Evidence from high temporal resolution concentration-flow dynamics in
headwater catchments. Science of the Total Environment, 548-549 , 325-339.
10Reddi, L., Ming, X., Hajra, M., & Lee, I. (2000). Permeability reduction of soil filters due to physical clog-
ging. Journal of Geotechnical and Geoenvironmental Engineering, 126 (3), 236-246. 10.1061/(ASCE)1090-
0241(2000)126:3(236)
Rice, R. (1974). Soil clogging during infiltration of secondary effluent. Journal of Water Pollution Control
Federation, 46 (4), 708-716.
Rijkse, W. C., & Guinto, D. F. (2010). Soils of the Bay of Plenty Volume 2: Central Bay of Plenty .
Whakatane, NZ: Environment Bay of Plenty.
Smith, L. C., & Monaghan, R. M. (2003). Nitrogen and phosphorus losses in overland flow from a
cattle-grazed pasture in Southland. New Zealand Journal of Agricultural Research, 46 (3), 225-237.
10.1080/00288233.2003.9513549
Stanley, D. (1996). Pollutant removal by a stormwater dry detention pond. Water Environment Research,
68 (6), 1076-1083. 10.2175/106143096X128072
Tanner, C. C., & Sukias, J. P. S. (2011). Multiyear Nutrient Removal Performance of Three Constructed
Wetlands Intercepting Tile Drain Flows from Grazed Pastures. Journal of Environment Quality, 40 (2),
620. 10.2134/jeq2009.0470
Posted on Authorea 25 Feb 2020 — CC BY 4.0 — https://doi.org/10.22541/au.158264003.39358113 — This a preprint and has not been peer reviewed. Data may be preliminary.
Verburg, P., Hamill, K., Unwin, M., & Abell, J. (2010). Lake water quality in New Zealand 2010: Status
and trends . Hamilton, New Zealand: National Institute of Water & Atmospheric Research.
Ward, J. C., Talbot, J. M., Denne, T., & Abrahamson, M. (1985).Phosphorus losses through transfer, soil
erosion and runoff: processes and implications . Center for Resource Managment: Lincoln Collge and
University of Canterbury.
Tables
Table 1. Characteristics of detainment bund sites.
Site name Hauraki Awahou
Grid Reference 38°00’21”S 38°01’43”S
176°11’03”E 176°07’54”E
Year DB constructed October 2011 June 2012
Topography of catchment Flat, rolling and hill Mainly rolling
Size of DB catchment (ha) 55.0 19.7
Area of DB catchment 8.3 1.8
downstream of inflow
monitoring (ha)
Height of bund at spillway 1.56 1.80
(m)
Height of upstand riser (m) 1.36 1.60
DB pond volume at 7,110 m3 2,244 m3
spillway
Ratio of pond volume to 129:1 114:1
catchment area (m3 :ha)
Pond area when pond filled 12,221 m2 2,940 m2
to spillway
Measured infiltration rates Inside: 19 Outside: 36 Inside: 12 Outside: 37
inside and outside ponding
areaa (mm/h)
11Site name Hauraki Awahou
Soil classifications New Zealand: Buried-allophanic New Zealand: Typic Orthic
Orthic Pumice USA: Vitric Podzols USA: Andic Haplohumod
Hapludand
a
Levine et al. (In review)
Table 2. Mean flow proportional (MFP) concentrations of suspended sediments (SS) for inflow
and discharges across all events, ranges for each event type, and changes to concentrations
comparing discharges to inflows.
MFP SS MFP SS
concentration (g concentration (g Percentage
Site Event type m-3 ) m-3 ) change (%)
Inflow Discharge
Hauraki All events 17 12 -28
Overflow Event 13 – 17 10 –13 -22 – -21
Posted on Authorea 25 Feb 2020 — CC BY 4.0 — https://doi.org/10.22541/au.158264003.39358113 — This a preprint and has not been peer reviewed. Data may be preliminary.
range
Non-Overflow 4 – 96 6 – 77 -69 – +270
Event range
Awahou All events 96 68 -29
Overflow Event 74 – 186 73 – 85 -54 – -1
range
Non-Overflow 14 – 211 11 – 127 -55 – +50
Event range
Table 3. Mean change in suspended sediment (SS) concentrations between the portion of
inflow contributing to ponded water going over the top of the upstand riser and emergency
spillway (i.e. overflow discharge) and the overflow discharge, and the mean concentration
change between the overflow discharge and the release discharge generated upon opening the
outlet valve to drain the pond during Overflow Events at both sites.
Mean change in SS
concentration between: Hauraki (%) Awahou (%)
Portion of inflow contributing -37 -20
to overflow discharge and
overflow discharge
Overflow discharge and release -41 -84
discharge generated upon
opening the outlet valve to
drain the pond
Table 4. Percentage of annual inflow yields and suspended sediments (SS) which occurred
during Overflow Events at each site.
Runoff SS
(%) (%)
12Runoff SS
Hauraki Hauraki Inflow 69 61
Discharge 85 84
Awahou Awahou Inflow 47 66
Discharge 64 77
Figure legends
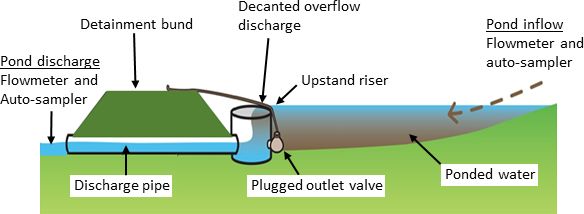
Figure 1. Cross section of the ponding area showing the ephemeral stream inflow ponding
behind a detainment bund. If the pond height exceeds the height of the upstand riser then
‘decanted overflow’ is discharged via a pipe passing through the bund. Inflows and discharges
are measured with flowmeters which triggers auto-sampler collections.
Figure 2. Inflow runoff yields (mm) and mean flow proportional suspended sediment (SS)
concentrations (g m-3 ) of inflow and discharge for each event at each site, with arrows pointing
to high runoff magnitude Overflow Events.
Posted on Authorea 25 Feb 2020 — CC BY 4.0 — https://doi.org/10.22541/au.158264003.39358113 — This a preprint and has not been peer reviewed. Data may be preliminary.
Figure 3. Cumulative seasonal inflow runoff (mm) and cumulative suspended sediments (SS)
inflow yields (kg ha-1 ) for each season at each site.
Figure 4. Inflow runoff yields (mm) and suspended sediment (SS) inflow yields (kg ha-1 ) for
each event at each site with arrows pointing to high magnitude Overflow Events.
Figure 5. Cumulative annual event and Overflow Event runoff (mm) and suspended sediment
(SS) yields (kg ha-1 ) for inflows and discharges at both sites. Percent decreases between
discharge and inflows is also shown.
13Posted on Authorea 25 Feb 2020 — CC BY 4.0 — https://doi.org/10.22541/au.158264003.39358113 — This a preprint and has not been peer reviewed. Data may be preliminary. 14
Posted on Authorea 25 Feb 2020 — CC BY 4.0 — https://doi.org/10.22541/au.158264003.39358113 — This a preprint and has not been peer reviewed. Data may be preliminary.

15
Posted on Authorea 25 Feb 2020 — CC BY 4.0 — https://doi.org/10.22541/au.158264003.39358113 — This a preprint and has not been peer reviewed. Data may be preliminary.

16
Posted on Authorea 25 Feb 2020 — CC BY 4.0 — https://doi.org/10.22541/au.158264003.39358113 — This a preprint and has not been peer reviewed. Data may be preliminary.

17
You can also read