THE CHANGING WORLD ORDER - RAY DALIO Country Power Index 2022 - Economic Principles
←
→
Page content transcription
If your browser does not render page correctly, please read the page content below
THE CHANGING
 WORLD ORDER

 Country Power
  Index 2022
  RAY DALIO
     © 2022 RAY DALIO
C O U N T RY P O W E R I N D E X 2 0 2 2
EXPANDED ANALYSIS OF THE
CONDITIONS OF, AND PROSPECTS FOR,
THE WORLD’S LEADING COUNTRIES
A
s I described in my book Principles for Dealing with the Changing World Order, I automated my way
of looking at the cause/effect relationships that are driving both improvements in and worsenings
of countries’ conditions so that data is fed into a computer that analyzes it and writes a summary
of the current conditions and the long-term prospects for each country. This is done for the world’s
24 leading countries. To understand how it works and how I use it, imagine you are a chess player and that you
built a computerized version of your thinking process that analyzes and makes moves next to you while you also
think through the moves you’d make. While it reflects your thinking, has perfect memory, and can process vast
amounts of data almost instantaneously, the computer has no common sense and isn’t able to pick up on subtle,
non-quantifiable relationships. Your mind and the computer each bring different strengths and weaknesses that
make you together far better than either of you alone. That’s what it’s like.
In my book I showed the computerized assessment of 11 major powers and promised to share updated
versions for 24 countries—those in the G20 plus others that scored as notable global powers—at least annually
on economicprinciples.org. That’s what I’m now doing.
In this report, I start by showing summary tables of scores of the 18 major determinants across countries
(see Principles for Dealing with the Changing World Order for more details). After that, I show the computer-
generated summaries that describe each country. The text for each country highlights a few of the major gauges
and a few of the stats within each gauge that reflect the broad trends I am seeing. Of course there is a great deal
more below these summaries that I can delve into, though these summaries are good enough for our purposes.
The overall country power score is created by weighing the outputs of the 18 gauges, each of which is
derived as a composite of several stats we aggregate based on relevance, quality, and consistency across countries
and time. Because both the size of a country and the strength of the powers matter, I show measures of the
total power and the per capita power of each country. For more detail on how I thought about different types
of measures (in per capita and absolute terms), please see the table at the end of this report, following the
computer-generated country summaries.
To be clear, while these indices aren’t perfect because the data through time isn’t perfect and not everything
can be captured in the data, they do an excellent job of painting the big picture. Additionally, it is worth noting
that we have updated and improved the analysis since the book was published, which is why you may notice
some figures differ slightly in this report compared to the publication. This system is a never-ending work in
progress so you should expect it to evolve and continuously get better. I hope that you will find it as helpful as I
find it. I also hope that these objective measures will lead to people objectively assessing policy makers’ moves
and that that will lead either to better policies or to better policy makers who will make better policies.
[As of April 2022]
1THE CHANGING WORLD ORDER
ALL THE MAJOR DETERMINANTS ACROSS THE WORLD
The tables on the following pages paint a rich picture of what’s happening and what is likely to happen across
an expanded set of 24 major countries. While this table might look like a bunch of numbers and arrows at first
glance, when you get into it a clearer picture will emerge. In my book, I discuss the determinants in greater
depth in the Determinants Addendum (Chapter 2) and The Future (Chapter 14). The quality of the gauges
in representing the concepts varies. In order to convey the reliability of each gauge, we indicate whether it’s
reliable or so-so. The following page describes how to read the tables.
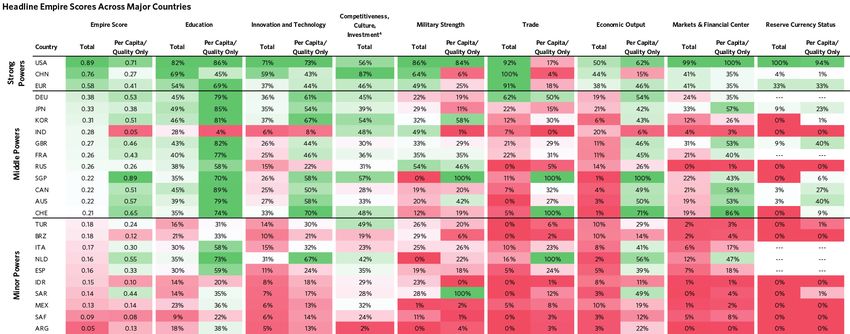
CURRENT READINGS ACROSS MAJOR POWERS
(Z-Score and 20-Year Change Denoted by Arrows)
GAUGE
USA CHN EUR DEU JPN KOR
QUALITY
EMPIRE SCORE (0–1) 0.89 0.76 0.58 0.38 0.33 0.31
THE BIG CYCLES
Economic/Financial Position Reliable -1.5 0.3 -0.9 -0.1 -1.3 0.1
Debt Burden (Big Economic Cycle) Reliable -1.9 0.0 -0.6 0.8 -1.0 0.5
Expected Growth (Big Economic Cycle) Reliable -0.6 0.4 -1.0 -1.0 -1.1 -0.4
Internal Order So-So -2.0 0.2 0.2 0.8 1.1 --- ---
Gaps in Wealth, Opportunity & Values So-So -1.8 0.2 0.1 0.8 1.0 0.0
Internal Conflict1 (Internal Order; low is bad) Reliable -2.2 0.1 0.3 0.7 1.2 --- ---
External Order 2
So-So -1.3 -1.3 0.3 0.3 0.4 --- ---
KEY EIGHT MEASURES OF POWER
Education Reliable 2.0 1.7 0.4 -0.2 0.1 0.1
Innovation & Technology Reliable 2.1 1.6 0.2 -0.2 0.1 0.2
Cost Competitiveness Reliable -0.4 1.1 -0.6 -0.6 -0.3 0.1
Military Strength Reliable 2.0 0.9 0.4 -0.7 -0.4 -0.4
Trade Reliable 1.1 1.9 1.3 0.5 -0.5 -0.7
Economic Output Reliable 1.7 1.5 1.0 -0.1 -0.1 -0.9
Markets & Financial Center Reliable 2.7 0.2 0.4 -0.2 0.1 -0.6
Reserve Currency Status3 Reliable 1.9 -0.6 0.3 --- --- -0.5 -0.7 ---
ADDITIONAL MEASURES OF POWER
Geology Reliable 1.6 0.5 -0.6 -0.7 -1.0 -0.9
Resource-Allocation Efficiency So-So 1.4 0.8 -0.8 1.0 0.6 -0.5
Acts of Nature So-So -0.2 --- -0.1 --- 0.1 --- 1.1 --- 1.5 --- 1.6 ---
Infrastructure & Investment Reliable 0.7 2.6 0.4 -0.3 -0.2 0.0
Character/Civility/Determination So-So 1.0 1.6 -1.0 -0.4 0.4 1.0
Governance/Rule of Law Reliable 0.7 -0.6 -0.5 --- 0.7 0.8 -0.2
1
We are still working to expand our internal and external conflict determinants across all countries.
2
External Order based on external conflict gauge vs the global hegemon (USA) or rising power (CHN) as of April 2022.
3
We did not give individual Eurozone countries reserve currency status scores.
2C O U N T RY P O W E R I N D E X 2 0 2 2
The first column shows the determinant being measured. There are other determinants that aren’t shown
because they are either too subjective or too difficult to quantify (e.g., leadership). The quality of leadership
can’t be measured as objectively as the amount of economic output (e.g., how can you measure whether Donald
Trump was a good leader or a bad one?). The rest of the columns show each country’s score on each determinant,
as well as the recent trend in that score; where we do not have enough data to make a gauge or enough history
to display an arrow, we show dashes to indicate no reading.
CURRENT READINGS ACROSS MAJOR POWERS
(Z-Score and 20-Year Change Denoted by Arrows)
GAUGE
IND GBR FRA RUS SGP CAN
QUALITY
EMPIRE SCORE (0–1) 0.28 0.27 0.26 0.26 0.22 0.22
THE BIG CYCLES
Economic/Financial Position Reliable 1.1 -1.5 -1.0 0.7 --- 0.8 -0.6
Debt Burden (Big Economic Cycle) Reliable 0.5 -1.8 -0.8 1.2 1.6 -0.3
Expected Growth (Big Economic Cycle) Reliable 1.1 -0.7 -0.9 -0.2 --- -0.4 -0.7
Internal Order So-So --- --- -0.3 0.5 -1.2 --- --- --- ---
Gaps in Wealth, Opportunity & Values So-So -0.3 -0.3 1.1 -1.8 -2.1 -0.2
Internal Conflict1 (Internal Order; low is bad) Reliable --- --- -0.3 -0.1 -0.5 --- --- --- ---
External Order 2
So-So --- --- 0.4 --- --- -2.1 --- --- --- ---
KEY EIGHT MEASURES OF POWER
Education Reliable -1.1 -0.3 -0.5 -0.5 -0.5 -0.2
Innovation & Technology Reliable -1.1 -0.3 -0.5 -0.7 -0.6 -0.6
Cost Competitiveness Reliable 2.4 -0.4 -0.6 0.7 --- 0.2 -0.5
Military Strength Reliable 0.3 -0.2 -0.1 0.6 -2.1 -0.9
Trade Reliable -0.8 -0.5 -0.5 -0.9 -0.7 -0.8
Economic Output Reliable 0.1 -0.6 -0.6 -0.5 -1.5 -1.1
Markets & Financial Center Reliable -0.7 0.0 -0.3 -1.0 -0.4 -0.4
Reserve Currency Status3 Reliable -0.7 -0.5 --- --- -0.7 --- -0.7 --- -0.6 ---
ADDITIONAL MEASURES OF POWER
Geology Reliable 0.3 -0.8 -0.5 2.1 -0.6 0.7
Resource-Allocation Efficiency So-So 0.3 -0.3 -1.6 -0.1 --- 2.4 0.5
Acts of Nature So-So -2.4 --- 0.3 --- 0.0 -0.1 --- -0.3 --- 1.2 ---
Infrastructure & Investment Reliable -0.3 -0.7 -0.2 -1.0 -0.2 -0.7
Character/Civility/Determination So-So 1.3 -0.3 -1.5 0.2 --- 2.4 0.1
Governance/Rule of Law Reliable -1.1 1.2 0.3 -1.9 2.3 0.7
1
We are still working to expand our internal and external conflict determinants across all countries.
2
External Order based on external conflict gauge vs the global hegemon (USA) or rising power (CHN) as of April 2022.
3
We did not give individual Eurozone countries reserve currency status scores.
3THE CHANGING WORLD ORDER
CURRENT READINGS ACROSS MAJOR POWERS
(Z-Score and 20-Year Change Denoted by Arrows)
GAUGE
AUS CHE TUR BRZ ITA NLD
QUALITY
EMPIRE SCORE (0–1) 0.22 0.21 0.18 0.18 0.17 0.16
THE BIG CYCLES
Economic/Financial Position Reliable -0.6 -0.1 --- -0.1 -0.4 -1.1 -0.5
Debt Burden (Big Economic Cycle) Reliable -0.7 0.4 -0.5 -0.2 -0.5 0.0
Expected Growth (Big Economic Cycle) Reliable -0.4 -0.7 --- 0.2 -0.4 -1.3 -0.9
Internal Order So-So --- --- --- --- --- --- --- --- --- --- 0.9
Gaps in Wealth, Opportunity & Values So-So 0.3 0.0 -1.1 -2.0 0.9 0.6
Internal Conflict1 (Internal Order; low is bad) Reliable --- --- --- --- --- --- --- --- --- --- 1.3
External Order2 So-So --- --- --- --- --- --- --- --- --- --- --- ---
KEY EIGHT MEASURES OF POWER
Education Reliable -0.5 -0.7 -1.7 -1.4 -0.9 -0.7
Innovation & Technology Reliable -0.6 -0.2 -1.0 -1.0 -0.8 -0.3
Cost Competitiveness Reliable -0.6 -0.6 0.9 0.6 -0.7 -0.8
Military Strength Reliable -0.9 -1.2 -0.6 -0.5 -0.7 -1.8
Trade Reliable -1.0 -0.8 -1.2 -1.1 -0.7 -0.6
Economic Output Reliable -1.3 -1.5 -0.7 -0.7 -0.7 -1.4
Markets & Financial Center Reliable -0.4 -0.3 -1.0 -1.0 -0.7 -0.5
Reserve Currency Status3 Reliable -0.6 --- -0.7 -0.7 --- -0.7 --- --- --- --- ---
ADDITIONAL MEASURES OF POWER
Geology Reliable 1.9 -0.5 -0.6 1.6 -0.7 -0.4
Resource-Allocation Efficiency So-So -0.4 -0.5 -0.2 -1.3 -2.4 0.3
Acts of Nature So-So 1.4 --- 1.2 --- -0.1 --- -2.3 --- -0.9 --- 0.5 ---
Infrastructure & Investment Reliable -0.7 -0.1 -0.5 -1.1 -0.8 -0.4
Character/Civility/Determination So-So 0.1 0.4 0.0 -0.8 -1.4 -0.3
Governance/Rule of Law Reliable 0.9 1.2 -1.2 -2.3 -1.9 1.0
1
We are still working to expand our internal and external conflict determinants across all countries.
2
External Order based on external conflict gauge vs the global hegemon (USA) or rising power (CHN) as of April 2022.
3
We did not give individual Eurozone countries reserve currency status scores.
4C O U N T RY P O W E R I N D E X 2 0 2 2
CURRENT READINGS ACROSS MAJOR POWERS
(Z-Score and 20-Year Change Denoted by Arrows)
GAUGE
ESP IDN SAU MEX SAF ARG
QUALITY
EMPIRE SCORE (0–1) 0.16 0.15 0.14 0.13 0.09 0.05
THE BIG CYCLES
Economic/Financial Position Reliable -1.3 1.0 1.9 --- 0.3 0.2 -1.0
Debt Burden (Big Economic Cycle) Reliable -1.1 0.6 1.9 --- 0.3 0.2 -0.9
Expected Growth (Big Economic Cycle) Reliable -1.1 0.9 --- --- 0.1 0.0 -0.7
Internal Order So-So 0.0 --- --- --- --- --- --- --- --- --- ---
Gaps in Wealth, Opportunity & Values So-So 0.4 0.1 -3.0 -1.8 -2.8 0.1
Internal Conflict1 (Internal Order; low is bad) Reliable -0.4 --- --- --- --- --- --- --- --- --- ---
External Order2 So-So --- --- --- --- --- --- --- --- --- --- --- ---
KEY EIGHT MEASURES OF POWER
Education Reliable -0.9 -1.9 -1.4 -1.3 -1.8 -1.7
Innovation & Technology Reliable -1.0 -1.2 -1.4 -1.3 -1.2 -1.2
Cost Competitiveness Reliable -0.6 2.0 --- --- 0.8 0.8 0.4
Military Strength Reliable -0.9 -0.8 -0.6 -2.1 --- -1.3 -2.1
Trade Reliable -0.9 -1.2 -1.2 -0.9 -1.3 -1.3
Economic Output Reliable -1.0 -0.8 -1.2 -0.8 -1.2 -1.2
Markets & Financial Center Reliable -0.7 -1.1 -1.1 -1.0 -1.0 -1.3
Reserve Currency Status3 Reliable --- --- -0.7 --- -0.7 --- -0.7 --- -0.7 --- -0.7 ---
ADDITIONAL MEASURES OF POWER
Geology Reliable -0.5 0.4 0.3 -0.3 -0.2 -0.3
Resource-Allocation Efficiency So-So -1.5 1.0 -0.7 -0.3 -0.6 -2.4
Acts of Nature So-So -0.6 --- -2.1 --- -1.9 --- -1.1 --- -2.0 --- -2.0 ---
Infrastructure & Investment Reliable -0.6 -0.6 -0.6 -1.0 -1.1 -1.5
Character/Civility/Determination So-So -0.9 1.3 --- --- 1.3 -0.5 --- -0.7
Governance/Rule of Law Reliable -0.7 -1.3 --- --- -2.3 -1.5 -2.3
1
We are still working to expand our internal and external conflict determinants across all countries.
2
External Order based on external conflict gauge vs the global hegemon (USA) or rising power (CHN) as of April 2022.
3
We did not give individual Eurozone countries reserve currency status scores.
5THE CHANGING WORLD ORDER
THE POWERS AND PROSPECTS OF THE UNITED STATES
This is our computer generated reading for the United States as of April 2022.
Based on the latest readings of key indicators, the United States appears to be a strong power (#1 among major
countries today) in gradual decline. As shown in the table below, the key strengths of the United States that
put it in this position are its strong capital markets and financial center, its innovation/technology, its strong
military, its high level of education, its reserve currency status, its high economic output, and its wealth of
natural resources. Its weaknesses are its unfavorable economic/financial position and its large domestic con-
flicts. The eight major measures of power are very strong today but are, in aggregate, falling slowly.
The table below shows our aggregate country power gauge and the major drivers, as well as the rank of each
measure of power across 24 major countries today and the trajectory over the past 20 years.
To understand a country, we start by looking at the big cycles, as well as measures of power that both reflect
and drive the rise and fall of a country. While we refer to these factors individually, they are not separate; they
interact with and reinforce one another to move a country along its cycle.
For the United States, the big cycles look mostly unfavorable.
The United States is in an unfavorable position in its economic and financial cycles, with a high debt burden
and relatively low expected real growth over the next 10 years (1.3% per year). The United States has significantly
more foreign debts than foreign assets (net IIP is -68% of GDP). Non-financial debt levels are high (274% of
GDP), and government debt levels are high (127% of GDP). The bulk (99%) of these debts are in its own currency,
which mitigates its debt risks. The ability to use interest rate cuts to stimulate the economy is low (short rates at
0.1%), and the country is already printing money to monetize debt. That said, being the world’s leading reserve
currency is a large benefit to the US. If this were to change, it would significantly weaken the US position.
Internal disorder is a high risk. Wealth, income, and values gaps are large (relative to countries of similar per
capita income levels). Regarding inequality—the top 1% and top 10% in the United States capture 19% and
45% of income (respectively the 8th and 11th highest share across major countries). Our internal conflict gauge
is very high. This gauge measures actual conflict events (e.g., protests), political conflict (e.g., partisanship), and
general discontent (based on surveys).
External disorder is a risk. Most importantly, the United States and China, which is fast-rising and the #2
power (all things considered), are having significant conflict as measured by our external conflict gauge. One
example of this is that 79% of Americans today have an unfavorable view of China (up from 45% in 2018).
Looking in more detail at the eight key measures of power—the United States has the largest capital mar-
kets and the strongest financial center among major countries. Its equity markets are a majority of the world
total (59% of total market cap and 66% of volume), and a majority of global transactions happen in USD (55%).
In addition, the United States has the strongest reading on our measures of technology and innovation
among major countries. A moderately large share (14%) of global patent applications, a large share (27%)
of global R&D spending, and a large share (27%) of global researchers are in the United States. The United
6C O U N T RY P O W E R I N D E X 2 0 2 2
States also has the strongest military among major countries. A large share (40%) of global military spend-
ing is by the United States, and it has a moderate share (7%) of the world’s military personnel. The United States
also has a mix of other strengths, detailed in the table above.
Note: With this page, I am calling out a few of the major gauges and a few of the stats within each gauge that reflect
the broad trends we are seeing. The aggregate gauges and final country power score I am showing include hundreds of
individual stats that we aggregate based on relevance, quality, and consistency across countries and time. To best capture
the overall strength of a country, I gave considerations to both quantity and quality but structured things to best capture
who would win in a competition or war.
UNITED STATES—KEY DRIVERS OF OUR COUNTRY POWER SCORE
Overall Empire Score (0–1) Level: 0.89 Rank: 1
The Big Cycles Level Z-Score Rank Trajectory
Economic/Financial Position Unfavorable -1.5 23
Debt Burden High Debt -1.9 24
Expected Growth 1.3% -0.6 12
Internal Order High Risk -2.0 10
Wealth/Opportunity/Values Gap Large -1.8 19
Internal Conflict Very High -2.2 10
External Order At Risk -1.3 -
Eight Key Measures of Power
Markets & Financial Center Very Strong 2.7 1
Innovation & Technology Very Strong 2.1 1
Military Strength Very Strong 2.0 1
Education Very Strong 2.0 1
Reserve Currency Status Very Strong 1.9 1
Economic Output Very Strong 1.7 1
Trade Strong 1.1 3
Cost Competitiveness Average -0.4 14
Additional Measures of Power
Resource-Allocation Efficiency Strong 1.4 1
Infrastructure & Investment Strong 0.7 2
Geology Strong 1.6 4
Character/Determination/Civility Strong 1.0 6
Governance/Rule of Law Strong 0.7 9
Acts of Nature Average -0.2 14 -
Getting better Getting worse Flat
Note: All ranks shown are out of 24, except in the case of Internal Conflict & Internal Order (out of 10) and Reserve
Currency Status (out of 19).
7THE CHANGING WORLD ORDER
THE POWERS AND PROSPECTS OF CHINA
This is our computer generated reading for China as of April 2022.
Based on the latest readings of key indicators, China appears to be a strong power (#2 among major countries
today) in rapid ascent. As shown in the table below, the key strengths of China that put it in this position
are its infrastructure and investment, its importance to global trade, its high level of education, its innova-
tion/technology, its people’s self-sufficiency and strong work ethic, and its strong military. The eight major
measures of power are somewhat strong today and are, in aggregate, rising rapidly. In particular, China’s im-
portance to global trade, its innovation and technology, and its importance as a financial center are increasing.
The table below shows our aggregate country power gauge and the major drivers, as well as the rank of each
measure of power across 24 major countries today and the trajectory over the past 20 years.
To understand a country, we start by looking at the big cycles, as well as measures of power that both reflect
and drive the rise and fall of a country. While we refer to these factors individually, they are not separate; they
interact with and reinforce one another to move a country along its cycle.
For China, the big cycles look somewhat favorable.
China is in a somewhat favorable position in its economic and financial cycles, with a moderately low debt
burden and relatively high expected real growth over the next 10 years (4.3% per year). China has slightly more
foreign assets than foreign debts (net IIP is 11% of GDP). Non-financial debt levels are high (267% of GDP),
though government debt levels are typical for major countries today (49% of GDP). The bulk (97%) of these
debts are in its own currency, which mitigates its debt risks. The ability to use interest rate cuts to stimulate the
economy is modest (short rates at 2.1%).
Internal disorder is a low risk. Wealth, income, and values gaps are typical (relative to countries of similar per
capita income levels). Regarding inequality—the top 1% and top 10% in China capture 14% and 42% of income
(respectively the 14th and 13th highest share across major countries). Our internal conflict gauge is average.
This gauge measures actual conflict events (e.g., protests), political conflict (e.g., partisanship), and general
discontent (based on surveys).
External disorder is a risk. Most importantly, China and the United States, which is declining but remains
the #1 power (all things considered), are having significant conflict as measured by our external conflict gauge.
Looking in more detail at the eight key measures of power—China is the largest exporter among major
countries. It exports 14% of global exports. In addition, China has the second strongest position in edu-
cation among major countries. China has a large share of the world’s bachelor’s degrees (20%). China also
has the second strongest reading on our measures of technology and innovation among major countries.
A majority (58%) of global patent applications, a large share (23%) of global R&D spending, and a large share
(23%) of global researchers are in China. China also has a mix of other strengths, detailed in the table above.
8C O U N T RY P O W E R I N D E X 2 0 2 2
Note: With this page, I am calling out a few of the major gauges and a few of the stats within each gauge that reflect
the broad trends we are seeing. The aggregate gauges and final country power score I am showing include hundreds of
individual stats that we aggregate based on relevance, quality, and consistency across countries and time. To best capture
the overall strength of a country, I gave considerations to both quantity and quality but structured things to best capture
who would win in a competition or war.
CHINA—KEY DRIVERS OF OUR COUNTRY POWER SCORE
Overall Empire Score (0–1) Level: 0.76 Rank: 2
The Big Cycles Level Z-Score Rank Trajectory
Economic/Financial Position Somewhat Favorable 0.3 7
Debt Burden Moderately Low Debt -0.0 11
Expected Growth 4.3% 0.4 3
Internal Order Low Risk 0.2 6
Wealth/Opportunity/Values Gap Typical 0.2 8
Internal Conflict Average 0.1 5
External Order At Risk -1.3 -
Eight Key Measures of Power
Trade Very Strong 1.9 1
Education Very Strong 1.7 2
Innovation & Technology Strong 1.6 2
Economic Output Strong 1.5 2
Military Strength Strong 0.9 2
Cost Competitiveness Strong 1.1 3
Markets & Financial Center Average 0.2 3
Reserve Currency Status Weak -0.6 5
Additional Measures of Power
Infrastructure & Investment Very Strong 2.6 1
Character/Determination/Civility Strong 1.6 2
Resource-Allocation Efficiency Strong 0.8 3
Geology Strong 0.5 6
Governance/Rule of Law Weak -0.6 13
Acts of Nature Average -0.1 12 -
Getting better Getting worse Flat
Note: All ranks shown are out of 24, except in the case of Internal Conflict & Internal Order (out of 10) and Reserve
Currency Status (out of 19).
9THE CHANGING WORLD ORDER
THE POWERS AND PROSPECTS OF THE EUROZONE
This is our computer generated reading for Eurozone as of April 2022.
Based on the latest readings of key indicators, Eurozone appears to be a strong power (#3 among major
countries today) in gradual decline. As shown in the table below, the key strengths of Eurozone are its
importance to global trade, its strong capital markets and financial center, and its reserve currency status.
Its weaknesses are its people’s lower than average work ethic and low self-sufficiency and its relatively poor
allocation of labor and capital. The eight major measures of power are somewhat strong today but are, in ag-
gregate, falling slowly.
The table below shows our aggregate country power gauge and the major drivers, as well as the rank of each
measure of power across 24 major countries today and the trajectory over the past 20 years.
To understand a country, we start by looking at the big cycles, as well as measures of power that both reflect
and drive the rise and fall of a country. While we refer to these factors individually, they are not separate; they
interact with and reinforce one another to move a country along its cycle.
For Eurozone, the big cycles look somewhat unfavorable.
The Eurozone is in a moderately unfavorable position in its economic and financial cycles, with a moderately
high debt burden and very low expected real growth over the next 10 years (0.3% per year). The Eurozone has
similar levels of foreign debts and foreign assets (net IIP is 0% of GDP). Non-financial debt levels are typical for
major countries today (239% of GDP), though government debt levels are high (103% of GDP). The ability to use
interest rate cuts to stimulate the economy is very low (short rates at -0.6%), and the country is already printing
money to monetize debt.
Internal disorder is a low risk. Wealth, income, and values gaps are typical (relative to countries of similar per
capita income levels). Regarding inequality—the top 1% and top 10% in the Eurozone capture 11% and 35%
of income (respectively the 21st and 18th highest share across major countries). Our internal conflict gauge is
average. This gauge measures actual conflict events (e.g., protests), political conflict (e.g., partisanship), and
general discontent (based on surveys).
Looking in more detail at the eight key measures of power—the Eurozone is the second largest exporter
among major countries. It exports 12% of global exports. In addition, the Eurozone has the second largest
capital markets and the second strongest financial center among major countries. Its equity markets are
a moderate share of the world total (8% of total market cap and 4% of volume), and a large share of global
transactions happen in EUR (30%). The Eurozone also has the second strongest reserve currency among
major countries. A large share of global currency reserves is in EUR (21%), and a large share of global debt is
denominated in EUR (17%).
This summary reflects our estimate of the power of the Eurozone in aggregate. For most stats, we’re using an aggregate
across the eight major countries in the Eurozone.
10C O U N T RY P O W E R I N D E X 2 0 2 2
Note: With this page, I am calling out a few of the major gauges and a few of the stats within each gauge that reflect
the broad trends we are seeing. The aggregate gauges and final country power score I am showing include hundreds of
individual stats that we aggregate based on relevance, quality, and consistency across countries and time. To best capture
the overall strength of a country, I gave considerations to both quantity and quality but structured things to best capture
who would win in a competition or war.
EUROZONE—KEY DRIVERS OF OUR COUNTRY POWER SCORE
Overall Empire Score (0–1) Level: 0.58 Rank: 3
The Big Cycles Level Z-Score Rank Trajectory
Economic/Financial Position Moderately Unfavorable -0.9 17
Debt Burden Moderately High Debt -0.6 17
Expected Growth 0.3% -1.0 20
Internal Order Low Risk 0.2 5
Wealth/Opportunity/Values Gap Typical 0.1 9
Internal Conflict Average 0.3 4
External Order At Risk 0.3 -
Eight Key Measures of Power
Trade Strong 1.3 2
Markets & Financial Center Average 0.4 2
Reserve Currency Status Average 0.3 2
Economic Output Strong 1.0 3
Education Average 0.4 3
Innovation & Technology Average 0.2 3
Military Strength Average 0.4 4
Cost Competitiveness Weak -0.6 19
Additional Measures of Power
Infrastructure & Investment Average 0.4 3
Governance/Rule of Law Average -0.5 12 -
Resource-Allocation Efficiency Weak -0.8 18
Geology Weak -0.6 19
Character/Determination/Civility Weak -1.0 21
Acts of Nature Average 0.1 9 -
Getting better Getting worse Flat
Note: All ranks shown are out of 24, except in the case of Internal Conflict & Internal Order (out of 10) and Reserve
Currency Status (out of 19).
11THE CHANGING WORLD ORDER
THE POWERS AND PROSPECTS OF GERMANY
This is our computer generated reading for Germany as of April 2022.
Based on the latest readings of key indicators, Germany appears to be a middle-of-the-pack power (#4 among
major countries today) on a flat trajectory. As shown in the table below, the key strengths of Germany are
its high internal order and its effective allocation of labor and capital. The eight major measures of power are
mixed today but are, in aggregate, moving sideways.
The table below shows our aggregate country power gauge and the major drivers, as well as the rank of each
measure of power across 24 major countries today and the trajectory over the past 20 years.
To understand a country, we start by looking at the big cycles, as well as measures of power that both reflect
and drive the rise and fall of a country. While we refer to these factors individually, they are not separate; they
interact with and reinforce one another to move a country along its cycle.
For Germany, the big cycles look somewhat favorable.
Germany is in a moderately unfavorable position in its economic and financial cycles, with a low debt burden
but very low expected real growth over the next 10 years (0.3% per year). Germany has significantly more foreign
assets than foreign debts (net IIP is 71% of GDP). Non-financial debt levels are typical for major countries today
(184% of GDP), and government debt levels are typical for major countries today (69% of GDP). Germany’s debts
are largely in euros, which increases Germany’s debt risks, since this is not a currency that Germany directly con-
trols. The ability to use interest rate cuts to stimulate the economy is low for the Eurozone (short rates at -0.6%),
and Europe is already printing money to monetize debt.
Internal disorder is a low risk. Wealth, income, and values gaps are narrow (relative to countries of similar per
capita income levels). Regarding inequality—the top 1% and top 10% in Germany capture 13% and 37% of income
(both the 16th highest share across major countries). Our internal conflict gauge is low. This gauge measures actual
conflict events (e.g., protests), political conflict (e.g., partisanship), and general discontent (based on surveys).
On the eight key measures of power, Germany looks mixed in aggregate. It has no particularly prominent
strengths or weaknesses that I will call out.
12C O U N T RY P O W E R I N D E X 2 0 2 2
Note: With this page, I am calling out a few of the major gauges and a few of the stats within each gauge that reflect
the broad trends we are seeing. The aggregate gauges and final country power score I am showing include hundreds of
individual stats that we aggregate based on relevance, quality, and consistency across countries and time. To best capture
the overall strength of a country, I gave considerations to both quantity and quality but structured things to best capture
who would win in a competition or war.
GERMANY—KEY DRIVERS OF OUR COUNTRY POWER SCORE
Overall Empire Score (0–1) Level: 0.38 Rank: 4
The Big Cycles Level Z-Score Rank Trajectory
Economic/Financial Position Moderately Unfavorable -0.1 11
Debt Burden Low Debt 0.8 4
Expected Growth 0.3% -1.0 19
Internal Order Low Risk 0.8 3
Wealth/Opportunity/Values Gap Narrow 0.8 4
Internal Conflict Low 0.7 3
External Order At Risk 0.3 -
Eight Key Measures of Power
Trade Strong 0.5 4
Economic Output Average -0.1 6
Education Average -0.2 6
Innovation & Technology Average -0.2 6
Markets & Financial Center Average -0.2 6
Military Strength Weak -0.7 14
Cost Competitiveness Weak -0.6 20
Reserve Currency Status - - - -
Additional Measures of Power
Resource-Allocation Efficiency Strong 1.0 2
Governance/Rule of Law Strong 0.7 8
Infrastructure & Investment Average -0.3 10
Character/Determination/Civility Average -0.4 16
Geology Weak -0.7 21
Acts of Nature Strong 1.1 6 -
Getting better Getting worse Flat
Note: All ranks shown are out of 24, except in the case of Internal Conflict & Internal Order (out of 10) and Reserve
Currency Status (out of 19).
13THE CHANGING WORLD ORDER
THE POWERS AND PROSPECTS OF JAPAN
This is our computer generated reading for Japan as of April 2022.
Based on the latest readings of key indicators, Japan appears to be a middle-of-the-pack power (#5 among
major countries today) in decline. As shown in the table below, the key strength of Japan is its high internal
order. Its weaknesses are its unfavorable economic/financial position and its relative lack of natural re-
sources. The eight major measures of power are mixed today but are, in aggregate, falling. In particular, Japan’s
share of global output, its importance to global trade, and its innovation and technology are declining.
The table below shows our aggregate country power gauge and the major drivers, as well as the rank of each
measure of power across 24 major countries today and the trajectory over the past 20 years.
To understand a country, we start by looking at the big cycles, as well as measures of power that both reflect
and drive the rise and fall of a country. While we refer to these factors individually, they are not separate; they
interact with and reinforce one another to move a country along its cycle.
For Japan, the big cycles look mixed.
Japan is in an unfavorable position in its economic and financial cycles, with a high debt burden and very low
expected real growth over the next 10 years (0% per year). Japan has significantly more foreign assets than foreign
debts (net IIP is 70% of GDP). Non-financial debt levels are very high (403% of GDP), and government debt
levels are very high (240% of GDP). The bulk (99%) of these debts are in its own currency, which mitigates its
debt risks. The ability to use interest rate cuts to stimulate the economy is very low (short rates at -0.1%), and the
country is already printing money to monetize debt.
Internal disorder is a low risk. Wealth, income, and values gaps are narrow (relative to countries of similar
per capita income levels). Regarding inequality—the top 1% and top 10% in Japan capture 13% and 45% of
income (respectively the 15th and 12th highest share across major countries). Our internal conflict gauge is
low. This gauge measures actual conflict events (e.g., protests), political conflict (e.g., partisanship), and general
discontent (based on surveys).
On the eight key measures of power, Japan looks mixed in aggregate. It has no particularly prominent
strengths or weaknesses that I will call out.
14C O U N T RY P O W E R I N D E X 2 0 2 2
Note: With this page, I am calling out a few of the major gauges and a few of the stats within each gauge that reflect
the broad trends we are seeing. The aggregate gauges and final country power score I am showing include hundreds of
individual stats that we aggregate based on relevance, quality, and consistency across countries and time. To best capture
the overall strength of a country, I gave considerations to both quantity and quality but structured things to best capture
who would win in a competition or war.
JAPAN—KEY DRIVERS OF OUR COUNTRY POWER SCORE
Overall Empire Score (0–1) Level: 0.33 Rank: 5
The Big Cycles Level Z-Score Rank Trajectory
Economic/Financial Position Unfavorable -1.3 21
Debt Burden High Debt -1.0 20
Expected Growth 0.0% -1.1 22
Internal Order Low Risk 1.1 1
Wealth/Opportunity/Values Gap Narrow 1.0 2
Internal Conflict Low 1.2 2
External Order At Risk 0.4 -
Eight Key Measures of Power
Reserve Currency Status Average -0.5 3
Education Average 0.1 4
Markets & Financial Center Average 0.1 4
Innovation & Technology Average 0.1 5
Economic Output Average -0.1 5
Trade Average -0.5 5
Military Strength Average -0.4 8
Cost Competitiveness Average -0.3 12
Additional Measures of Power
Resource-Allocation Efficiency Strong 0.6 5
Governance/Rule of Law Strong 0.8 6
Infrastructure & Investment Average -0.2 6
Character/Determination/Civility Average 0.4 9
Geology Weak -1.0 24
Acts of Nature Strong 1.5 2 -
Getting better Getting worse Flat
Note: All ranks shown are out of 24, except in the case of Internal Conflict & Internal Order (out of 10) and Reserve
Currency Status (out of 19).
15THE CHANGING WORLD ORDER
THE POWERS AND PROSPECTS OF KOREA
This is our computer generated reading for Korea as of April 2022.
Based on the latest readings of key indicators, Korea appears to be a middle-of-the-pack power (#6 among
major countries today) in gradual ascent. As shown in the table below, the key weaknesses of Korea are its
relative lack of natural resources and its relatively small economy. The eight major measures of power are
somewhat weak today but are, in aggregate, rising slowly. In particular, Korea’s share of global output, its inno-
vation and technology, and its relative military strength are increasing.
The table below shows our aggregate country power gauge and the major drivers, as well as the rank of each
measure of power across 24 major countries today and the trajectory over the past 20 years.
To understand a country, we start by looking at the big cycles, as well as measures of power that both reflect
and drive the rise and fall of a country. While we refer to these factors individually, they are not separate; they
interact with and reinforce one another to move a country along its cycle.
For Korea, the big cycles look mixed.
Korea is in a somewhat favorable position in its economic and financial cycles, with a low debt burden but
relatively low expected real growth over the next 10 years (1.9% per year). Korea has modestly more foreign assets
than foreign debts (net IIP is 27% of GDP). Non-financial debt levels are high (280% of GDP), though govern-
ment debt levels are typical for major countries today (44% of GDP). The bulk (97%) of these debts are in its own
currency, which mitigates its debt risks. The ability to use interest rate cuts to stimulate the economy is modest
(short rates at 1.2%).
At this time, we do not have a read on internal disorder for Korea because we do not have an internal conflict
gauge. Wealth, income, and values gaps are relatively large (relative to countries of similar per capita income
levels). Regarding inequality—the top 1% and top 10% in Korea capture 15% and 47% of income (respectively
the 12th and 8th highest share across major countries).
Looking in more detail at the eight key measures of power, I would call out its relatively small economy.
16C O U N T RY P O W E R I N D E X 2 0 2 2
Note: With this page, I am calling out a few of the major gauges and a few of the stats within each gauge that reflect
the broad trends we are seeing. The aggregate gauges and final country power score I am showing include hundreds of
individual stats that we aggregate based on relevance, quality, and consistency across countries and time. To best capture
the overall strength of a country, I gave considerations to both quantity and quality but structured things to best capture
who would win in a competition or war.
KOREA—KEY DRIVERS OF OUR COUNTRY POWER SCORE
Overall Empire Score (0–1) Level: 0.31 Rank: 6
The Big Cycles Level Z-Score Rank Trajectory
Economic/Financial Position Somewhat Favorable 0.1 9
Debt Burden Low debt 0.5 7
Expected Growth 1.9% -0.4 10
Internal Order - - - -
Wealth/Opportunity/Values Gap Relatively Large 0.0 12
Internal Conflict - - - -
External Order At Risk - - -
Eight Key Measures of Power
Innovation & Technology Average 0.2 4
Education Average 0.1 5
Military Strength Average -0.4 9
Trade Weak -0.7 9
Cost Competitiveness Average 0.1 11
Markets & Financial Center Weak -0.6 13
Reserve Currency Status Weak -0.7 15 -
Economic Output Weak -0.9 15
Additional Measures of Power
Infrastructure & Investment Average 0.0 4
Character/Determination/Civility Strong 1.0 7
Governance/Rule of Law Average -0.2 11
Resource-Allocation Efficiency Average -0.5 16
Geology Weak -0.9 21
Acts of Nature Strong 1.6 1 -
Getting better Getting worse Flat
Note: All ranks shown are out of 24, except in the case of Internal Conflict & Internal Order (out of 10) and Reserve
Currency Status (out of 19).
17THE CHANGING WORLD ORDER
THE POWERS AND PROSPECTS OF INDIA
This is our computer generated reading for India as of April 2022.
Based on the latest readings of key indicators, India appears to be a middle-of-the-pack power (#7 among
major countries today) in ascent. As shown in the table below, the key strengths of India are its strong eco-
nomic and financial position and its cost-competitive labor (on a quality-adjusted basis). Its weaknesses
are its poor innovation and technology for its population size, its weak relative position in education, and
its corruption and inconsistent rule of law. The eight major measures of power are mixed today but are, in
aggregate, rising. In particular, India’s relative military strength, its innovation and technology, and its impor-
tance as a financial center are increasing.
The table below shows our aggregate country power gauge and the major drivers, as well as the rank of each
measure of power across 24 major countries today and the trajectory over the past 20 years.
To understand a country, we start by looking at the big cycles, as well as measures of power that both reflect
and drive the rise and fall of a country. While we refer to these factors individually, they are not separate; they
interact with and reinforce one another to move a country along its cycle.
For India, the big cycles look somewhat favorable, though we have a limited read.
India is in a highly favorable position in its economic and financial cycles, with a low debt burden and high
expected real growth over the next 10 years (6.4% per year). India has slightly more foreign debts than foreign
assets (net IIP is -12% of GDP). Non-financial debt levels are low (122% of GDP), though government debt levels
are typical for major countries today (75% of GDP). The bulk (94%) of these debts are in its own currency, which
mitigates its debt risks.
At this time, we do not have a read on internal disorder for India because we do not have an internal conflict
gauge. Wealth, income, and values gaps are relatively large (relative to countries of similar per capita income lev-
els). Regarding inequality—the top 1% and top 10% in India capture 22% and 57% of income (respectively the
3rd and 4th highest share across major countries). However, a wide wealth gap is less concerning in a fast-growing
country like India because the fast growth can create rising prosperity for all.
Looking in more detail at the eight key measures of power—India has the cheapest labor among major
countries. Adjusted for worker quality, labor is significantly cheaper than the global average.
We net this against its bad reading on innovation and technology and its weak relative position in educa-
tion. With innovation and technology—a small share (less than 1%) of global patent applications, a small share
(3%) of global R&D spending, and a moderate share (3%) of global researchers are in India. On years of edu-
cation, India is bad—students have on average 5.9 years of education versus 11.5 in the average major country.
PISA scores, which measure the proficiency of 15-year-old students across countries, are bad—336 versus 483
in the average major country.
18C O U N T RY P O W E R I N D E X 2 0 2 2
Note: With this page, I am calling out a few of the major gauges and a few of the stats within each gauge that reflect
the broad trends we are seeing. The aggregate gauges and final country power score I am showing include hundreds of
individual stats that we aggregate based on relevance, quality, and consistency across countries and time. To best capture
the overall strength of a country, I gave considerations to both quantity and quality but structured things to best capture
who would win in a competition or war.
INDIA—KEY DRIVERS OF OUR COUNTRY POWER SCORE
Overall Empire Score (0–1) Level: 0.28 Rank: 7
The Big Cycles Level Z-Score Rank Trajectory
Economic/Financial Position Highly Favorable 1.1 2
Debt Burden Low Debt 0.5 6
Expected Growth 6.4% 1.1 1
Internal Order - - - -
Wealth/Opportunity/Values Gap Relatively Large -0.3 16
Internal Conflict - - - -
External Order At Risk - - -
Eight Key Measures of Power
Cost Competitiveness Very Strong 2.4 1
Economic Output Average 0.1 4
Military Strength Average 0.3 5
Trade Weak -0.8 12
Markets & Financial Center Weak -0.7 16
Education Weak -1.1 17
Reserve Currency Status Weak -0.7 19
Innovation & Technology Weak -1.1 19
Additional Measures of Power
Character/Determination/Civility Strong 1.3 3
Resource-Allocation Efficiency Average 0.3 8
Geology Average 0.3 9
Infrastructure & Investment Average -0.3 9
Governance/Rule of Law Weak -1.1 15
Acts of Nature Very Weak -2.4 24 -
Getting better Getting worse Flat
Note: All ranks shown are out of 24, except in the case of Internal Conflict & Internal Order (out of 10) and Reserve
Currency Status (out of 19).
19THE CHANGING WORLD ORDER
THE POWERS AND PROSPECTS OF THE UNITED KINGDOM
This is our computer generated reading for the United Kingdom as of April 2022.
Based on the latest readings of key indicators, the United Kingdom appears to be a middle-of-the-pack power
(#8 among major countries today) on a flat trajectory. As shown in the table below, the key weaknesses of
the United Kingdom are its unfavorable economic/financial position and its relative lack of natural re-
sources. The eight major measures of power are somewhat weak today but are, in aggregate, moving sideways.
The table below shows our aggregate country power gauge and the major drivers, as well as the rank of each
measure of power across 24 major countries today and the trajectory over the past 20 years.
To understand a country, we start by looking at the big cycles, as well as measures of power that both reflect
and drive the rise and fall of a country. While we refer to these factors individually, they are not separate; they
interact with and reinforce one another to move a country along its cycle.
For the United Kingdom, the big cycles look somewhat unfavorable.
The UK is in an unfavorable position in its economic and financial cycles, with a high debt burden and rela-
tively low expected real growth over the next 10 years (1.2% per year). The UK has slightly more foreign debts
than foreign assets (net IIP is -24% of GDP). Non-financial debt levels are high (262% of GDP), and government
debt levels are high (109% of GDP). The bulk (93%) of these debts are in its own currency, which mitigates its debt
risks. The ability to use interest rate cuts to stimulate the economy is low (short rates at 0.4%), and the country is
already printing money to monetize debt.
Internal disorder is a moderate risk. Wealth, income, and values gaps are relatively large (relative to countries of
similar per capita income levels). Regarding inequality—the top 1% and top 10% in the United Kingdom capture
13% and 36% of income (respectively the 18th and 17th highest share across major countries). Our internal con-
flict gauge is average. This gauge measures actual conflict events (e.g., protests), political conflict (e.g., partisan-
ship), and general discontent (based on surveys).
On the eight key measures of power, the United Kingdom looks somewhat weak in aggregate. It has no
particularly prominent strengths or weaknesses that I will call out.
20C O U N T RY P O W E R I N D E X 2 0 2 2
Note: With this page, I am calling out a few of the major gauges and a few of the stats within each gauge that reflect
the broad trends we are seeing. The aggregate gauges and final country power score I am showing include hundreds of
individual stats that we aggregate based on relevance, quality, and consistency across countries and time. To best capture
the overall strength of a country, I gave considerations to both quantity and quality but structured things to best capture
who would win in a competition or war.
UNITED KINGDOM—KEY DRIVERS OF OUR COUNTRY POWER SCORE
Overall Empire Score (0–1) Level: 0.27 Rank: 8
The Big Cycles Level Z-Score Rank Trajectory
Economic/Financial Position Unfavorable -1.5 24
Debt Burden High Debt -1.8 23
Expected Growth 1.2% -0.7 13
Internal Order Moderate Risk -0.3 8
Wealth/Opportunity/Values Gap Relatively Large -0.3 15
Internal Conflict Average -0.3 7
External Order At Risk 0.4 -
Eight Key Measures of Power
Reserve Currency Status Average -0.5 4
Markets & Financial Center Average 0.0 5
Trade Weak -0.5 6
Military Strength Average -0.2 7
Education Average -0.3 8
Innovation & Technology Average -0.3 8
Economic Output Weak -0.6 8
Cost Competitiveness Average -0.4 13
Additional Measures of Power
Governance/Rule of Law Strong 1.2 3
Resource-Allocation Efficiency Average -0.3 13
Character/Determination/Civility Average -0.3 15
Infrastructure & Investment Weak -0.7 16
Geology Weak -0.8 22
Acts of Nature Average 0.3 8 -
Getting better Getting worse Flat
Note: All ranks shown are out of 24, except in the case of Internal Conflict & Internal Order (out of 10) and Reserve
Currency Status (out of 19).
21THE CHANGING WORLD ORDER
THE POWERS AND PROSPECTS OF FRANCE
This is our computer generated reading for France as of April 2022.
Based on the latest readings of key indicators, France appears to be a modest power (in the middle third of
countries we rank) on a flat trajectory. As shown in the table below, the key weaknesses of France are its un-
favorable economic/financial position, its people’s lower than average work ethic and low self-sufficiency,
and its relatively poor allocation of labor and capital. The eight major measures of power are somewhat weak
today but are, in aggregate, moving sideways.
The table below shows our aggregate country power gauge and the major drivers, as well as the rank of each
measure of power across 24 major countries today and the trajectory over the past 20 years.
To understand a country, we start by looking at the big cycles, as well as measures of power that both reflect
and drive the rise and fall of a country. While we refer to these factors individually, they are not separate; they
interact with and reinforce one another to move a country along its cycle.
For France, the big cycles look mixed.
France is in an unfavorable position in its economic and financial cycles, with a moderately high debt bur-
den and relatively low expected real growth over the next 10 years (0.5% per year). France has modestly more
foreign debts than foreign assets (net IIP is -25% of GDP). Non-financial debt levels are high (269% of GDP),
and government debt levels are high (109% of GDP). France’s debts are largely in euros, which increases
France’s debt risks, since this is not a currency that France directly controls. The ability to use interest rate cuts
to stimulate the economy is low for the Eurozone (short rates at -0.6%), and Europe is already printing money
to monetize debt.
Internal disorder is a low risk. Wealth, income, and values gaps are narrow (relative to countries of similar
per capita income levels). Regarding inequality—the top 1% and top 10% in France capture 10% and 32% of
income (respectively the 22nd and 23rd highest share across major countries). Our internal conflict gauge is
average. This gauge measures actual conflict events (e.g., protests), political conflict (e.g., partisanship), and
general discontent (based on surveys).
On the eight key measures of power, France looks somewhat weak in aggregate. It has no particularly
prominent strengths or weaknesses that I will call out.
22C O U N T RY P O W E R I N D E X 2 0 2 2
Note: With this page, I am calling out a few of the major gauges and a few of the stats within each gauge that reflect
the broad trends we are seeing. The aggregate gauges and final country power score I am showing include hundreds of
individual stats that we aggregate based on relevance, quality, and consistency across countries and time. To best capture
the overall strength of a country, I gave considerations to both quantity and quality but structured things to best capture
who would win in a competition or war.
FRANCE—KEY DRIVERS OF OUR COUNTRY POWER SCORE
Overall Empire Score (0–1) Level: 0.26 Rank: 9
The Big Cycles Level Z-Score Rank Trajectory
Economic/Financial Position Unfavorable -1.0 19
Debt Burden Moderately High Debt -0.8 19
Expected Growth 0.5% -0.9 18
Internal Order Low Risk 0.5 4
Wealth/Opportunity/Values Gap Narrow 1.1 1
Internal Conflict Average -0.1 6
External Order At Risk - - -
Eight Key Measures of Power
Military Strength Average -0.1 6
Markets & Financial Center Average -0.3 7
Trade Weak -0.5 7
Economic Output Weak -0.6 9
Innovation & Technology Average -0.5 10
Education Weak -0.5 11
Cost Competitiveness Weak -0.6 21
Reserve Currency Status - - - -
Additional Measures of Power
Infrastructure & Investment Average -0.2 8
Governance/Rule of Law Average 0.3 10
Geology Average -0.5 14
Resource-Allocation Efficiency Weak -1.6 22
Character/Determination/Civility Weak -1.5 23
Acts of Nature Average 0.0 10 -
Getting better Getting worse Flat
Note: All ranks shown are out of 24, except in the case of Internal Conflict & Internal Order (out of 10) and Reserve
Currency Status (out of 19).
23THE CHANGING WORLD ORDER
THE POWERS AND PROSPECTS OF RUSSIA
This is our computer generated reading for Russia as of April 2022.
Based on the latest readings of key indicators, Russia appears to be a modest power (in the middle third
of countries we rank) on a flat trajectory. As shown in the table below, the key strengths of Russia are its
strong economic and financial position, its wealth of natural resources, and its strong military. Its weak-
nesses are its corruption and inconsistent rule of law, its poor infrastructure and low investment, and its
relative unimportance as a global financial center. The eight major measures of power are somewhat weak
today but are, in aggregate, moving sideways.
The table below shows our aggregate country power gauge and the major drivers, as well as the rank of each
measure of power across 24 major countries today and the trajectory over the past 20 years.
To understand a country, we start by looking at the big cycles, as well as measures of power that both reflect
and drive the rise and fall of a country. While we refer to these factors individually, they are not separate; they
interact with and reinforce one another to move a country along its cycle.
For Russia, the big cycles look mixed.
Russia is in a somewhat favorable position in its economic and financial cycles, with a low debt burden and
modest expected real growth over the next 10 years (2.6% per year). Russia has modestly more foreign assets than
foreign debts (net IIP is 33% of GDP). Non-financial debt levels are low (99% of GDP), and government debt
levels are low (15% of GDP). A significant share (24%) of Russia’s debt is denominated in foreign currencies,
which increases its debt risks.
Internal disorder is a moderate risk. Wealth, income, and values gaps are large (relative to countries of similar
per capita income levels). Regarding inequality—the top 1% and top 10% in Russia capture 21% and 46% of
income (respectively the 4th and 10th highest share across major countries). Our internal conflict gauge is high.
This gauge measures actual conflict events (e.g., protests), political conflict (e.g., partisanship), and general dis-
content (based on surveys).
External disorder is a risk. Most importantly, Russia and the United States, which is declining but remains
the #1 power (all things considered), are having significant conflict as measured by our external conflict gauge.
Looking in more detail at the eight key measures of power—Russia has a relatively strong military. A moderate
share (5%) of global military spending is by Russia, and it has a moderate share (8%) of the world’s military personnel.
We net this against its relative unimportance as a global financial center. Its equity markets are a small share
of the world total (less than 1% of total market cap and less than 1% of volume), and a small share of global
transactions happen in RUB (1%).
24C O U N T RY P O W E R I N D E X 2 0 2 2
Note: With this page, I am calling out a few of the major gauges and a few of the stats within each gauge that reflect
the broad trends we are seeing. The aggregate gauges and final country power score I am showing include hundreds of
individual stats that we aggregate based on relevance, quality, and consistency across countries and time. To best capture
the overall strength of a country, I gave considerations to both quantity and quality but structured things to best capture
who would win in a competition or war.
RUSSIA—KEY DRIVERS OF OUR COUNTRY POWER SCORE
Overall Empire Score (0–1) Level: 0.26 Rank: 10
The Big Cycles Level Z-Score Rank Trajectory
Economic/Financial Position Somewhat Favorable 0.7 5 -
Debt Burden Low Debt 1.2 3
Expected Growth 2.6% -0.2 7 -
Internal Order Moderate Risk -1.2 9
Wealth/Opportunity/Values Gap Large -1.8 18
Internal Conflict High -0.5 9
External Order At Risk -2.1 -
Eight Key Measures of Power
Military Strength Strong 0.6 3
Cost Competitiveness Strong 0.7 7 -
Economic Output Average -0.5 7
Reserve Currency Status Weak -0.7 8 -
Education Average -0.5 9
Innovation & Technology Weak -0.7 14
Trade Weak -0.9 17
Markets & Financial Center Weak -1.0 17
Additional Measures of Power
Geology Very Strong 2.1 1
Resource-Allocation Efficiency Average -0.1 9 -
Character/Determination/Civility Average 0.2 10 -
Governance/Rule of Law Very Weak -1.9 20
Infrastructure & Investment Weak -1.0 21
Acts of Nature Average -0.1 11 -
Getting better Getting worse Flat
Note: All ranks shown are out of 24, except in the case of Internal Conflict & Internal Order (out of 10) and Reserve
Currency Status (out of 19).
25You can also read